4 min
August is here and with the heat we bring you all the latest features available on Domotz including MySQL Server Monitoring and pre-configured SNMP sensors for switches.
- You can now group your Sites into Organizations
- We’ve got pre-configured SNMP sensors for network interfaces and switches
- There’s a New Sites Explorer section and left-side menu
- More improvements to the Inventory section
- MySQL Server Monitoring
- You can now configure SAML/SSO for multiple teams
- Pagination for Kaseya BMS account list
What’s new
Organizations
You can now organize your Sites (Domotz Agents) into Organizations which means better multi-tenant management.
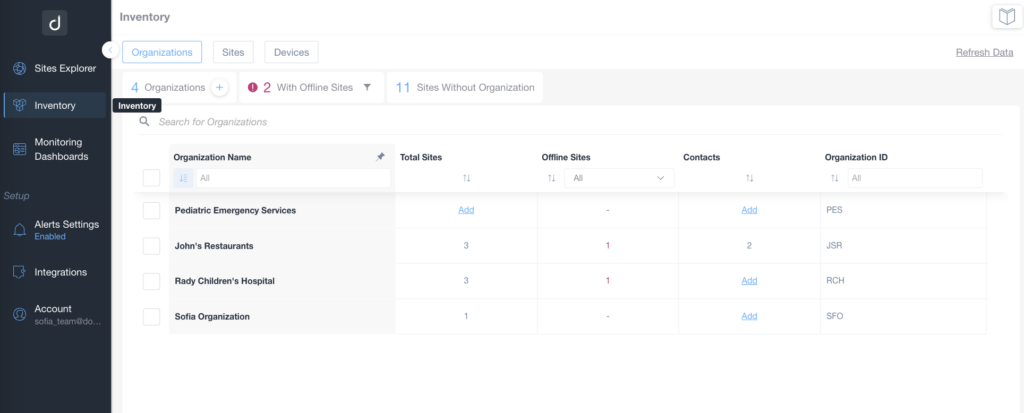
This new feature is available in the Inventory section. From the Inventory section you can create one or more Organizations, and afterwards choose which organizations your Sites belong to.
For each Organization, you can also create one or more Contacts.
Additionally, the new tab will give you a high level overview of the Organizations that have Sites requiring your attention.
Clicking on the number of Sites under each Organization lets you quickly review all the Sites belonging to an Organization as well as their status.
MySQL Server Monitoring
We now include MySQL Server Monitoring. Through our Custom Integration Drivers framework you can now monitor MySQL Server status.
Monitor your MySQL database including status and metrics. MySQL server monitoring is available for databases you host on Linux servers.

Here’s what you can do with this new integration:
- Monitor the service status and version
- Keep track of the memory the service is using
- Record key metrics, such as average queries per second, slow queries, uptime and more.
For more information, please visit Monitoring MySQL server through Domotz.
Improvements
Pre-configured SNMP templates for Network Interfaces
We’ve added a new set of pre-configured SNMP sensors for Network Interfaces.
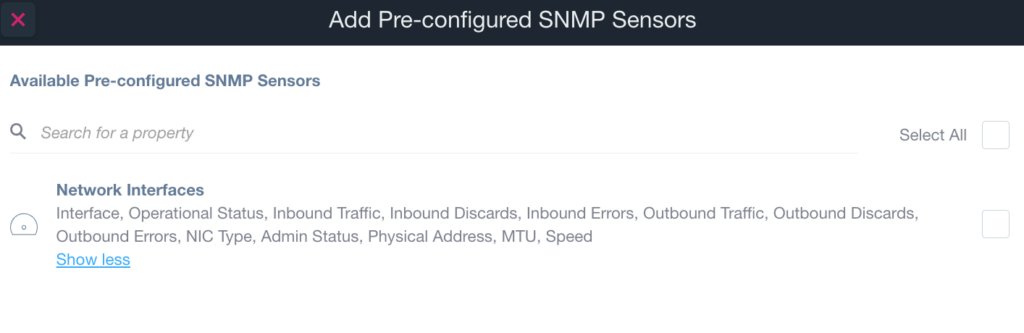
Firstly, you can use this new templates for monitoring every Network Switch that’s out there. Moreover, for network interfaces you can automatically extract all kinds of information. Monitor operational and admin status, inbound and outbound traffic, package discards, errors, MTU, speed status, as well as the Physical MAC address for each port.
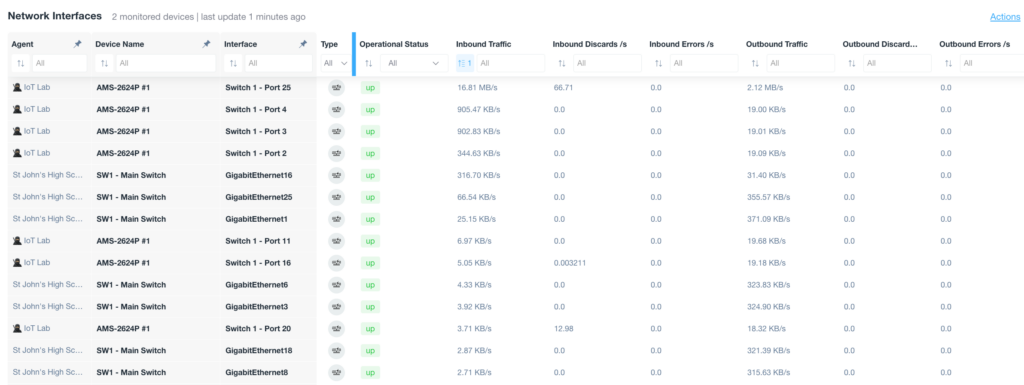
The Monitoring Tables (in the Monitoring Dashboard section) also reports this information so that you can compare traffic statistics across multiple ports, managed network switches, and different sites.
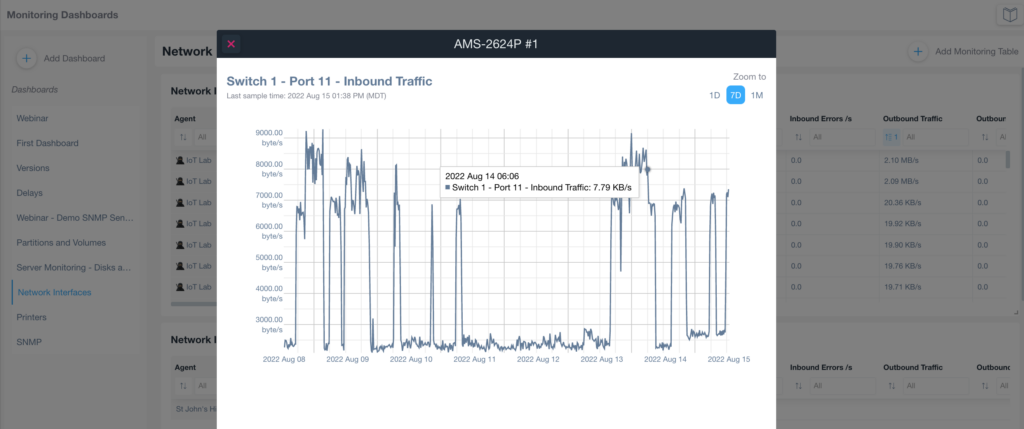
Lastly, this new features includes reporting in graph format. The reports include both historical data and statistical information.
SAML / SSO for multiple teams
If you are configured with an Enterprise level multi-team structure (basically multiple Domotz Team Leader accounts reporting to the same hierarchy), you can now configure all the teams with the same IdP to allow a smooth SSO via SAML 2.0.
Domotz is compatible with any SAML 2.0 Identity Provider. In particular the system has been tested (and instructions to configure them provided) with the following IdP:
- Okta
- Azure AD
- JumpCloud
- Evo Security
If you are willing to use a different Identity Provider supporting SAML 2.0, please contact our Support.
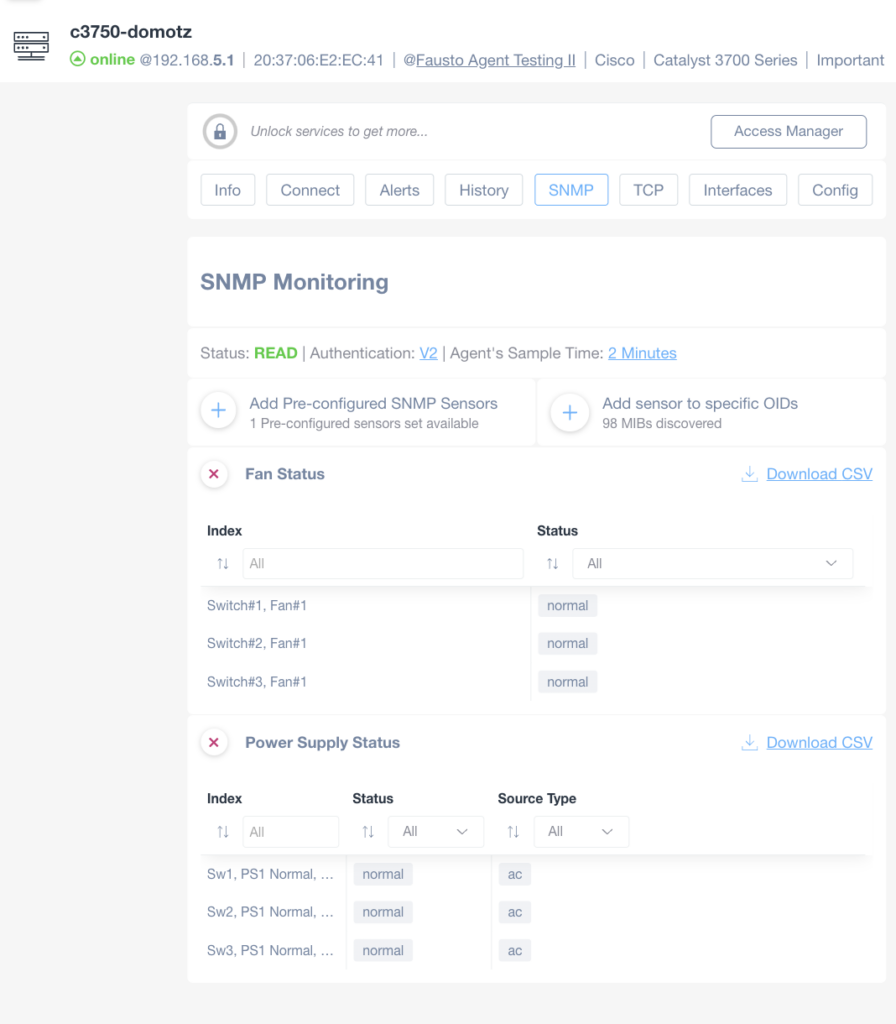
Pre-configured SNMP templates for Cisco
We’ve added two new pre-configured SNMP sensors for Cisco devices. These new sensors automatically enable monitoring for:
- Fan Status
- Power Supply Status
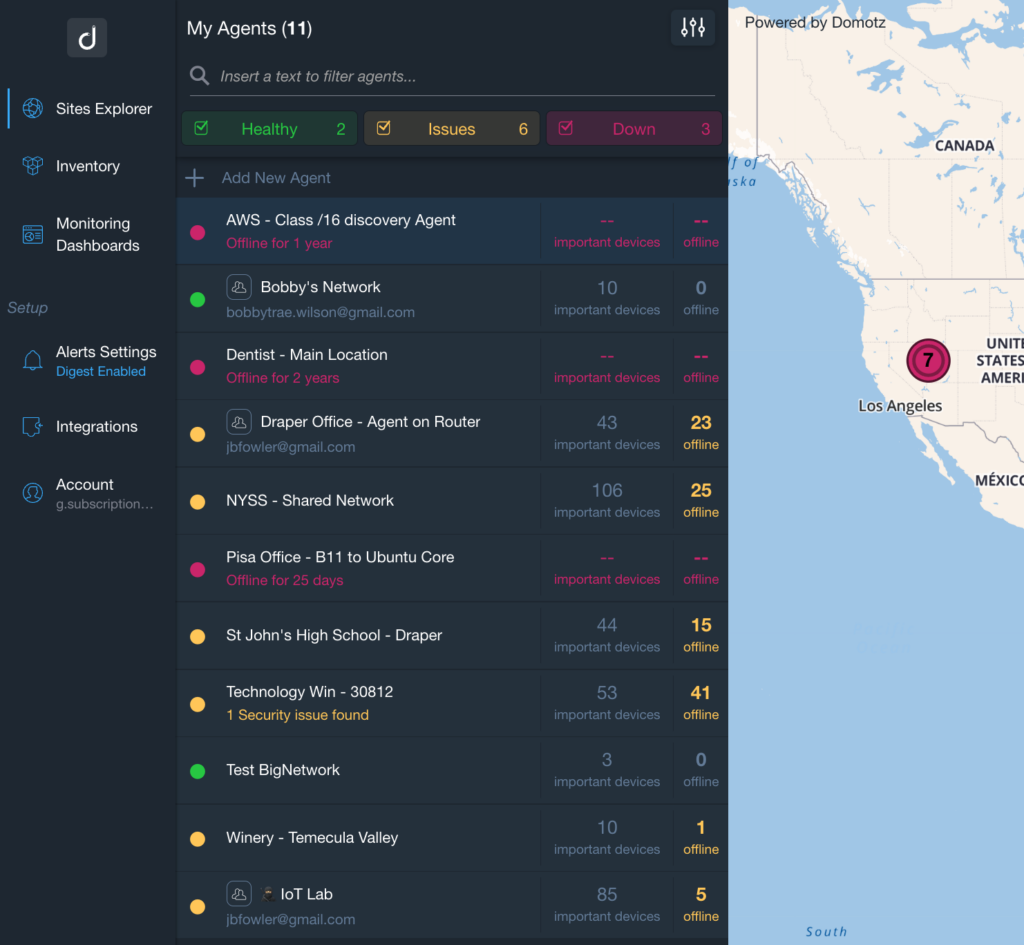
Sites Explorer
At Domotz we strongly value your feedback. After receiving input from several of you, we chose to restore the “All Agents” legacy view in the WebApp and Desktop App .
Additionally, the Legacy view has a new name, “Site Explorer”, which you can see on the top of the left sidebar menu.
The “Manage” menu tab has a new name, which is “Inventory”. You can continue using the “Inventory” tab to access all of your data (Organizations, Sites, Devices, etc.)
With the new “Site Explorer” view, we plan to continuously work on improvements in terms of usability and overall navigation experience.
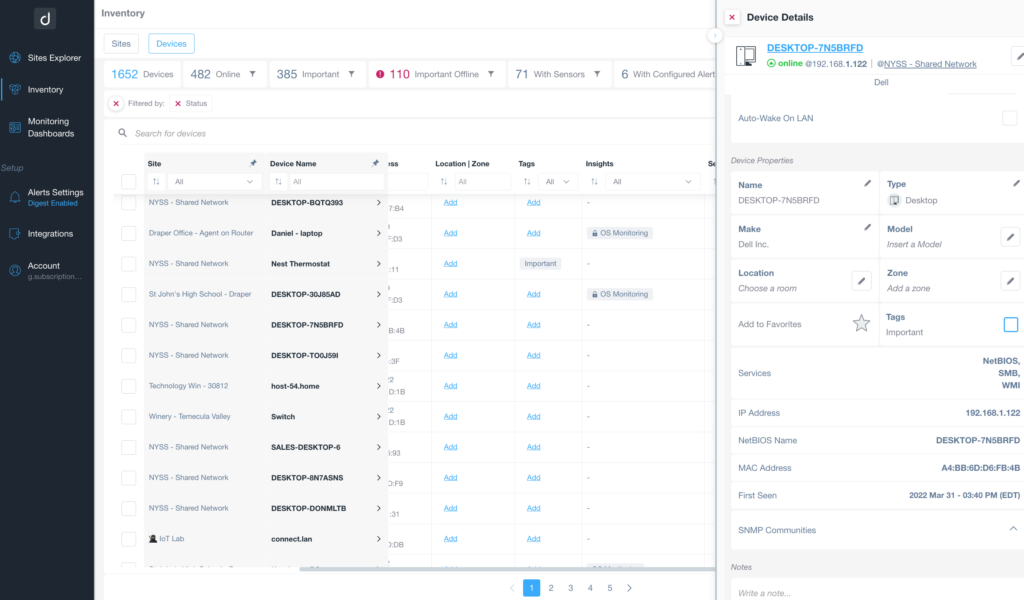
Improvements on the Inventory section
The right-menu in the Tags section now lets you focus in to review the tags applied to specific devices.
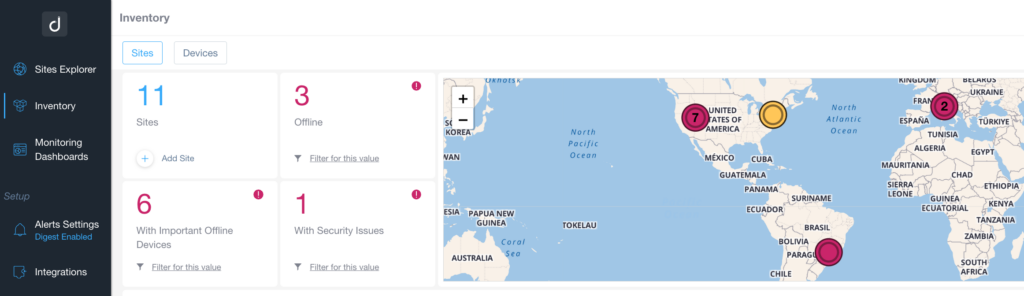
Moreover, the number of Sites with Important “Offline” devices no longer includes Sites which are completely offline. We’ve done this in order to avoid confusion on the total number of Sites with devices offline. Similarly, the number of Sites with “Security Issue” highlights only the Sites which are currently online.
Enabled Pagination on Kaseya BMS list of Accounts
When mapping Domotz Agents to your Kaseya BMS account, we can now retrieve a long list of PSA Accounts:
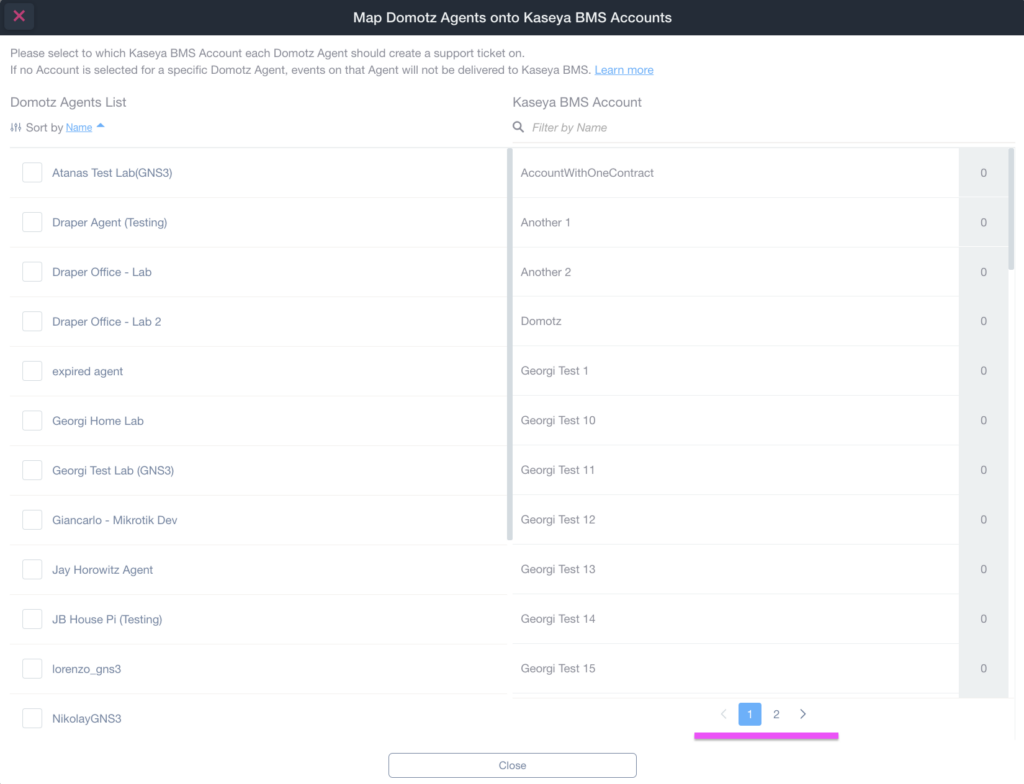
What’s more, is that you can now map Domotz to Kaseya BMS even if you have tens of thousands of Accounts on your list. Additionally, you can map your accounts by searching for the Account name, or by scrolling down the list across multiple pages.
Added support for TCP protocol within Custom Integration Drivers
Using our Custom Integration driver framework we now include the capability to add support for TCP connections.
For more information, please refer to the Driver API Documentation under the D.device.sendTCPCommand.
Additional MIBs available in the Domotz Database
Additional MIB files are available for the following devices. Additionally, you can search for their OIDs from Domotz:
- ASUSTOR
- Stormshield Firewalls
Fix
We’ve fixed the following issues:
- The Configuration Management backup was not executing properly in some cases.
- The Pre-Configured SNMP sensor template not working on some printers.
- Issue logging into the WebApp with an Area Member account.
- Configuration Management: the issue causing a mixing up device configuration for same agent at the same time has been fixed.
- Configuration Management: SonicWall https calls timeout too low to fetch config in some cases.
- Fix for SNMP Counter64 variables within Custom Integration Drivers.
- Some Agents configured on Synology NAS were restarting continuously every 2 minutes.
- Fix for Sporadic Errors in retrieving configuration files for Juniper OS systems.
- Fix for Errors in identifying Virtual Machine details
- Topology Map: a fix for an issue that was preventing the export of an XLS file (for the Visio import).
- An issue preventing the correct mapping in some situation between Domotz Agents and HaloPSA Accounts have been fixed.
Known limitations
- Monitoring Dashboards are currently limited to Monitoring Tables as Widgets. Furthermore, they do not report some variables (e.g. the ones created by the Custom Drivers) within the Monitoring Tables.
- Luxul Router-based Agents do not support VPN on demand. To elaborate, we’ll add this capability as soon as Luxul’s team provides us with the required API resources.
- Devices with multiple network interfaces (multiple MAC addresses) can’t be merged into a single device. This affects some types of switches that appear as multiple instances on Domotz when VLANs are configured.
- The static IP address on the Domotz Box cannot be configured before configuring the Agent.
- DHCP cannot be leveraged on additional VLANs on the Domotz Box.
To conclude, these release notes cover the changes in the Domotz Pro service since the previous one. Furthermore, these changes include Domotz Pro cloud, Domotz Agent, and Domotz Pro App.
Lastly, to learn more about check out our network monitoring software or check out our Know Your Networks Blog.