Your dashboard, your way. Create your own Custom Monitoring Dashboards tailored to your needs.
What is a Monitoring Dashboard?
A Domotz Monitoring Dashboard is a customizable dashboard that you can create to monitor information about the devices you choose, from different Domotz Agents (Sites).
In addition, on Domotz Monitoring Dashboards, you can configure, display, and set alerts on any type of sensor (SNMP, OS monitoring, Automation Scripts, etc.) values on multiple devices, across different sites.
You can create and edit multiple Monitoring Dashboards and include different widgets (limited to Monitoring Tables at the moment) in each Dashboard. All Monitoring Dashboard are shared across the entire account so that each Team Member can see the Monitoring Dashboards created by a colleague. Access to the devices may be limited based on a Team Member’s permissions.
How to create a Monitoring Dashboard
Select the “Monitoring Dashboards” section from the Domotz main menu, and then click on “Add Dashboard”:

Insert a unique Monitoring Dashboard name:

and start adding your Monitoring Tables to the newly created Dashboard, by choosing a Domotz Monitoring Table templates:


Creating and Editing Monitoring Tables
Once selected a Monitoring Table template, you will be able to customize both the default device columns (Device Information) and the template specific ones (in this case the Connectivity Status & Uptime templates):

Device Information Columns
If clicked, you will be able to add/remove the device information columns:

Template Specific Columns
Here instead you will be able to add/remove the selected template specific columns.
Following an example from the “Connectivity Status & Uptime” template:

This is instead from the ‘Network Traffic’ template:

Device Selection
After selecting the information which will be displayed in the Monitoring Table template, you will be able to add the devices you would like to include in the selected Monitoring Table template:

Static and Dynamic Tables
You can create a Static or Dynamic table:

Static tables will contain only those devices which you will select at the time that you create the table.
Dynamic tables instead, will automatically add a new device to the table once it will find a device which matches the selected template.
For example if you have created a table which is monitoring HP-ILO disks, if a new HP-ILO controller is found on the network by Domotz it will be automatically added to that table.
After selecting the devices you would like to monitor and clicking “Next” you will be able to edit the Table Name and display the monitoring table:


Editing an already created Monitoring Table
You will be able to edit a monitoring dashboard by using the ‘Actions’ menu at top right of the monitoring table which will be shown by hovering the chosen table to edit:

Using this menu you will be able to:
- edit the table name
- add/remove devices from the monitoring dashboard
- add/remove columns
- detach the monitoring table from the dashboard and open it in a new window which can be moved to another monitor
- download a csv containing all the sensor values for the monitored devices in that table
- delete the monitoring table
Each Monitoring Dashboard can contain multiple Monitoring Tables, allowing you to monitor all the relevant devices of multiple Sites/Customers in a single view:
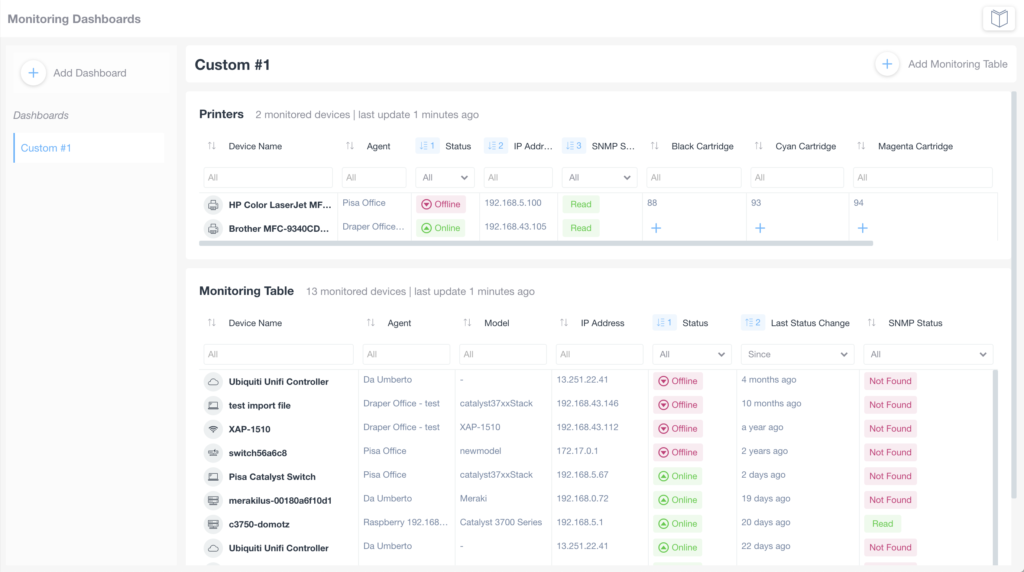
Monitoring Tables examples
Following you will see some monitoring tables examples

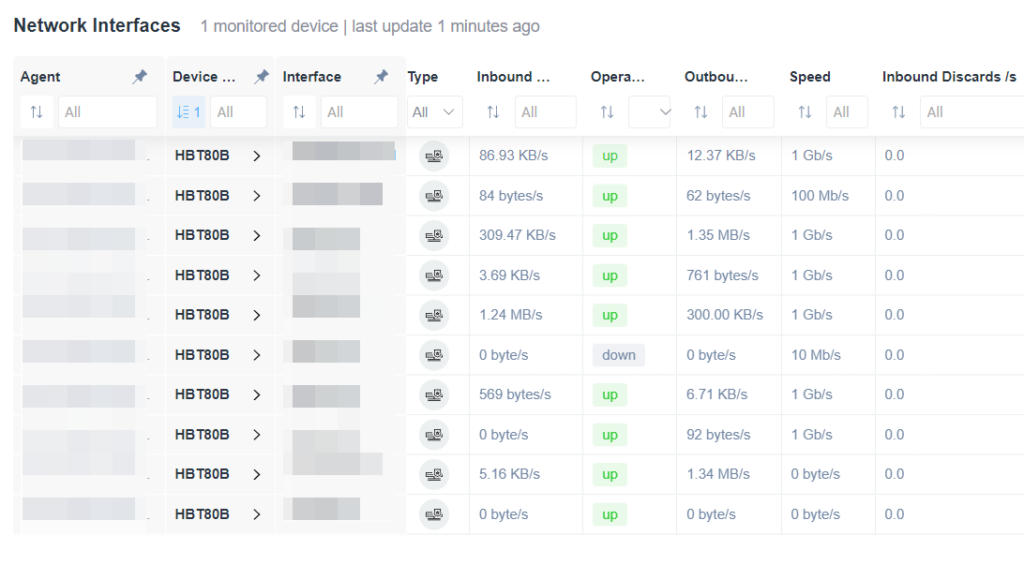


Monitoring Table Settings
SNMP Sensors
When an SNMP sensor is selected as one table property (column), not all the devices in that table may have it configured. When the sensor is not configured a “+” icon will appear in the cell, allowing you to add it to the device immediately. Once added, within a few minutes, the value will be fetched and displayed on the table.
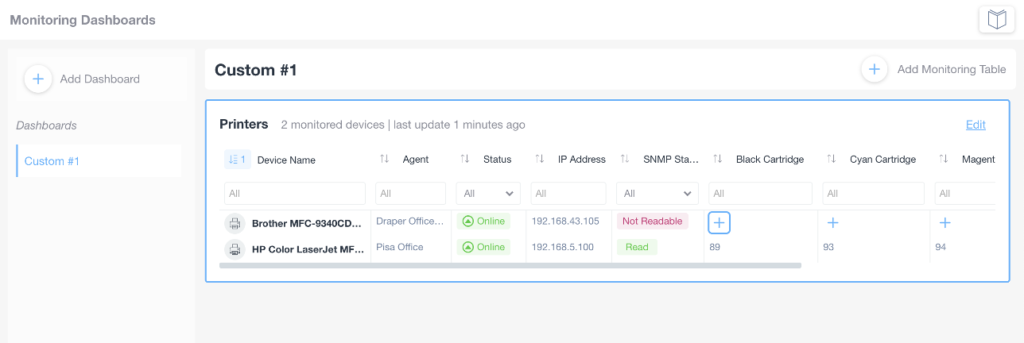
Column Options:
All the table columns offer the following options for each of the different columns:
- Filter
- Sort – also available for multiple columns
- Drag to change columns order
- Resize
- Rename
- Pin to side

You can select the edit option by moving the mouse over the column header.
Grid view
You can put your monitoring tables in a grid view by resizing them and dragging them to the preferred area of your screen:
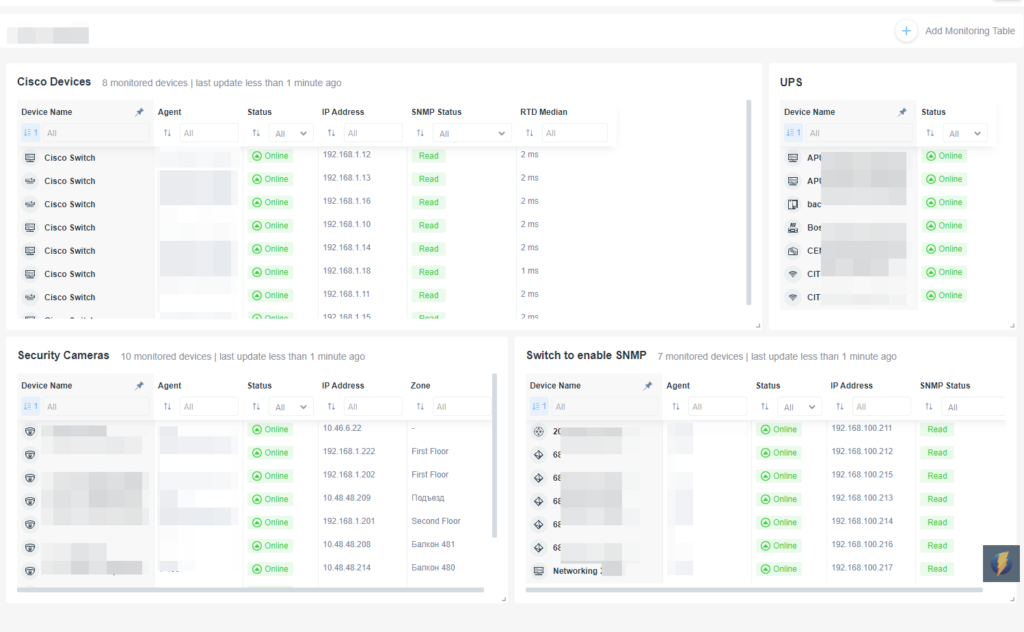
This view is very useful to monitor your devices on wide screens, and multiple monitors.
