
This article covers creating custom driver table variables.
To start off, Custom Driver Tables enable you to extract structured data that is well-organized and easy to understand. On the other hand, Custom Driver Variables allow you to monitor scalar values.
For example, with the Custom Driver Table Variables you can display resource consumption statistics for the all running docker containers on the host devices. The table contains a unique identifier for each row, in this case the Docker Container ID, and columns in a table show your defined value, which is an instance of various key/value pairs.
How to create Custom Driver Table Variables
Through a simple JavaScript code, you can now create your Custom Driver Table Variables.
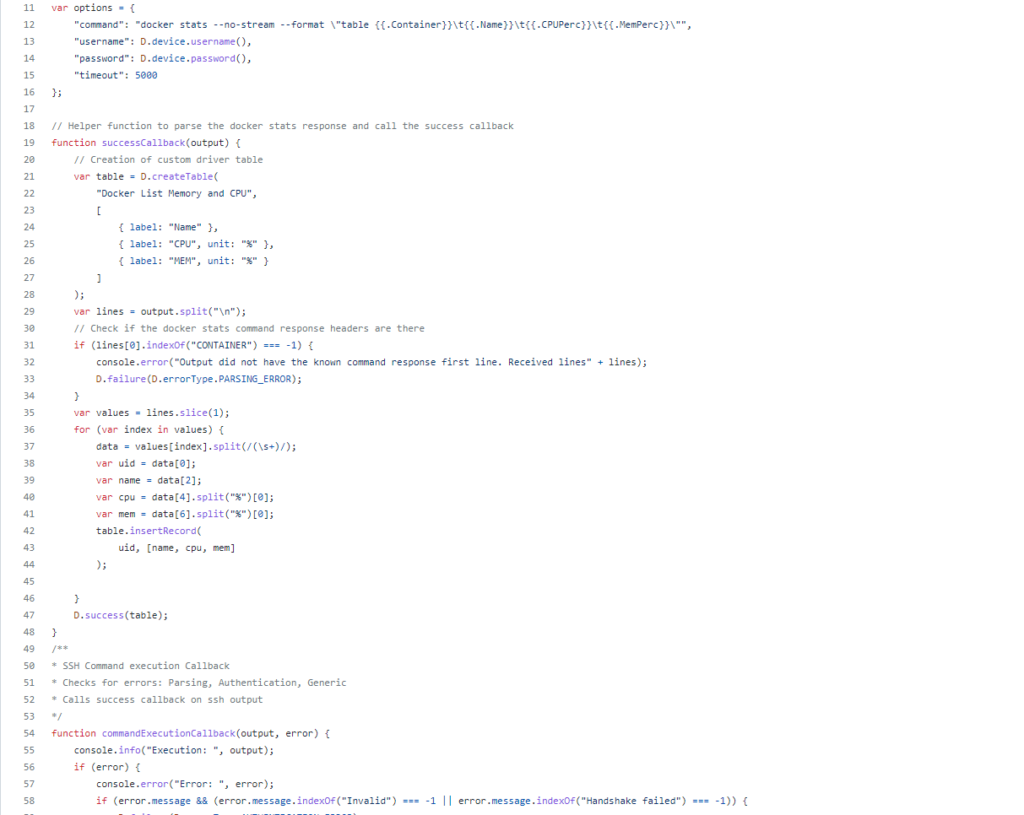
JavaScript Code for Docker Stats Parsing and Callback Functions
1. Define an object `options` with properties for command, username, password, and a timeout value.
2. Create a function `successCallback(output)` to parse Docker stats and execute a success callback:
- Initialize a table with columns for `Name`, `CPU`, and `MEM`, each with a percentage unit.
- Split the output string into lines and check if the first line contains "CONTAINER". Log an error and fail parsing if not.
- Extract values from subsequent lines, separate them by whitespace, and extract container ID, name, CPU usage, and memory usage.
- Insert these values into the table.
3. If all operations succeed, call `D.success(table)`.
4. Define `commandExecutionCallback(output, error)` to handle execution results:
- Log "Execution:" followed by output or error.
- If an error message includes "Invalid" or "Handshake failed," display an error message.
To start, you can define the communication protocol, for example SSH. You can do that, by creating an object and its properties such as command, username, password, timeout, and so on:
as in the example below:
var options = {
	"command": "docker stats --no-stream --format \"table {{.Container}}\t{{.Name}}\t{{.CPUPerc}}\t{{.MemPerc}}\"",
	"username": D.device.username(),
	"password": D.device.password(),
	"timeout": 5000
	};
Then, define a variable and create a driver table, name it, and assign column labels as follows:
var MyTable = D.createTable("My Driver Table", [{"label": "Column A"}, {"label": "Column B", "unit": "%"}])
After parsing the response of the communication protocol variable, simply insert the result into the custom driver table object by:
MyTable.insertRecored(id, values)
and the final table and values will be send to the cloud with the D.success() callback implicitly.
D.success(MyTable)
Example: Docker Containers monitoring with Domotz Custom Driver Table
Below you can see a Custom Driver Table (with a 5 minute scheduled update). The Id column in this case is the Docker container ID, the column Name is the container name, the CPU and Memory column are self explanatory.
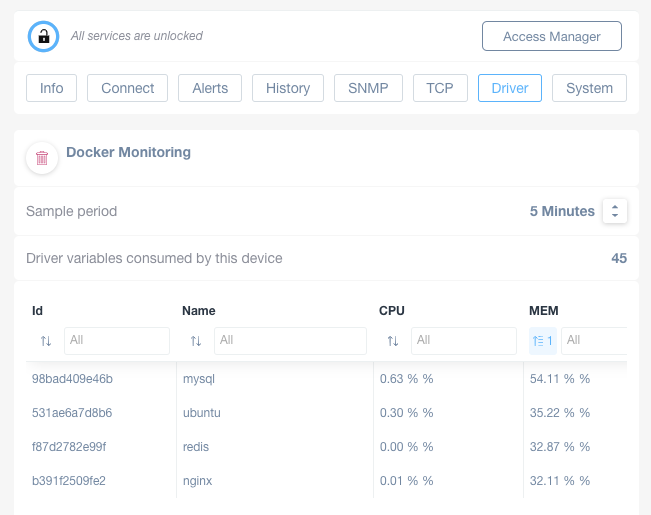
Docker Monitoring Interface Overview
1. At the top, there are navigation tabs for Info, Connect, Alerts, History, SNMP, TCP, Driver, and System, with the Driver tab currently selected.
2. The section below is labeled "Docker Monitoring." It shows a "Sample period" set to "5 Minutes," which can be adjusted with a dropdown menu.
3. "Driver variables consumed by this device" shows a count of 45.
4. A table displays columns labeled Id, Name, CPU, and MEM. There are options to sort or filter each column.
5. Four rows of data are shown with IDs, corresponding service names (mysql, ubuntu, redis, nginx), CPU usage percentages, and memory usage percentages. For example, mysql shows 0.63% CPU and 54.11% MEM usage.