
The new year is here, and we’re hitting the ground running! January’s release is all about simplifying your workflow, giving you more control, and helping you get the most out of Domotz. From enhanced device management tools and new Zoom scripts to a reimagined onboarding process, we’ve focused on making monitoring and managing your networks easier than ever.
We’re committed to your success, and as always, your feedback plays a huge role in shaping Domotz. Have thoughts or questions? Reach out to us anytime at support@domotz.com. Let’s tackle 2025 together!
New features and integrations
New features
Simplified Onboarding: Start with What Matters Most
We’ve revamped the onboarding process to make it faster, easier, and more tailored to your specific needs—especially since you’re charged per managed device. Now, you can immediately focus on delivering results for your clients. You can hit the ground running while keeping your costs and resources optimized.
We redesigned the process to ensure you start with the devices that matter most, making setup more intuitive and efficient. With minimal setup time, you’ll quickly gain better visibility, streamline management, and achieve faster results.
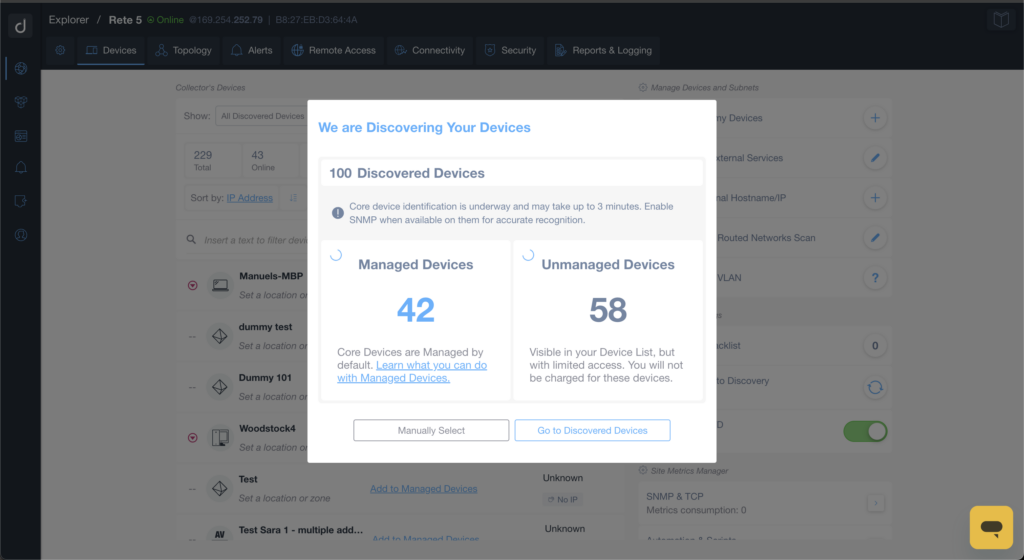
Device Discovery and Management Summary
1. A pop-up window shows "100 Discovered Devices" with a breakdown of 42 Managed Devices and 58 Unmanaged Devices.
2. Managed Devices are automatically managed and referred to a help section for more details.
3. Unmanaged Devices are visible but have limited access with no charges applicable.
4. A button labeled "Manually Select" allows for manual selection of devices.
5. Another button, "Go to Discovered Devices," directs users to view the list of discovered devices.
Improved Dummy Device Management
We’ve enhanced the settings for Dummy Devices, allowing you to add and manage serial numbers directly from the detail view. This improvement makes tracking device details easier, ensuring more accurate records and streamlined inventory management.
With this added control, MSPs can maintain better documentation of client networks, saving time during audits or when troubleshooting. It also helps avoid confusion when managing multiple similar devices.
Automation and Scripts
FS
FS Switches Configuration Backup
Use this script to back up the configuration of FS switches. Please note that the script uses SSH protocol and has been validated and tested on FS Switch S3400-24T4FP (FS OS 2.2.0D).
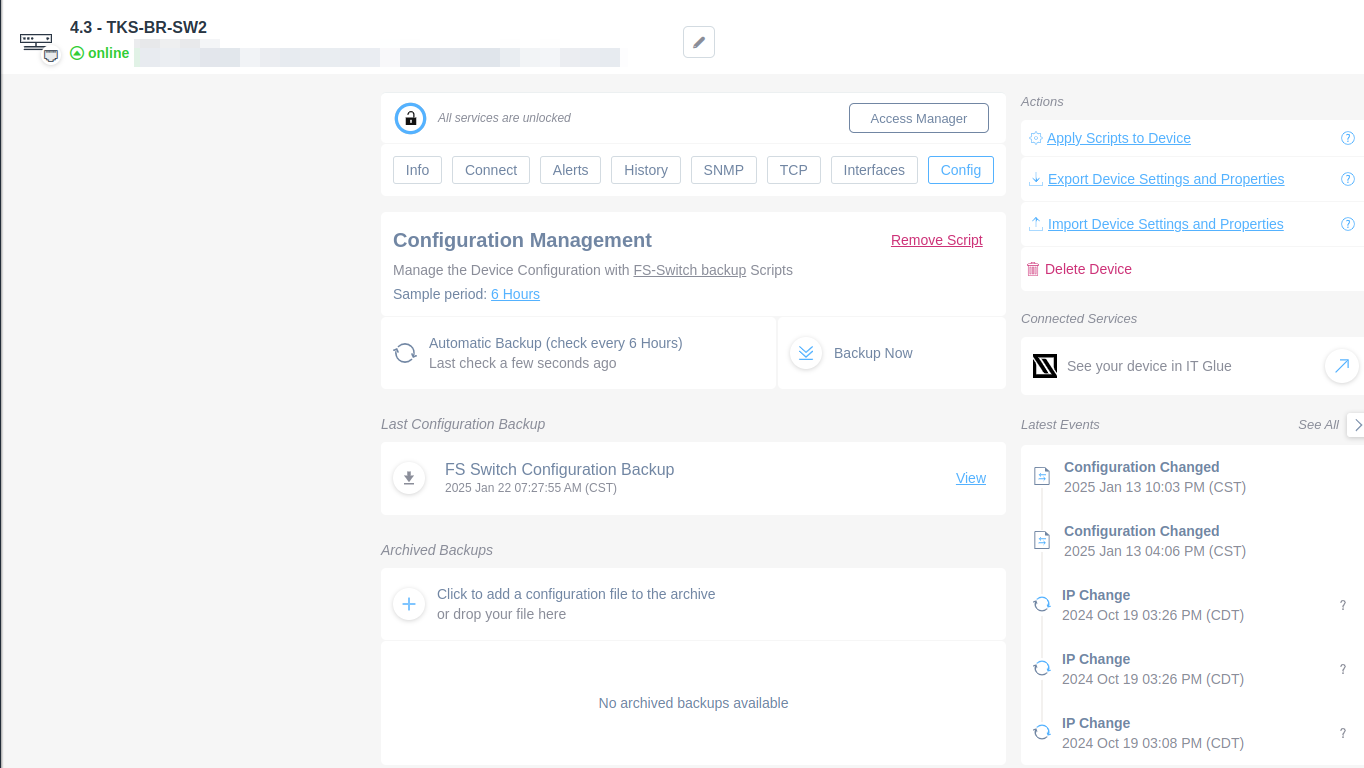
Device Configuration Management Interface
1. At the top, the device "TKS-BR-SW2" is shown as online. It includes options for managing services and access.
2. Configuration management allows users to manage device configurations using FS-Switch backup scripts, with a sample period set to 6 hours.
3. Options include enabling automatic backups every 6 hours or manually initiating a backup with the "Backup Now" button.
4. The last configuration backup is displayed, detailing a backup labeled "FS Switch Configuration Backup" completed on January 22, 2025.
5. Users can add configuration files to the archive or drop files into the designated area, though no archived backups are currently available.
6. The Actions panel provides options to apply scripts to the device, export or import device settings, and delete the device.
7. Connected services include access to IT Glue for device-related information.
8. Latest events summarize recent changes, including configuration changes and IP changes, with timestamps provided for each event.
psSense
pfSense Firewall Configuration Management
Apply the pfSense Firewall Configuration Management script to prevent information loss.
Please note that the script uses HTTPS protocol and has been validated and tested on pfSense Firewall 2.7.2.
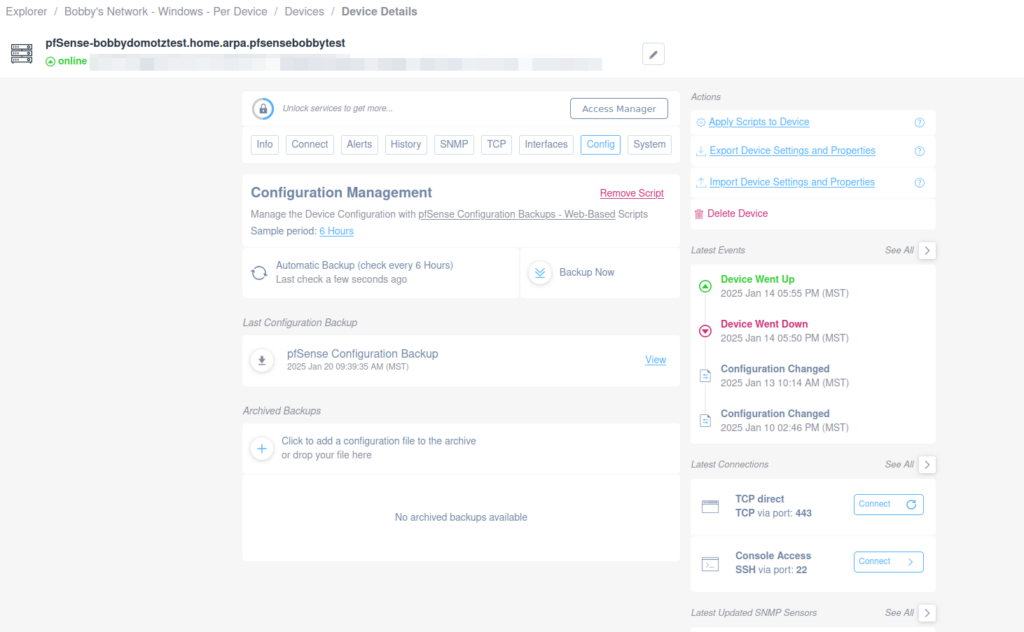
Device Configuration and Management Interface
1. The interface displays details for the device "pfsense-bobbydomotztest," indicating its online status.
2. Main navigation options include Info, Connect, Alerts, SNMP, TCP, Interfaces, Config, and System.
3. Under "Configuration Management," options are available for managing device configurations, including pfSense Configuration Backups and Web-Based Scripts. The automatic backup is set to occur every six hours.
4. "Backup Now" initiates an immediate backup. The most recent configuration backup is displayed with a timestamp (January 20, 2025, 09:39:35 AM, MST).
5. For archived backups, users can add files by clicking the provided option or dragging files into the designated area.
6. The "Actions" section includes options to apply, export, and import device settings, as well as delete the device.
7. Recent events are shown, listing device status changes and configuration updates with corresponding timestamps.
8. The latest connections highlight TCP and SSH access options, each with a "Connect" button.
9. There are sections for recent SNMP sensor updates.
Zoom
Zoom Workspace Usage
This custom script allows you to monitor the status and availability of Zoom workspaces.
Applying this script, you will be able to monitor the following:
- Workspace In Use
- Workspace Not In Use
- Desk In Use
- Desk Not In Use
- Room In Use
- Room Not In Use
Workspace usage script uses HTTPS as a communication protocol.
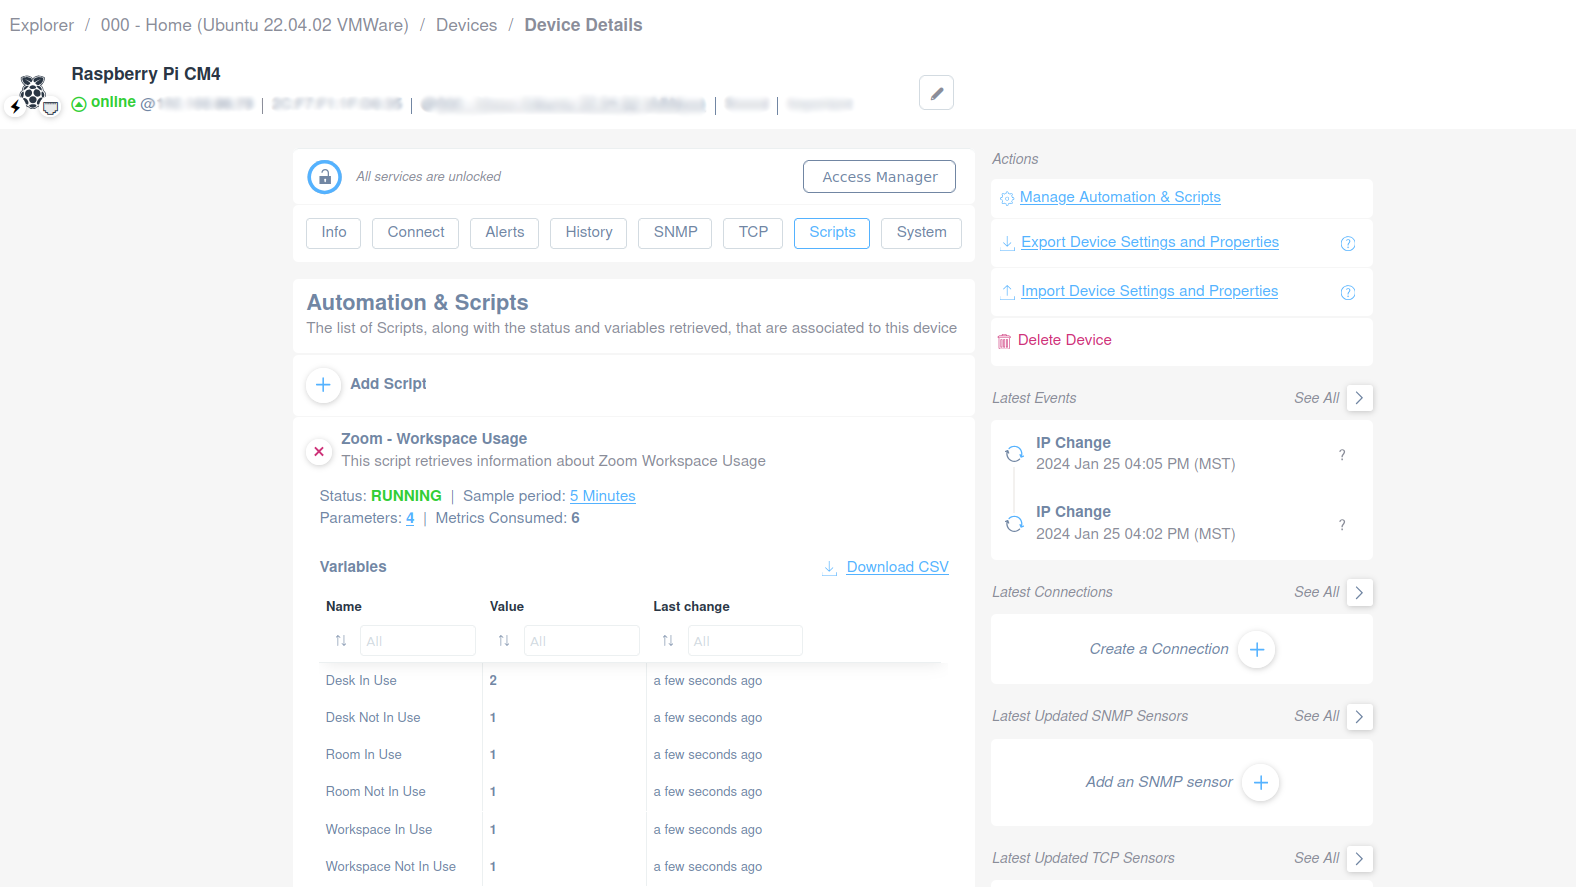
Device Script Management Interface
1. Viewing Device Information: The interface shows a Raspberry Pi CM4 device that is currently online. Key menu options include Info, Connect, Alerts, History, SNMP, TCP, Scripts, and System.
2. Accessing Scripts: Under "Automation & Scripts," the "Add Script" option allows for the creation of new scripts. An existing script named "Zoom - Workspace Usage" is shown with its status as RUNNING. It provides a sample period of 5 minutes, with 4 parameters and 6 metrics consumed.
3. Viewing Variables: The script displays variables such as "Desk In Use" and "Room In Use" with respective values and timestamps for the last changes.
4. Managing Actions: Options are available for managing automation and scripts, exporting and importing device settings, and deleting the device.
5. Observing Events: The "Latest Events" section logs IP changes with timestamps.
6. Viewing Connections and Sensors: Options are present to create a new connection, add an SNMP sensor, and view updated TCP sensors.
Zoom Rooms Live Meeting Latency and Jitter
The script allows you to easily manage and monitor Zoom – Rooms Live Meeting Latency and Jitter. You can extract the following details:
- ID
- Room Name
- Video Input Jitter Avg
- Video Input Latency Avg
- Video Output Jitter Avg
- Video Output Latency Avg
- Video Input Web Jitter Avg
- Video Input Web Latency Avg
- Video Output Web Jitter Avg
- Video Output Web Latency Avg
- AS General In Jitter Avg
- AS General In Latency Avg
- AS General Out Jitter Avg
- AS General Out Latency Avg
- AS RWG In Jitter Avg
- AS RWG In Latency Avg
- AS RWG Out Jitter Avg
- AS RWG Out Latency Avg
- Audio In Jitter Avg
- Audio In Latency Avg
- Audio Out Jitter Avg
- Audio Out Latency Avg
- Audio RWG In Jitter Avg
- Audio RWG In Latency Avg
- Audio RWG Out Jitter Avg
- Audio RWG Out Latency Avg
The script uses HTTPS protocol.
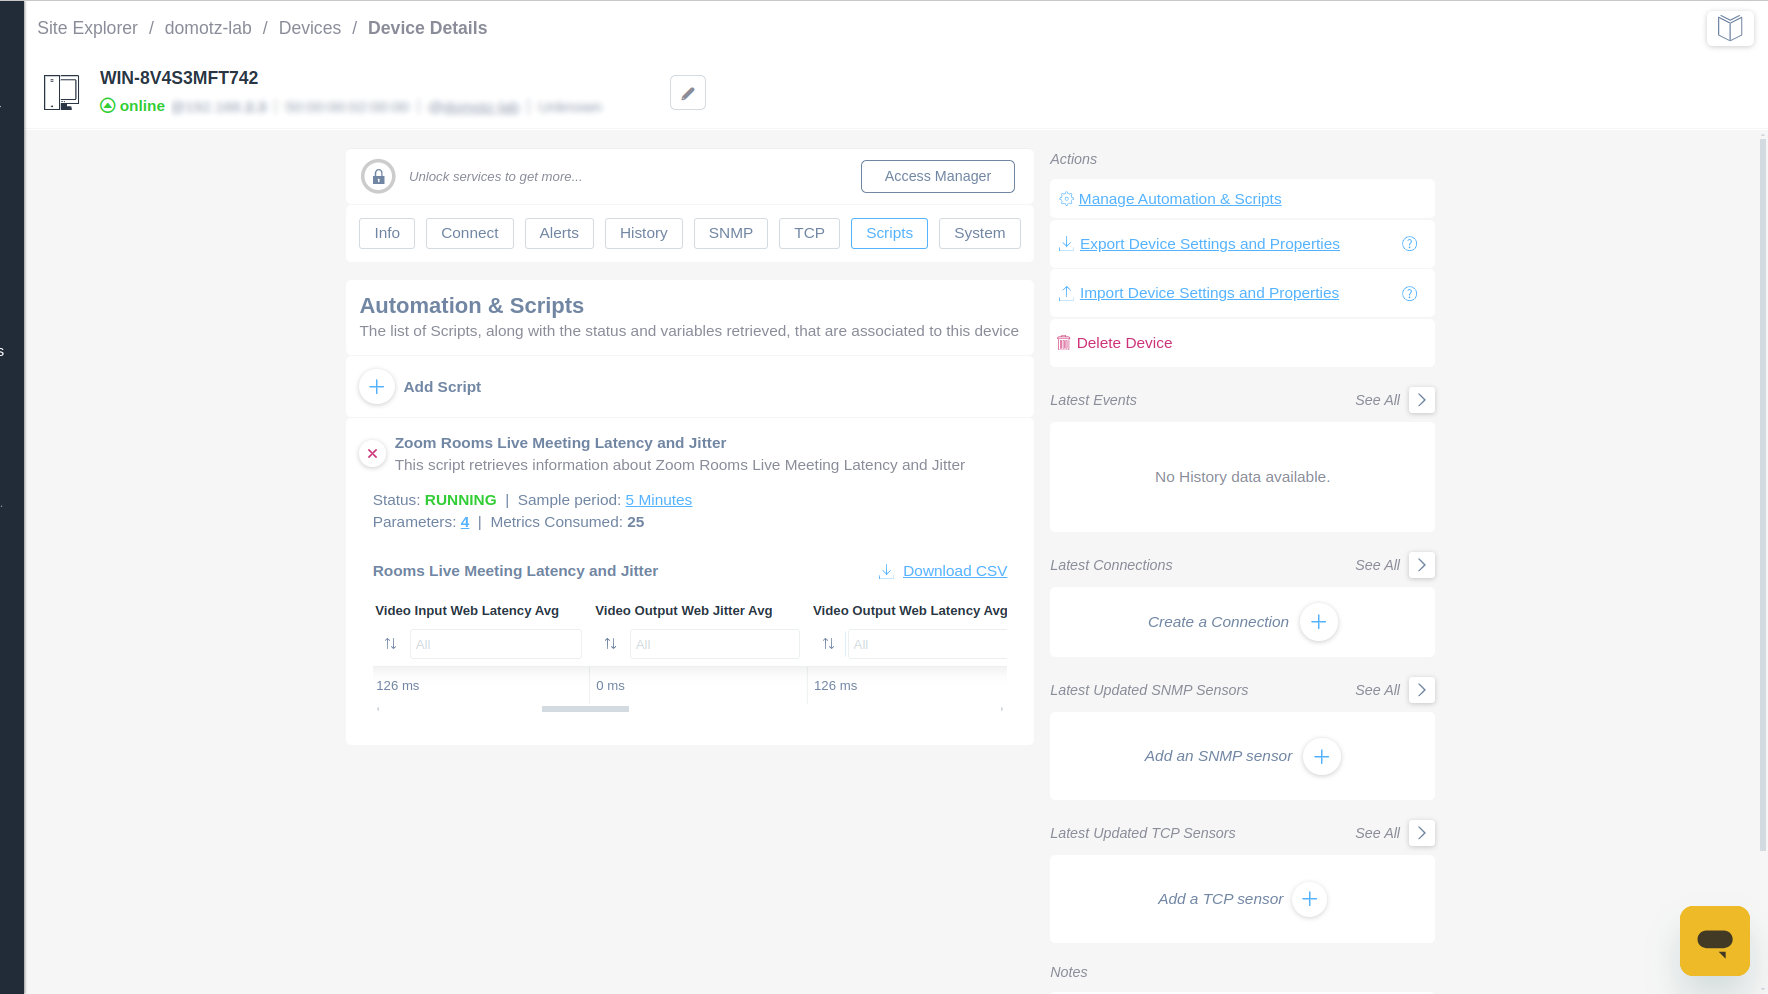
Device Details and Automation Script Management in Domotz
1. Device Information: Displays device ID "WIN-8V4S3MFT742" with a status indicating it's online.
2. Navigation Tabs: Includes options for Info, Connect, Alerts, History, SNMP, TCP, Scripts, and System. Select "Scripts" to manage scripts.
3. Automation & Scripts Section: Allows adding new scripts with the "Add Script" button.
4. Current Script: "Zoom Rooms Live Meeting Latency and Jitter" is displayed, showing it is running with a sample period of 5 minutes, 4 parameters, and 25 metrics consumed.
5. Data Metrics: For "Rooms Live Meeting Latency and Jitter," displays metrics such as Video Input Web Latency Avg, Video Output Web Jitter Avg, and Video Output Web Latency Avg with options to sort and filter the data.
6. Action Bar: Provides links to manage automation & scripts, export/import device settings, and delete the device.
7. Latest Events and Connections: Sections for viewing recent events and connections, currently showing "No History data available."
8. Additional Options: Allows adding SNMP and TCP sensors and note-taking with available buttons.
9. Download CSV: Option to download the script data as a CSV file.
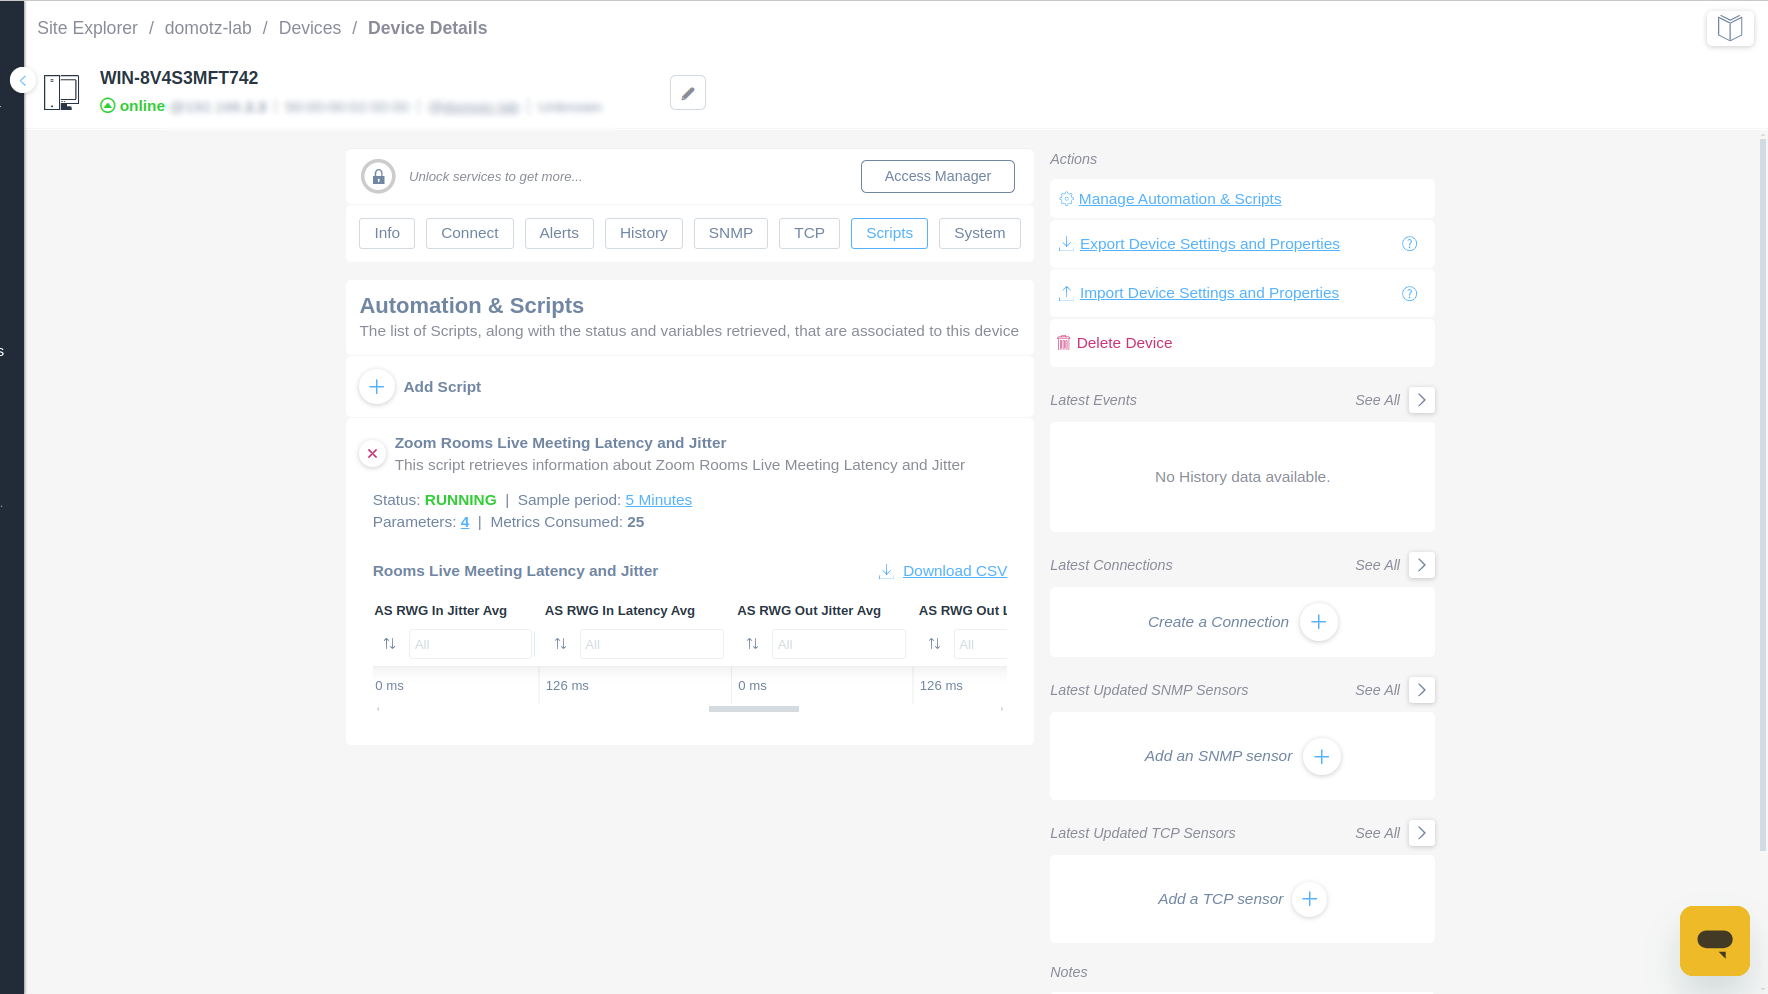
Device Details and Script Management Page
1. At the top, the device identifier "WIN-8V4S3MFT742" is shown with its status marked as "online."
2. Below, there are two sections. The left section contains navigation tabs including Info, Connect, Alerts, History, SNMP, TCP, Scripts, and System. The current tab open is "Scripts."
3. In the "Automation & Scripts" area, there is an option to "Add Script." Below it, a script titled "Zoom Rooms Live Meeting Latency and Jitter" is displayed. The script has a status of "RUNNING," a sample period of "5 Minutes," 4 parameters, and 25 metrics consumed.
4. Under the script, details on "Rooms Live Meeting Latency and Jitter" are present, with options to sort columns like "AS RWG In Jitter Avg" and "AS RWG In Latency Avg." Each column has a default sorting option, and values such as "0 ms" and "126 ms" are visible. You can download this data in CSV format.
5. The right section contains actionable links for "Manage Automation & Scripts," "Export Device Settings and Properties," "Import Device Settings and Properties," and "Delete Device."
6. Additionally, sections for "Latest Events," "Latest Connections," "Latest Updated SNMP Sensors," and "Latest Updated TCP Sensors" are present with options to view all, create connections, and add sensors.
Use this interface to manage and monitor scripts and device settings, as well as perform actions related to automation and data export/import.
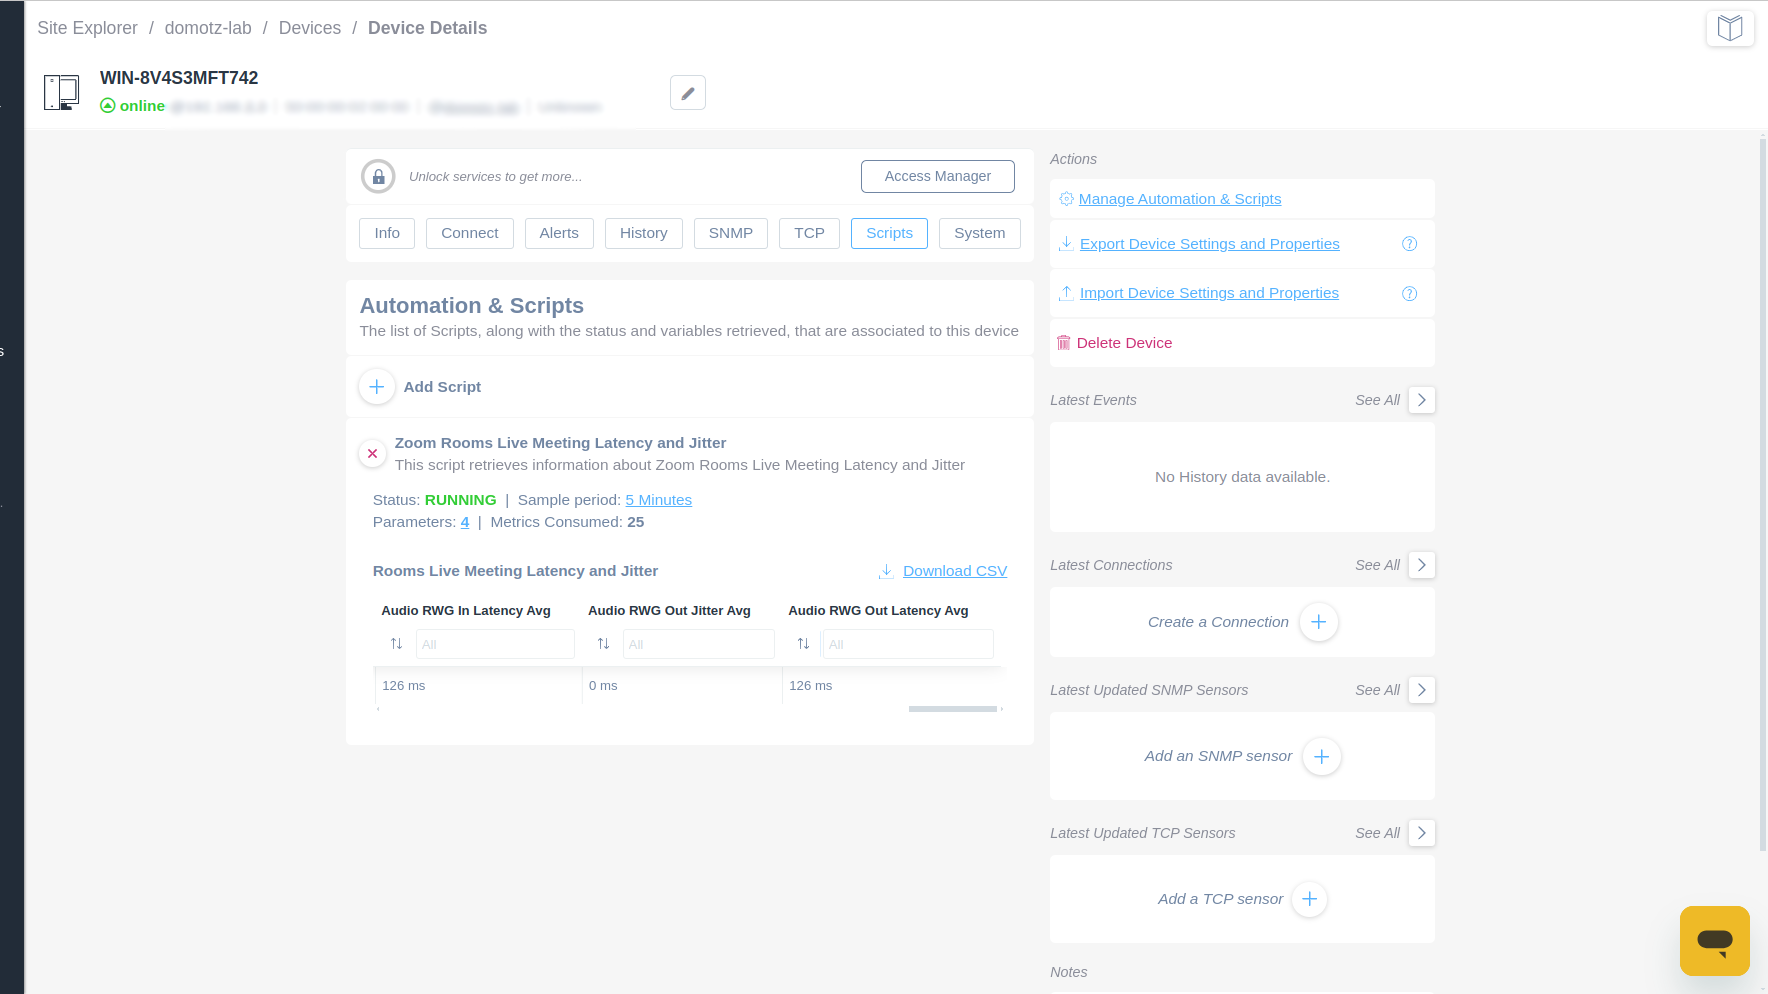
Device Details and Automation Scripts Interface
1. At the top left, the device name "WIN-8V4S3MFT742" and its online status are displayed.
2. Central to the interface, the "Automation & Scripts" section allows management of scripts associated with the device.
3. To add a new script, use the "Add Script" button.
4. An existing script titled "Zoom Rooms Live Meeting Latency and Jitter" is shown, with details like its status (RUNNING), sample period (5 Minutes), number of parameters (4), and metrics consumed (25).
5. Below the script title, latency metrics are presented: Audio RWG In Latency Avg (126 ms), Audio RWG Out Jitter Avg (0 ms), and Audio RWG Out Latency Avg (126 ms). These can be downloaded as a CSV.
6. The right sidebar lists actions including "Manage Automation & Scripts," options to export or import device settings, and the ability to "Delete Device."
7. Additional sections include "Latest Events," "Latest Connections," with options to create connections or add sensors like SNMP and TCP.
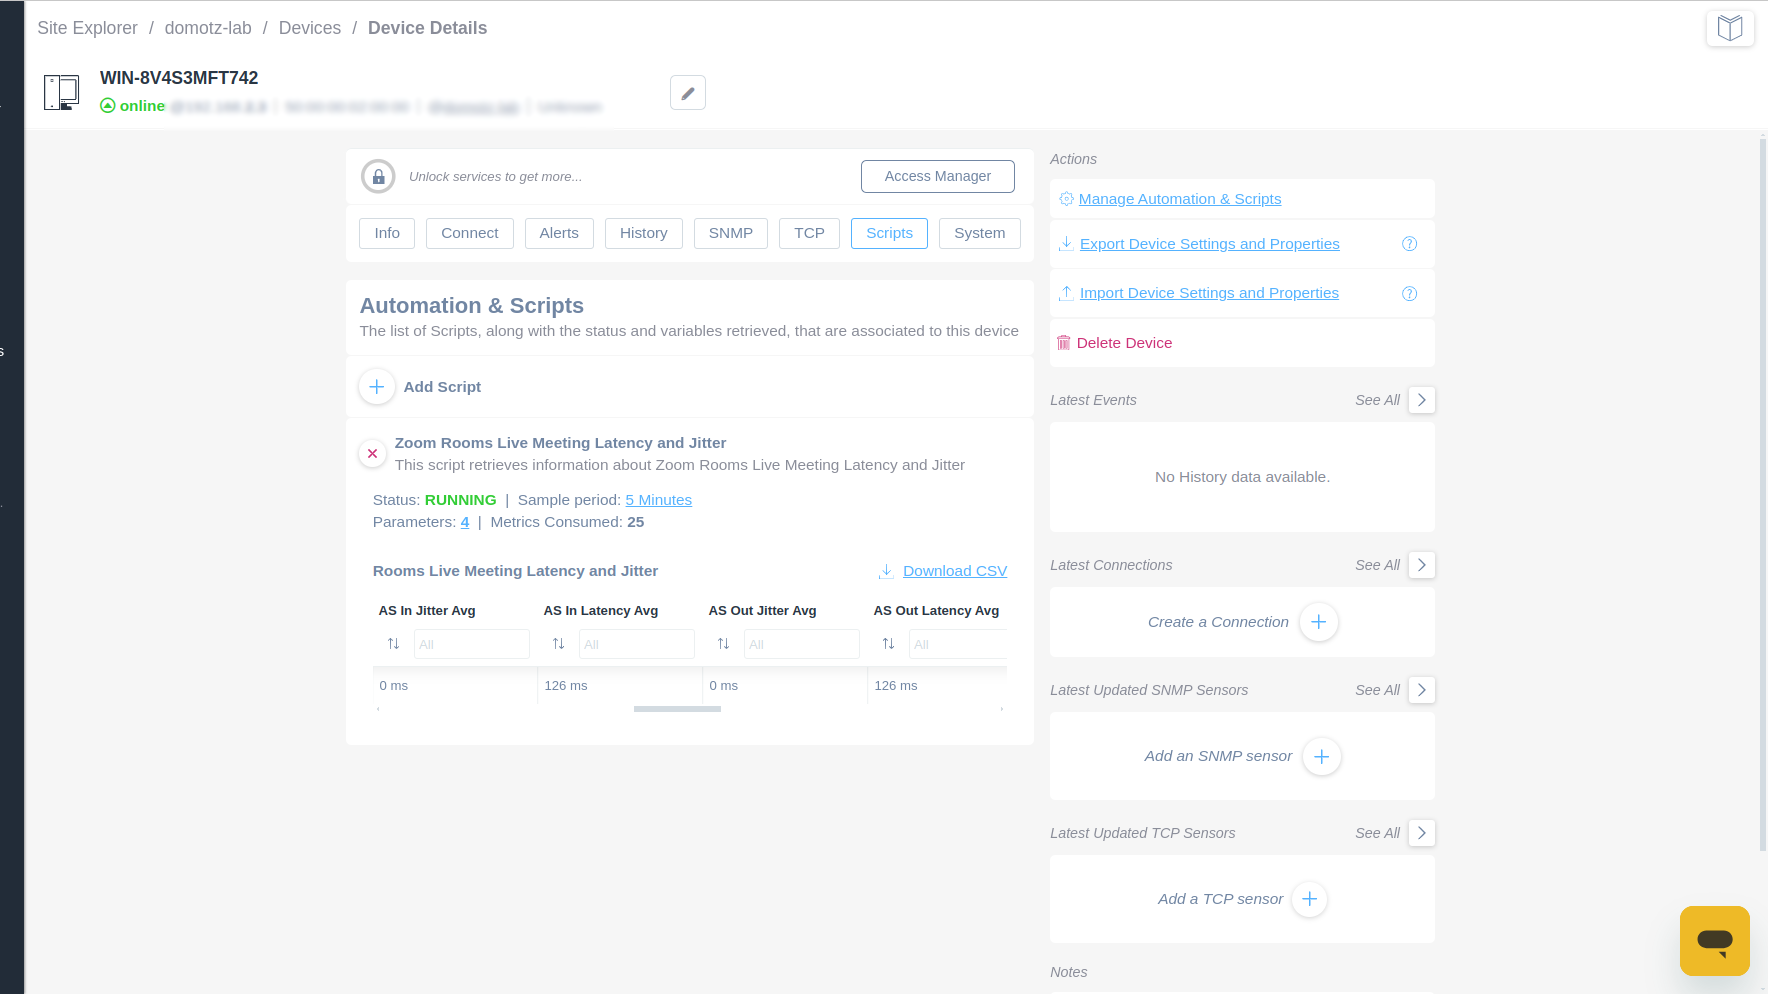
Device Details and Script Management Interface
1. The device name and status are displayed at the top, showing "WIN-8V4S3MFT742" as online.
2. Below, the Automation & Scripts section allows you to manage device scripts. Click "Add Script" to create a new script.
3. The "Zoom Rooms Live Meeting Latency and Jitter" script details show its status as running, with a sample period of 5 minutes. Parameters and metrics consumed are indicated as 4 and 25 respectively.
4. The script's latency and jitter data is displayed in three columns: AS In Jitter Avg, AS In Latency Avg, and AS Out Latency Avg, with corresponding values in milliseconds.
5. On the right, key actions are available, including "Manage Automation & Scripts," "Export Device Settings and Properties," "Import Device Settings and Properties," and "Delete Device."
6. The latest events and connections are noted but indicate no available history. Options to create a new connection or add SNMP and TCP sensors are present.
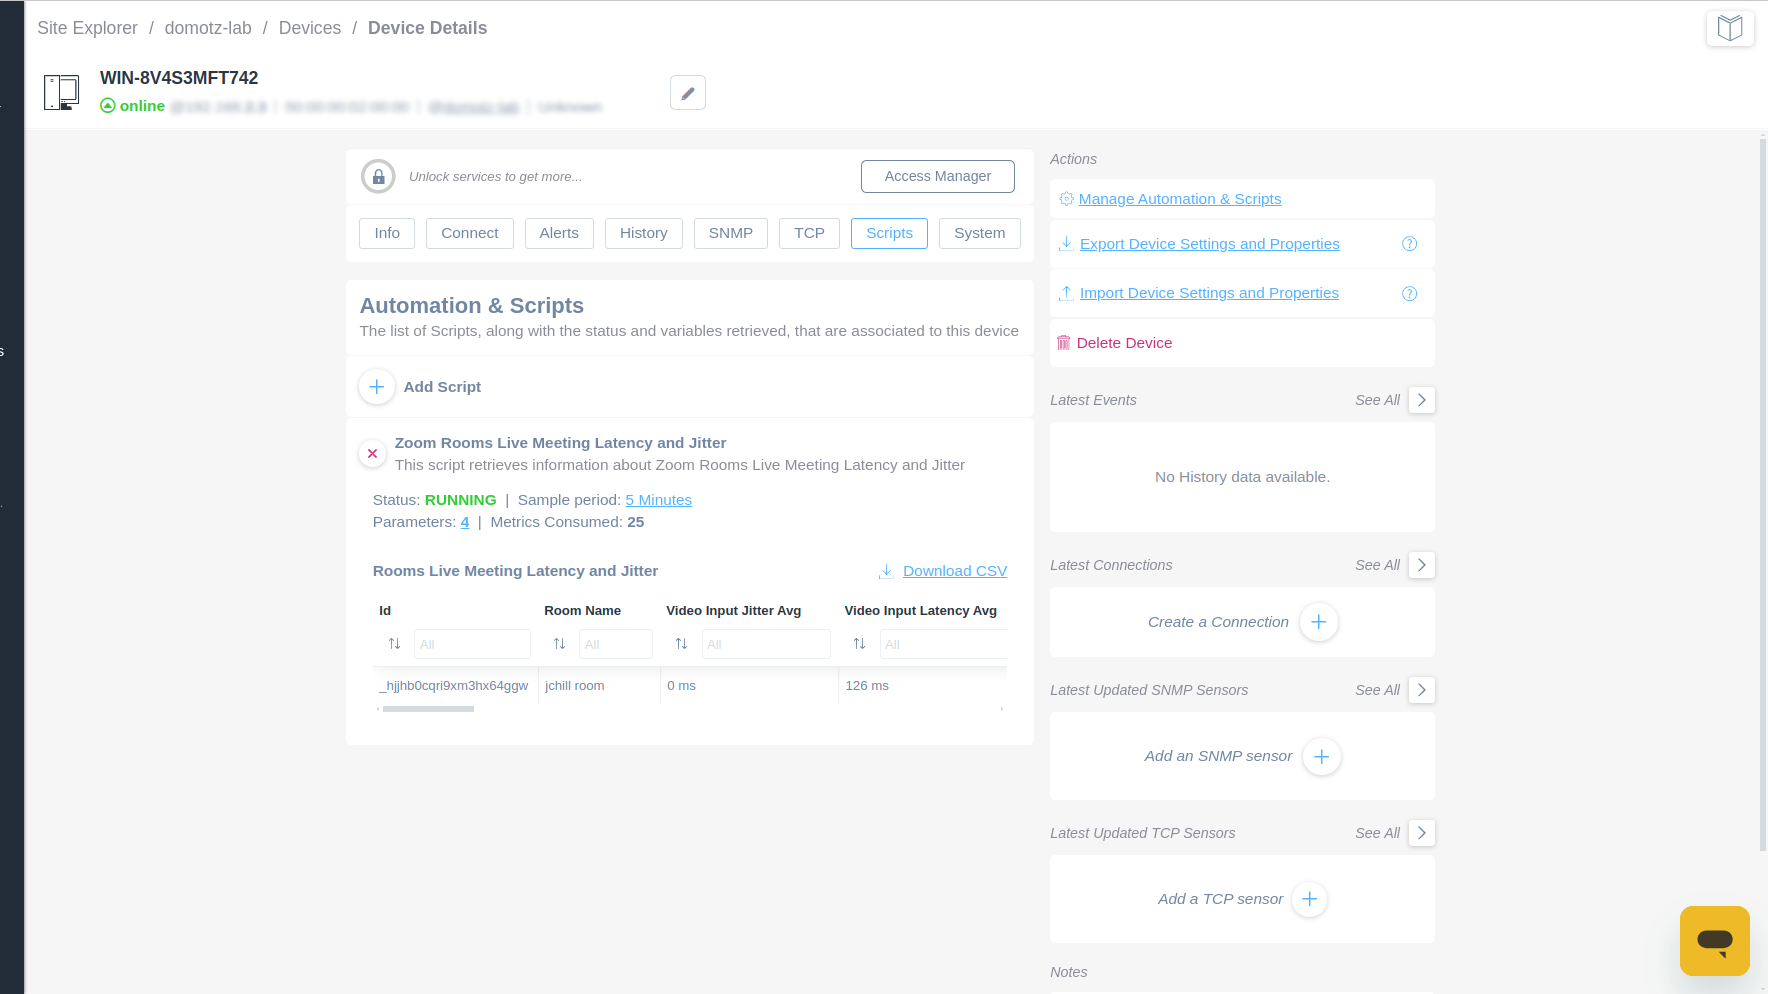
Device Details for Managing Scripts
1. The top-left section displays the device name "WIN-8V4S3MFT742" with its status as "online".
2. Below, the "Automation & Scripts" section lists scripts for the device. Click "Add Script" to include a new script.
3. The "Zoom Rooms Live Meeting Latency and Jitter" script provides performance details. Its current status is "RUNNING" with a sample period of 5 minutes, using 4 parameters and consuming 25 metrics.
4. Below the script details, a table shows specific latency and jitter statistics. Columns include Room Name, Video Input Jitter Avg, and Video Input Latency Avg. An example record shows the room name "jchill room" with 0 ms jitter and 126 ms latency.
5. On the right, actions include "Manage Automation & Scripts", "Export Device Settings and Properties", "Import Device Settings and Properties", and "Delete Device" for device management tasks.
6. Below actions, create new connections or add sensors by selecting "Create a Connection", "Add an SNMP sensor", or "Add a TCP sensor".
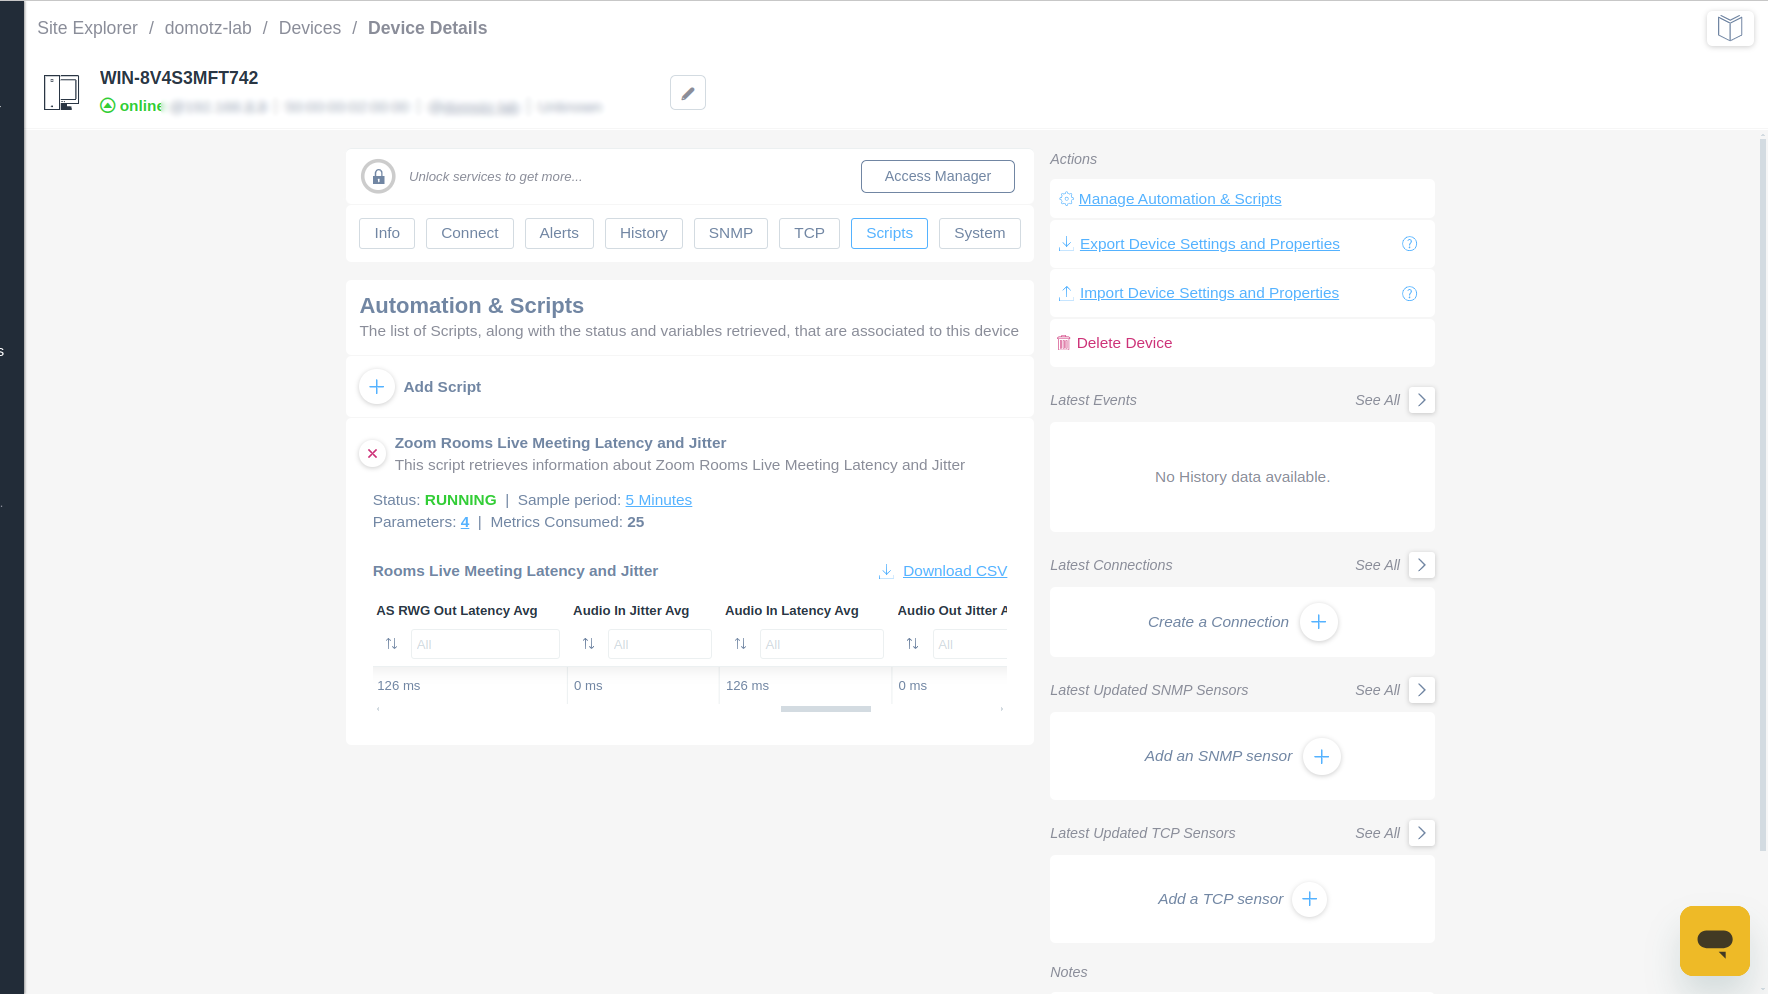
Device Details and Script Management Interface
1. The top section shows the device identifier "WIN-8V4S3MFT742" marked as "online." There are tabs for different device settings: Info, Connect, Alerts, History, SNMP, TCP, Scripts, and System.
2. The main panel under "Automation & Scripts" allows you to add a script by selecting "Add Script."
3. Details for a script named "Zoom Rooms Live Meeting Latency and Jitter" are provided. It shows the script's status as "RUNNING," a sample period of "5 Minutes," along with "4 Parameters," and "25 Metrics Consumed."
4. A data table displays metrics related to latency and jitter with values available for download as a CSV file.
5. The right sidebar contains actions such as managing automation and scripts, exporting and importing device settings, and deleting the device. It also lists sections for latest events, connections, SNMP sensors, and TCP sensors, all providing options to add or create new entries.
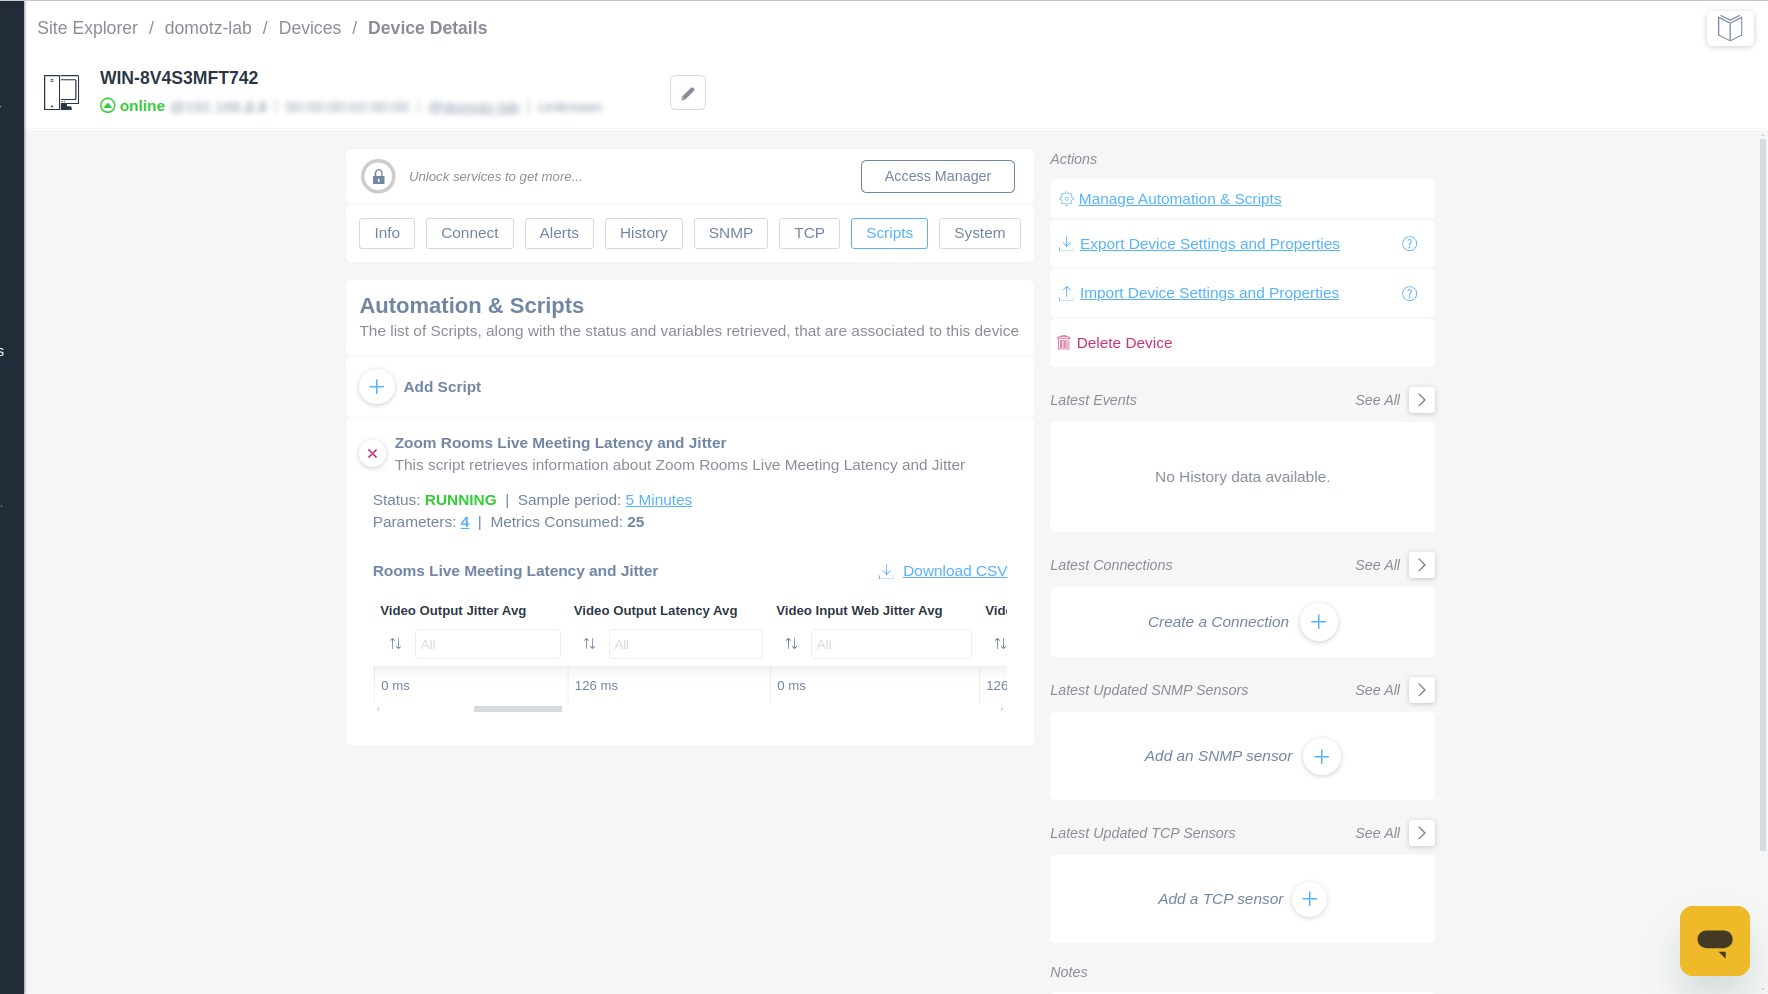
Device Details and Automation Scripts Interface
1. At the top, the device is labeled "WIN-8V4S3MFT742" with a status of "online."
2. Below the device name, tabs include Info, Connect, Alerts, History, SNMP, TCP, Scripts, and System.
3. The "Automation & Scripts" section lists available scripts. Click “Add Script” to include a new script.
4. The script "Zoom Rooms Live Meeting Latency and Jitter" is displayed. It is currently "RUNNING" with a sample period of 5 minutes. It uses 4 parameters and consumes 25 metrics.
5. Details of the script include metrics for Video Output Jitter Avg, Video Output Latency Avg, Video Input Web Jitter Avg, and Video Input Web Latency Avg, with corresponding measurements.
6. Options to download CSV reports are available for detailed analytics.
7. The right side provides additional actions: manage automation and scripts, export and import device settings, and delete the device.
8. Sections displayed include Latest Events, Latest Connections, Latest Updated SNMP Sensors, and Latest Updated TCP Sensors, each with relevant options to create connections or add sensors.
Enhancements
Unified Devices List with New Filters
This enhancement gives you better visibility and control over client networks. You can quickly identify devices that need attention, streamline management, and make updates on the fly—all from one intuitive interface.
Here’s what’s new:
- Single View for All Devices: Easily see both Managed and Unmanaged devices in one place, reducing the need to switch between views.
- Quickly Set Managed Devices: Convert Unmanaged devices to Managed directly from the Devices List for faster setup and tracking.
- Quick Filters: Find exactly what you need with new filters for Online, Offline, Important, and Important Offline devices.
- Advanced Filtering: Take it a step further with additional filtering options for more granular control.
It’s a big win for efficiency and accuracy.
Network Collector Updates
We recently rollout different platform updates and related improvements:
Linux snap and Windows platform (Ubuntu Core Public)
Version 6.5.0-b001
- Update M-Lab SpeedTest to use ndt7
- Improve scan performances on networks with subnet masks bigger than /22
- Speed up device type identification upon Collector activation when SNMP is available
Domotz Box, Netgear, QNAP, Docker, Raspberry, and Synology platforms
Version 6.4.1-b001
- Network scan performance optimizations in case of many External Hosts or many VLANs configured
- Fetch basic network information (WAN/LAN) as soon as the Collector starts for the first time
- Fix issues on false positive devices HB lost for devices monitored via IP Address Ranges
- Fix the issue causing all devices to change status at the same time in particular conditions
- Fix issue on unexpected UDP port usage
- Fix routing issue for VLANs when using VPN on demand
- Fix the issue preventing the display of SNMP Pre-Configured Sensors data when applied on many devices
New MIB
- Avaya IP Oce
Fixes
- Fix timeout issue on Aruba PoE ports control
- Fix the issue on ConnectWise PSA integration using a malformed URL for the Previous ticket value
- Fix the issue on ConnectWise PSA integration not displaying the entire list of Collectors when mapping them to customers (affecting only accounts with hundreds of Collectors)
- Fix issue on Freshdesk integration preventing ticket creation/update
- Fix the issue on IT Glue integration using the wrong device order when sorting by IP Address
- Fix issue on Public API for listDevices endpoint not properly returning Serial Number on devices when it’s manually set
- Fix the issue on the Monitoring Configuration view not displaying the full list of devices in some edge cases