
Domotz implements advanced support and integration for all the most popular Managed Network Switches. In particular:
- Automated switch port mapping is available for all the managed network switches compliant with the RFC4188 standard.
- PoE management is supported for all Managed Network switches compliant with the RFC3621.
- Port Mapping and PoE management are also implemented for several devices that are not compliant with the standards above, they are listed here: Officially Supported PoE Equipment.
- Configuration management is supported for a selected number of models. Please refer to Network Configuration Management for more details about this feature.
When one of these devices is discovered and recognized, a new tab Interfaces is automatically created in the Device Details screen tab, with an entry for each port of the device, like in the example below:
Switch Status and Interfaces Overview 1. The switch is labeled as "Switch #1" and is currently online, with the IP address 192.168.43.5 and MAC address A4:13:4E:72:98:BC. 2. Navigation tabs are available for different sections: Info, Connect, Alerts, History, Eyes, and Interfaces. The Interfaces tab is selected. 3. Power consumption is displayed as 26W (10.4%) of the total power budget of 250 Watt. 4. A list of ports is shown. For each port: 5. The PoE status is indicated for each port with an icon.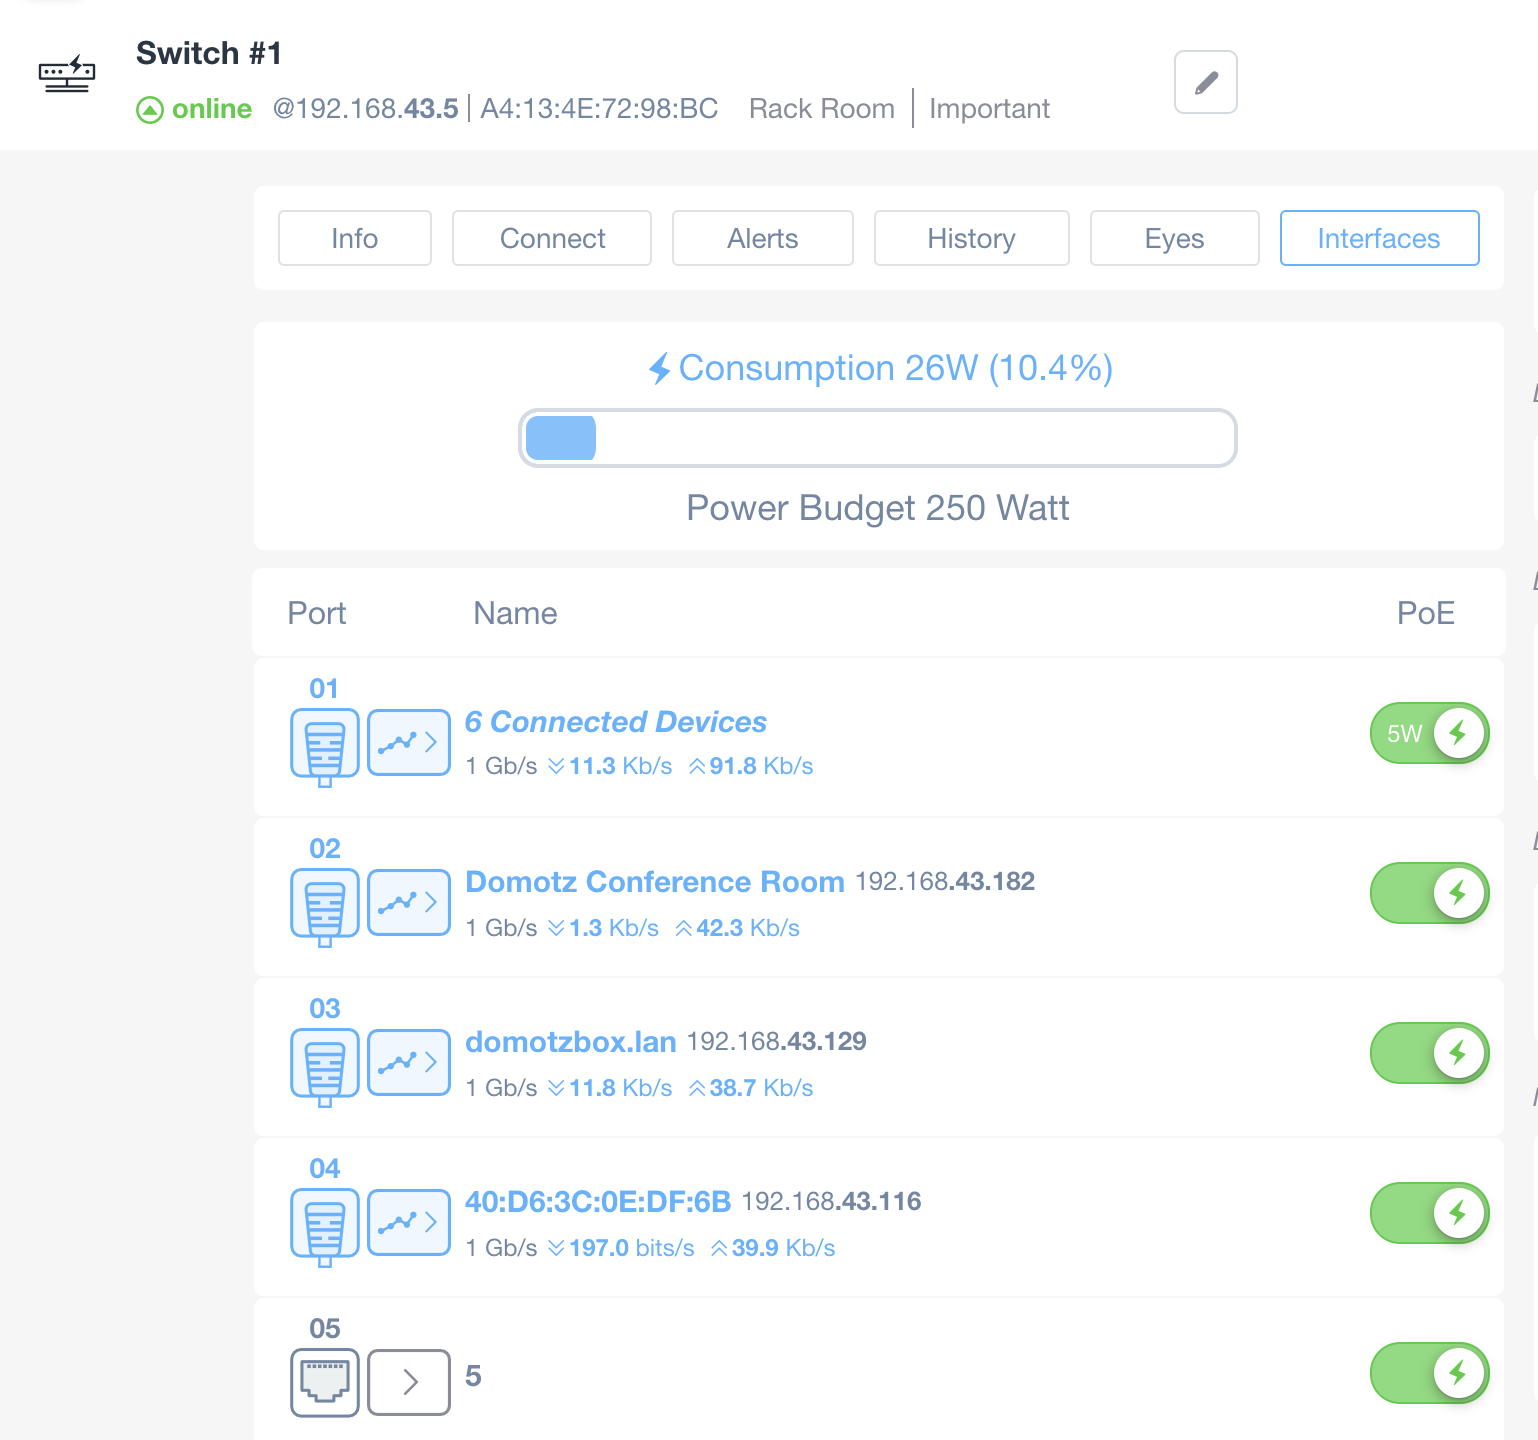
- Port 01 is connected to 6 devices with data rates of 1 Gb/s, 11.3 Kb/s download, and 91.8 Kb/s upload. It provides 5W Power over Ethernet (PoE).
- Port 02 is labeled "Domotz Conference Room" with IP 192.168.43.182, 1 Gb/s speed, 1.3 Kb/s download, and 42.3 Kb/s upload.
- Port 03 shows "domotzbox.lan" with IP 192.168.43.129, 1 Gb/s speed, 11.8 Kb/s download, and 38.7 Kb/s upload.
- Port 04 has the identifier "40:D6:3C:0E:DF:6B" with IP 192.168.43.116, 197.0 bits/s speed, 39.9 Kb/s download.
- Port 05 has 5 connected devices, with no additional details shown.
Traffic information is collected and stored so that the user can see the historical data and monitor the interfaces.
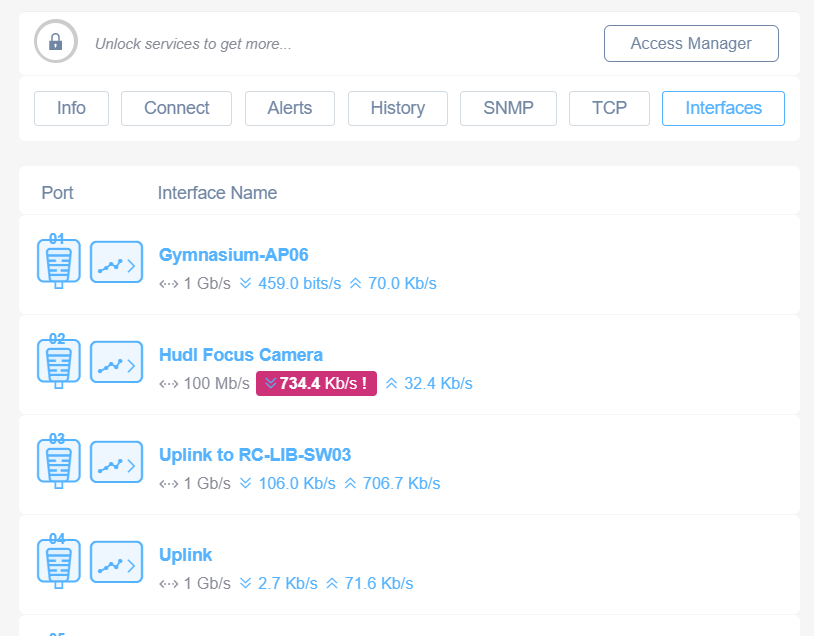
The red background on a port’s upload or download speeds indicates that there have been packet errors detected on that port:
Network Interface Overview
1. Navigate to the "Interfaces" tab in the software interface.
2. The interface displays a list of ports with their respective interface names.
3. For each interface, check the current speed and data transfer rates in both directions. For example, "Gymnasium-AP06" shows 1 Gb/s, with 459.0 bits/s incoming and 70.0 Kb/s outgoing.
4. Note any alerts; for instance, the "Hudl Focus Camera" shows a warning with a data transfer rate of 734.4 Kb/s incoming.
5. Review each entry for performance insights, such as "Uplink to RC-LIB-SW03" and "Uplink," showing different data rates and speeds.
Automatic Port Mapping
For many managed switches, Domotz is able to automatically detect and associate the devices with the port to which they’re connected.
Individual information for each port of the switch is displayed such as max throughput, current upload, and download rate.
Power over Ethernet (PoE)
If a Managed Network Switch has PoE capabilities, additional data will be displayed under the Interfaces tab:
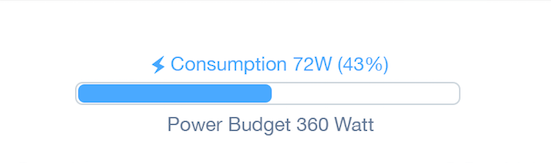
PoE Power Consumption and Budget information – this is a graphical representation of the power consumption in watts and percentages (out of the total budget) of the aggregated data from the PoE ports
Power Consumption Display
1. Shows current power consumption as 72 watts, which is 43% of the available power.
2. Displays a progress bar indicating the percentage of power being used.
3. Indicates the total power budget available is 360 watts.
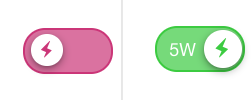
PoE Port Toggle Button – for PoE ports there is also the option to toggle their state on/off as shown in the image below. Power consumption (in watts) is also displayed (if applicable) for the individual port.
Toggle Switches for Device Modes
1. The left toggle switch, with a pink background, is turned off. This indicates the device is not active.
2. The right toggle switch, with a green background, is turned on and displays "5W," representing the device is operating at 5 watts.
PoE management and Automatic Port Mapping requires SNMP enabled with the community settings configured correctly in the Device Details
Diagnostic and Port Details
There is additional information for every single switch interface port that can be accessed by selecting the port name or icons on the left of the SNMP information list.
The port details window includes a visual representation of the individual port statistics with the following information:
- Bandwidth usage: inbound and outbound directions
- Errors: inbound and outbound
- Discarded packets: inbound and outbound
- Port maximum throughput
- Port upload and download bandwidth consumption
- PoE power consumption (if any)
You can choоse among three different time frames (1 day, 7 days, 1 month – that is the default value).
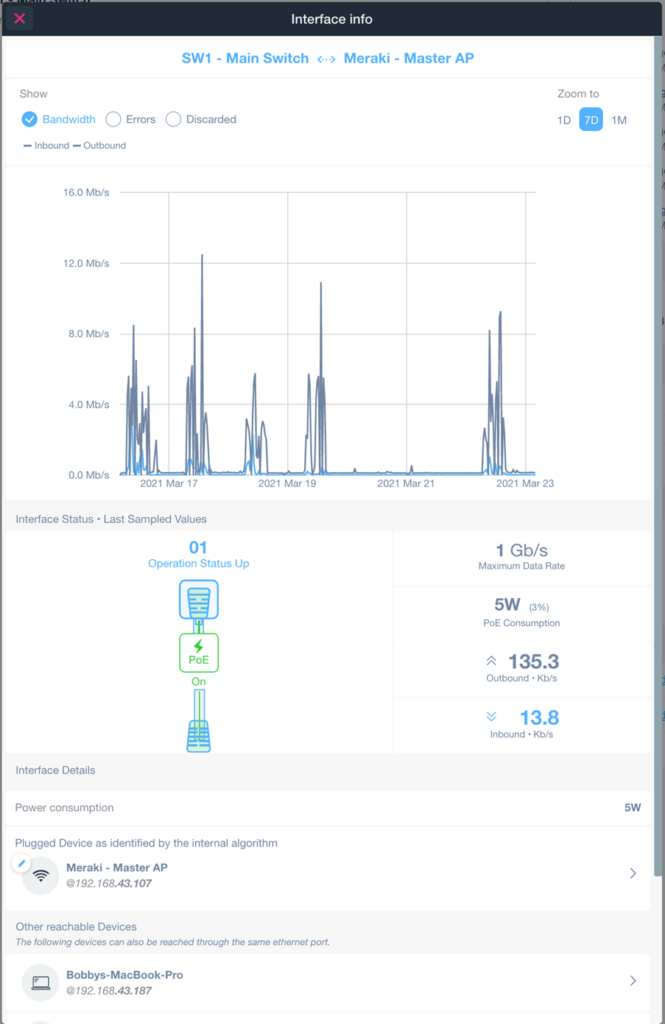
Interface Information Overview for Network Monitoring
1. The title "Interface Info" shows details between "SW1 - Main Switch" and "Meraki - Master AP."
2. The graph displays network bandwidth usage over seven days, depicting inbound and outbound data rates in Mbps.
3. Interface Status indicates "Operation Status Up" with a PoE (Power over Ethernet) noted as "On."
4. Key metrics include a maximum data rate of 1 Gb/s, PoE consumption at 5W, outbound traffic at 135.3 Kb/s, and inbound traffic at 13.8 Kb/s.
5. "Plugged Device" is identified as "Meraki - Master AP" with the IP address 192.168.43.107.
6. An additional reachable device is "Bobbys-MacBook-Pro" with the IP address 192.168.43.187.
7. Power consumption is noted as 5W under "Interface Details."
The аdditional information provided in this visualization is as follows:
- Last Seen Status: shown only if the device is down. It would also indicate the time that has passed since the mapped device was last online
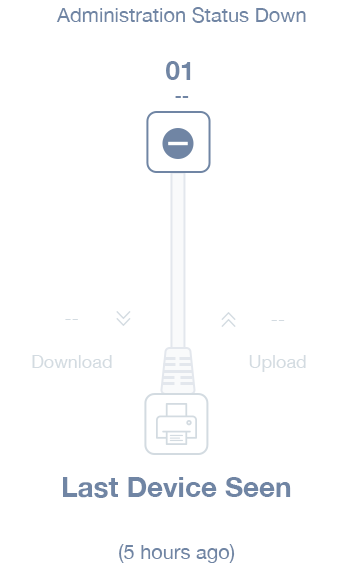
Network Port Status and Last Device Connection
1. The administration status indicates "Down," showing that the network port is currently not active.
2. Port number "01" is displayed alongside a down-status icon, indicating that it is disabled or not in use.
3. Below the port number, "Download" and "Upload" indicators show no activity.
4. The section "Last Device Seen" identifies the last device connected to this port, with the connection timestamp showing it was last active "5 hours ago."
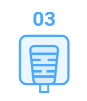
- Port Statuses:

An Ethernet port with the number 04 above it.
Microphone icon representing step 3.
Icon for Decrease Quantity.
This icon is used to reduce a numerical value or quantity in a software interface. The minus symbol inside a circle indicates the decrease function. Use this to decrement numbers, such as in a shopping cart or data input field.
On both tabs mapped device(s) are listed – device(s) have been automatically mapped to this port and have the following information:
- Associated Name of the device (as shown in the Devices List)
- IP Address of the device

Camera Information and IP Address Display
1. The title "CAM FRONT GARDEN" indicates the name or location of the camera being viewed.
2. The sequence "192.168.100.84" represents the camera's IP address, allowing network identification and access.