
Domotz allows you to monitor TCP Services available on your connected devices.
How to monitor TCP Services
In order to monitor TCP services exposed by a device, go to the TCP tab within the Device screen:
Setting Up TCP Monitoring on a Network Device. 1. Confirm the device labeled "PROCURE J9029A" is online at IP address 192.168.5.250 and note the MAC address 00:1D:B3:C8:FE:10.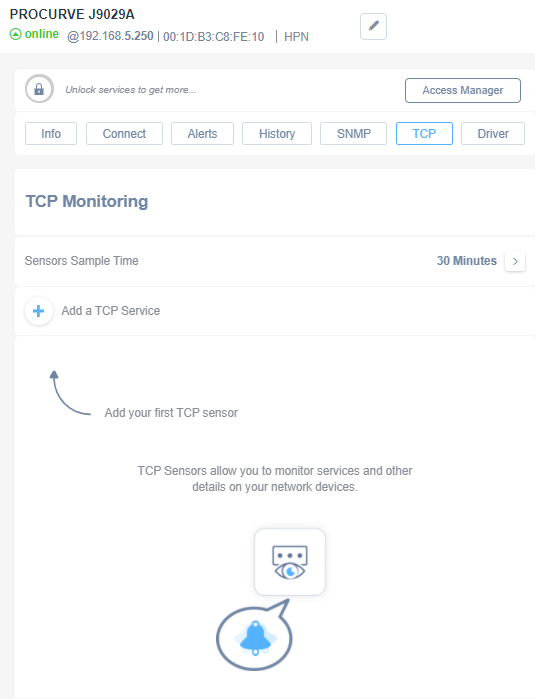
2. In the menu bar, select the "TCP" tab to access TCP monitoring settings.
3. In the "TCP Monitoring" section, review settings such as "Sensors Sample Time," currently set to 30 minutes. Adjust as needed using the arrow.
4. To add a TCP service, click on "Add a TCP Service."
5. Begin by adding your first TCP sensor to monitor services and network details.
You can add a service to be monitored by clicking on “Add a TCP Service” and entering the name of the service or TCP port number associated.
Adding a Service with Search Functionality 1. Enter "80" in the search bar to filter services.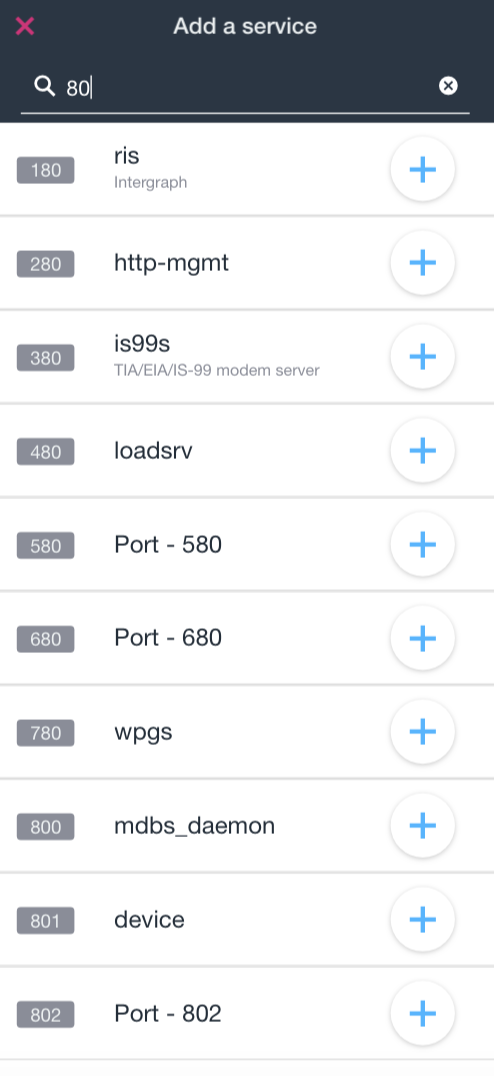
2. Review the list of available services. Each service displays a number, name, and description.
3. To add a service, select the plus button next to the desired service entry.
4. Services available include "ris" with number 180, "http-mgmt" with number 280, and others such as "Port - 580" and "Port - 680".
5. Continue to scroll through the list to view all matching services.
Once the TCP service is added, the Domotz Agent will start monitoring that service. The port will be marked as available (green) if the Service is available on that port or unavailable (red) if not:
TCP Monitoring Configuration Panel 1. The page displays the status of a device labeled "PROCURVE J9029A," which is currently online, with its IP address and hardware details listed.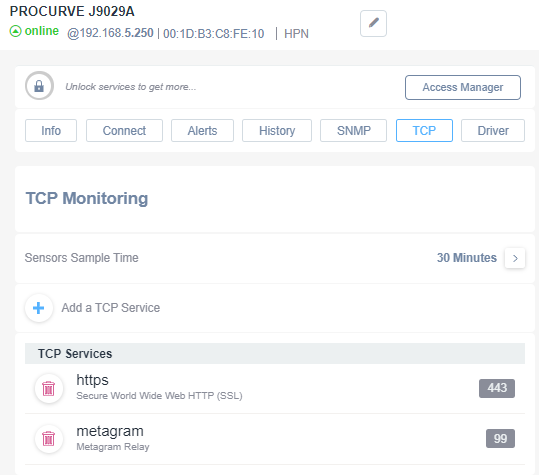
2. A navigation menu shows various options: Info, Connect, Alerts, History, SNMP, TCP, and Driver. The TCP section is currently selected.
3. Under the "TCP Monitoring" header, the "Sensors Sample Time" is set to 30 minutes.
4. A button labeled "Add a TCP Service" is available for adding new services to monitor.
5. Listed TCP services include:
- "https" with a description of "Secure World Wide Web HTTP (SSL)" and a port value of 443.
- "metagram" described as "Metagram Relay" with a port value of 99.
6. Each service has an option to delete it, indicated by a trash bin icon.
On every single TCP service monitored, the user can set a “Custom” alert (from the Alerts tab) to be informed when the service change status (from available to unavailable and vice-versa):
Customizing Alerts for a Device 1. At the top, the device identifier and status are displayed, indicating an online status with specific network details.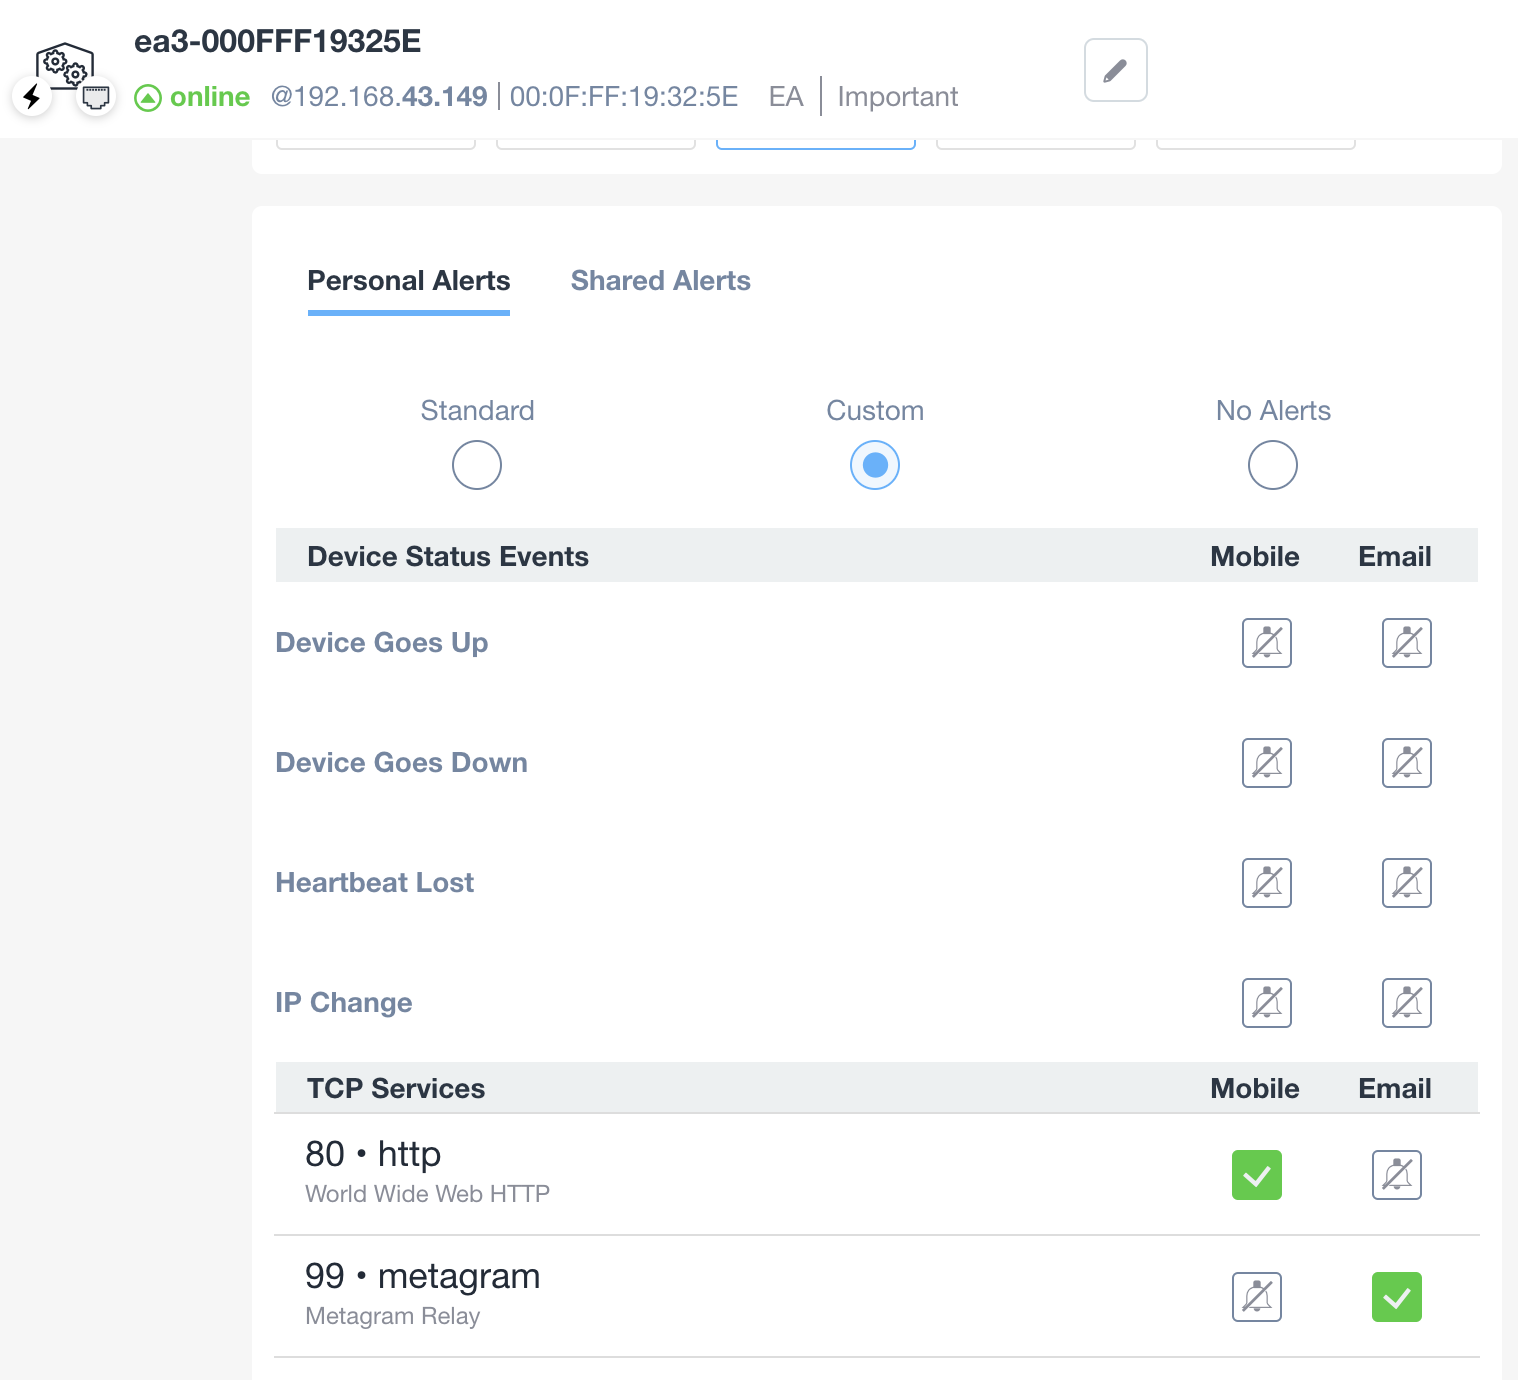
2. Below are two tabs: "Personal Alerts" is selected, with "Shared Alerts" as the alternative option.
3. In "Personal Alerts," three alert options are available: "Standard," "Custom," and "No Alerts." The "Custom" option is selected.
4. Under "Device Status Events," several conditions are listed: "Device Goes Up," "Device Goes Down," "Heartbeat Lost," and "IP Change," all with associated notification settings for Mobile and Email, currently inactive.
5. In the "TCP Services" section, two services are shown: "80 - http" and "99 - metagram." Notifications for "Mobile" and "Email" are active for "80 - http" and for Email only for "99 - metagram."
Learn about SNMP and TCP usage and sampling configuration.