
We have exciting new features, custom scripts, pre-configured SNMP templates, and improvements available on Domotz. This month’s exciting new updates include the Network Troubleshooting table and alerting, Serial Number availability, SonicWall custom script, new SNMP templates, and more.
Here’s what’s new and improved on Domotz this month.
We constantly improve Domotz and welcome your feedback. Don’t hesitate to get in touch with our support team at support@domotz.com for help or suggestions.
New features
Network Troubleshooting Table
In our continuous effort to enhance network monitoring and management, we are introducing the “Network Troubleshooting Table and Alerting” feature.
The Network Troubleshooting Table aggregates data across multiple sites, offering a bird’s-eye view of the network’s health. This centralizes the monitoring process, giving you the power to quickly assess and compare the performance of different network segments at a glance.
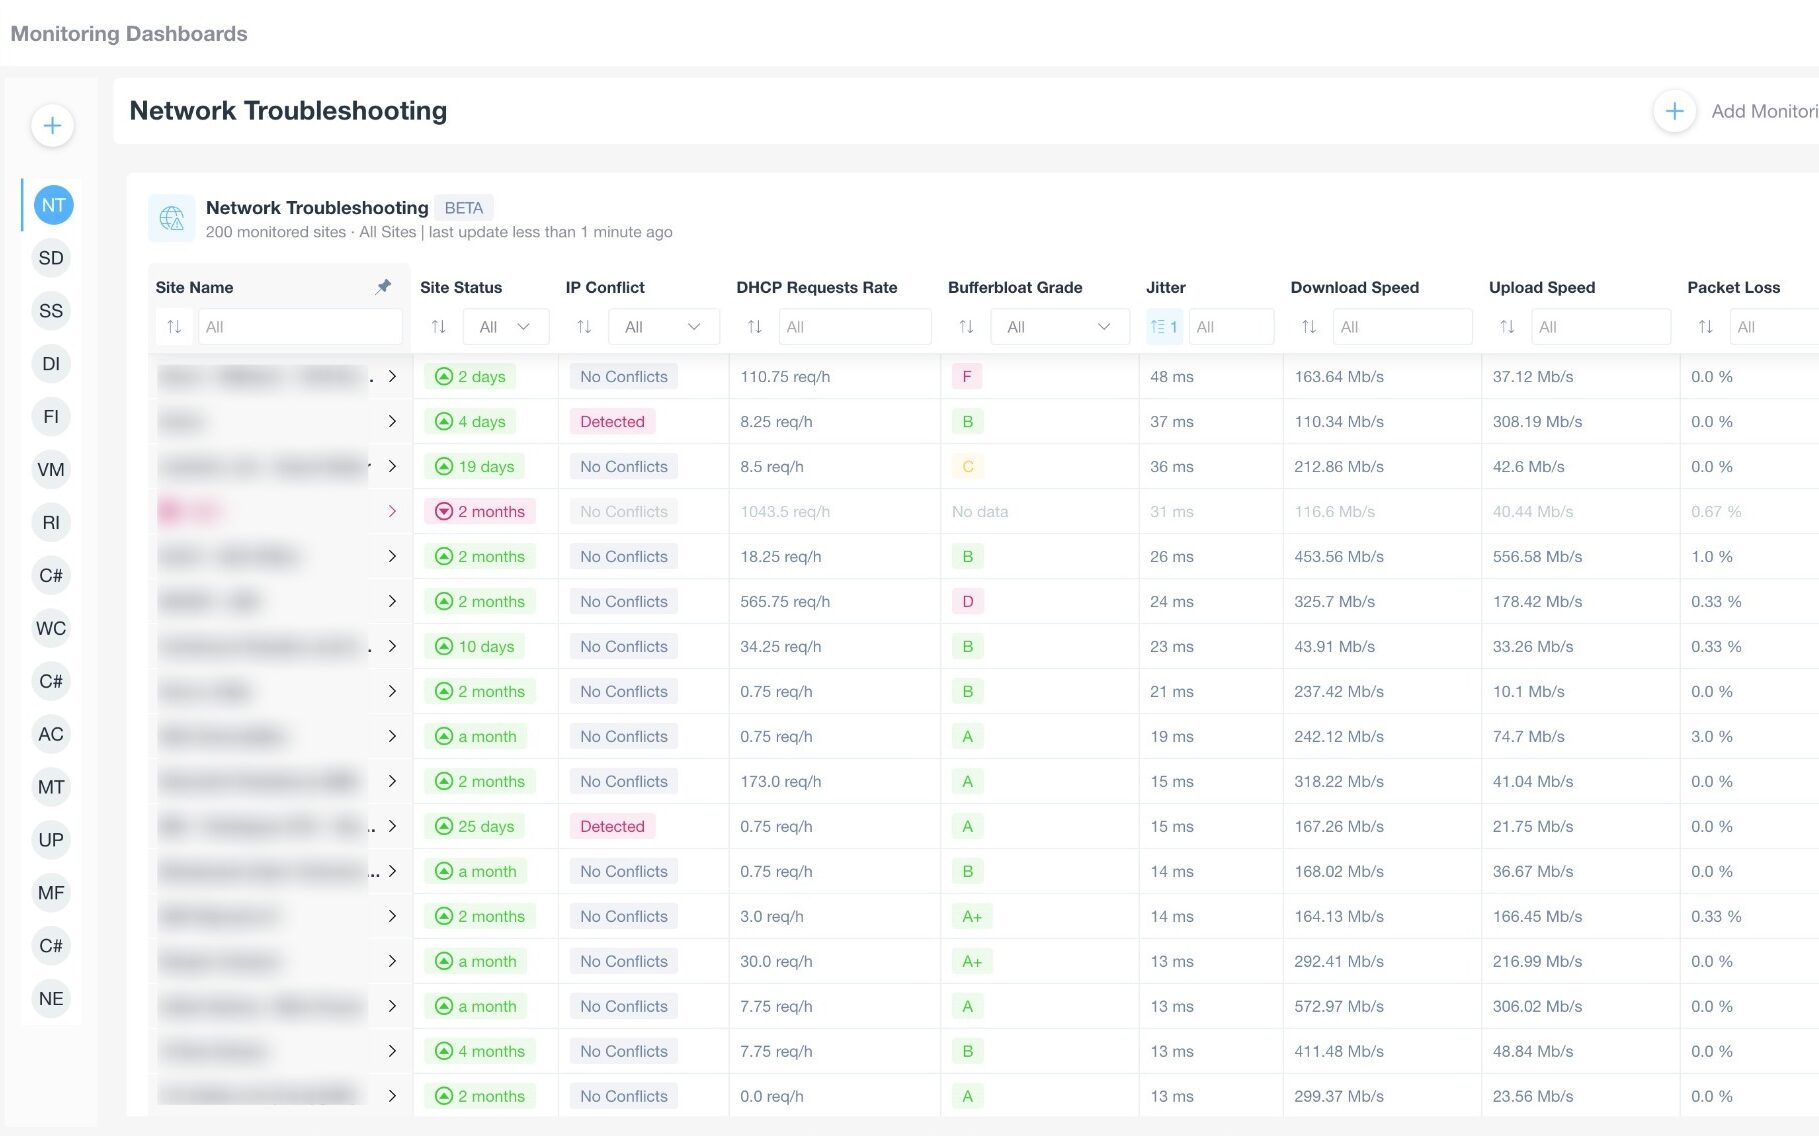
Network Troubleshooting Dashboard Overview
1. The dashboard shows a list of sites being monitored, each with parameters including "Site Status," "IP Conflict," "DHCP Requests Rate," "Bufferbloat Grade," "Jitter," "Download Speed," "Upload Speed," and "Packet Loss."
2. "Site Status" displays how long the site has been online, with color-coded statuses such as green for active days and red for extended downtimes.
3. "IP Conflict" indicates if any IP conflicts are detected, marked as "No Conflicts" or "Detected" in red.
4. "DHCP Requests Rate" shows the number of DHCP requests per hour for each site.
5. "Bufferbloat Grade" uses letter grades from A to F to assess network performance.
6. "Jitter" measures the variance in packet delay timing, shown in milliseconds (ms).
7. "Download Speed" and "Upload Speed" are listed in megabits per second (Mb/s) to show current network speeds.
8. "Packet Loss" is represented as a percentage, indicating the data loss rate during transmission.
9. Navigate through the list or use filters at the top of each column to sort or search for specific site data.
This powerful addition to the Domotz suite enables you to:
- IP Conflicts Identification: IP conflicts can cause significant network disruptions. This feature automatically detects and alerts you to any IP address duplications, enabling you to act swiftly to resolve conflicts and maintain network integrity.
- DHCP Request Monitoring: Understanding DHCP traffic patterns is essential for network stability. This tool displays the rate of DHCP requests in real time and allows you to set threshold-based alerts. This will essentially help you avoid potential network capacity issues.
- DHCP Requesters Identification: Gain insights into which devices are making frequent DHCP requests or failing to receive an IP address. This diagnostic information is critical for troubleshooting devices that may cause network strain or identifying malfunctioning equipment.
- Bufferbloat Grade: Bufferbloat can significantly degrade network quality. Our grading system evaluates your internet connection’s latency under different conditions, helping you pinpoint and rectify bufferbloat problems.
- Jitter Measurement: Jitter affects the quality of real-time applications like VoIP and streaming. By measuring jitter, this tool helps fine-tune the network to ensure smooth delivery of time-sensitive data packets.
- Packet Loss Monitoring: Packet loss is a critical parameter that can affect data integrity and transmission efficiency. This feature measures and displays packet loss, enabling you to determine the reliability of your internet connection.
- Latency Measurement: Latency measures the delay experienced in a network. This tool helps you monitor the latency from your network to external services, like Google’s public DNS, assisting you in maintaining a responsive network environment.
- Download and Upload Speeds: Network bandwidth is a precious resource. Monitoring download and upload speeds gives you the data necessary to manage and allocate bandwidth, ensuring your network can handle critical workloads efficiently.
This new feature has undergone rigorous testing by our dedicated Domotz Channel Partners. The new Network Troubleshooting Table has received outstanding feedback from our Channel Partners.
One such testimonial to its effectiveness is:
“The updated dashboard’s network grading and bufferbloat metrics are exceptional tools that have already proven their worth in critical sales contexts. This level of detailed, actionable data swiftly cuts through the noise, allowing us to promptly pinpoint and address network issues. The Network Troubleshooting Dashboard’s precise metrics, such as the IP Conflict indicator, have been pivotal in real-world applications, including critical sales engagements. This tool exemplifies our commitment to providing reliable data that empowers teams to act decisively and effectively manage their networks.”
— Joshua Needle, Solutions Architect at Broad Spectrum Services, LLC
To conclude, for a comprehensive guide on using these features to optimize your network, visit our User Guide on Network Troubleshooting.
New Custom Scripts
You can use custom scripts to monitor and manage, for example, network-connected devices, cloud services, and web applications. By using standard network protocols, these scripts will allow you to retrieve valuable data and execute actions on the monitored devices and services.
This month, we released the following:
- SonicWall
- Interfaces (IPV4)
- VPN Stats
- Policies (IPV4)
- Access-Rules (IPV4)
- Switch VLAN List
SonicWall
SonicWall (SonicOS 7) – Interfaces (IPV4)
With this script, you will be able to monitor the following:
- Interface Name
- Ip Address
- Gateway
- Zone
- User Login
- Management
By the use of a parameter value, it is possible to filter among the Interface Names:
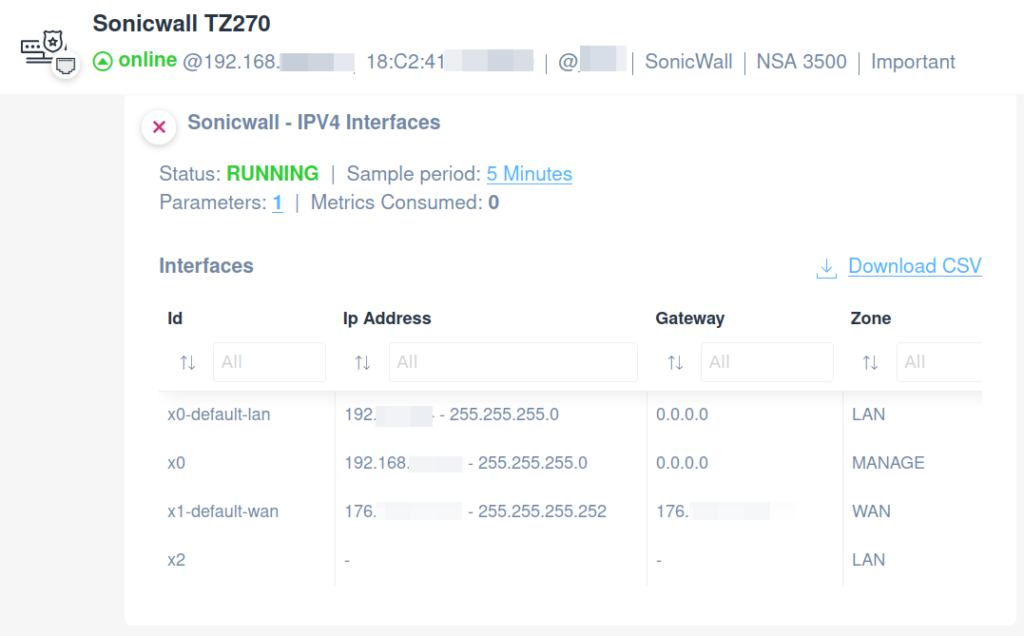
SonicWall Interface Status Overview
1. The status of the SonicWall device is displayed as "Running" with a sample period link for "5 Minutes".
2. Metrics show "Parameters: 1" and "Metrics Consumed: 0".
3. A table labeled "Interfaces" lists network interface details:
- The "Id" column includes entries like "x0-default-lan" and "x1-default-wan".
- The "Ip Address" column shows IP ranges, such as "192.x.x.x - 255.255.255.0".
- The "Gateway" column contains IP addresses like "0.0.0.0" or is blank.
- The "Zone" column categorizes each entry, e.g., "LAN", "MANAGE", or "WAN".
4. A "Download CSV" link is available to export the interface data.
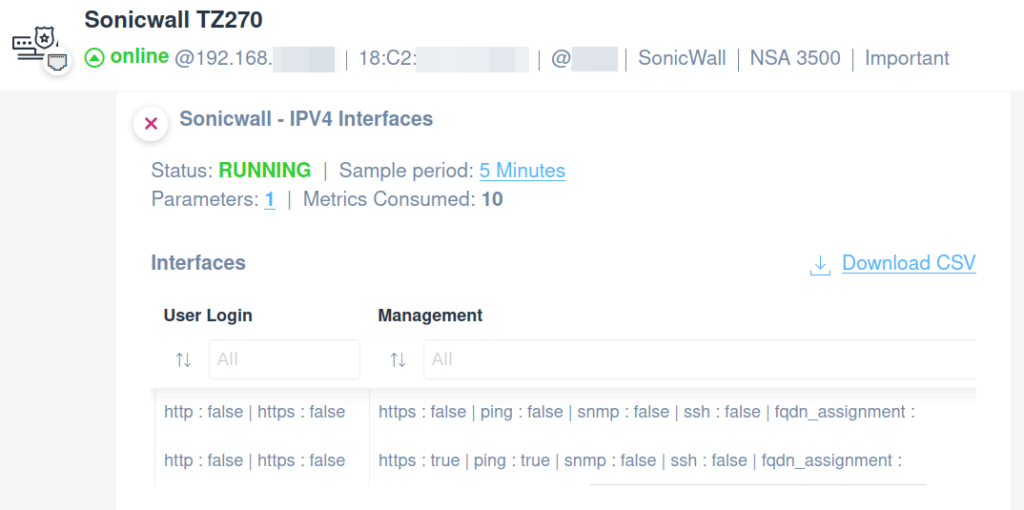
Sonicwall TZ270 Device and Interface Status
1. The Sonicwall TZ270 device displays an "online" status next to the IP address, ensuring connectivity.
2. The section "Sonicwall - IPV4 Interfaces" shows a status of "RUNNING," indicating active operation.
3. The sample period is set to 5 minutes, parameters count is 1, and metrics consumed are 10.
4. The Interfaces table has two columns: "User Login" and "Management." Each column lists network protocols such as HTTP, HTTPS, SNMP, and SSH with boolean values indicating if they are active.
5. An option to download this data as a CSV file is available on the right side.
SonicWall (SonicOS 7) – VPN Stats
Apply this script to monitor the following:
- VPN sessions count
- VPN session name
- Local IP Address
- Remote IP Address
- Date/time of the Login to the VPN
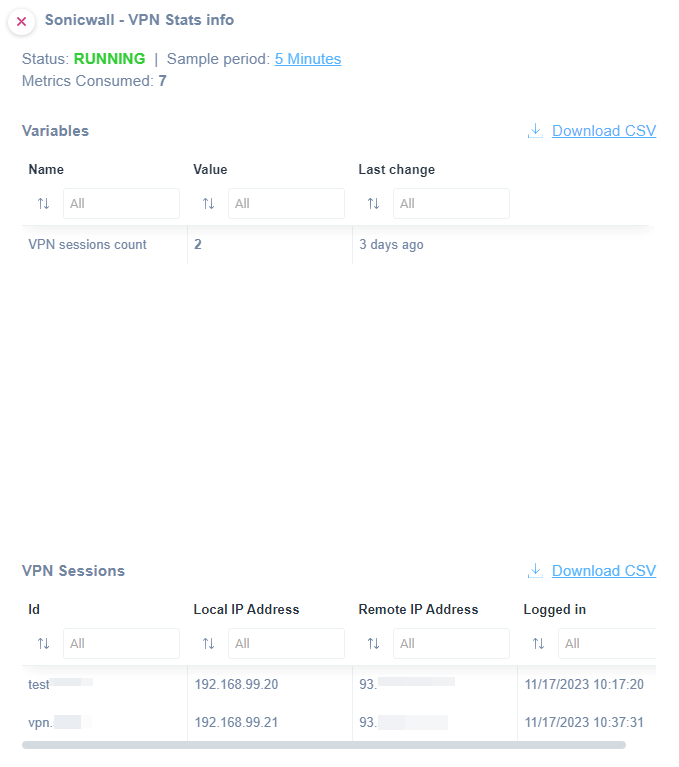
Sonicwall VPN Stats Information
1. Status is displayed as "RUNNING" with a sample period of 5 minutes. Metrics consumed are 7.
2. Under "Variables," there is an entry for "VPN sessions count" with a value of 2, last changed 3 days ago.
3. In the "VPN Sessions" section, there are two sessions listed:
- The first session shows ID as "test," Local IP Address as "192.168.99.20," and Remote IP Address partially obscured as "93.xx.xx.xx." The login time is "11/17/2023 10:17:20."
- The second session shows ID as "vpn," Local IP Address as "192.168.99.21," and Remote IP Address partially obscured as "93.xx.xx.xx." The login time is "11/17/2023 10:37:31."
4. A "Download CSV" option is available next to both the Variables and VPN Sessions sections.
SonicWall (SonicOS 7) – Policies (IPV4)
Use this script to retrieve information about the following:
- Policy Name
- Description
- Enabled (or Disabled)
- Inbound rules
- Outbound rules
- Source rules
- Destination rules
By the use of a parameter value, it is possible to filter among the Policies Names:
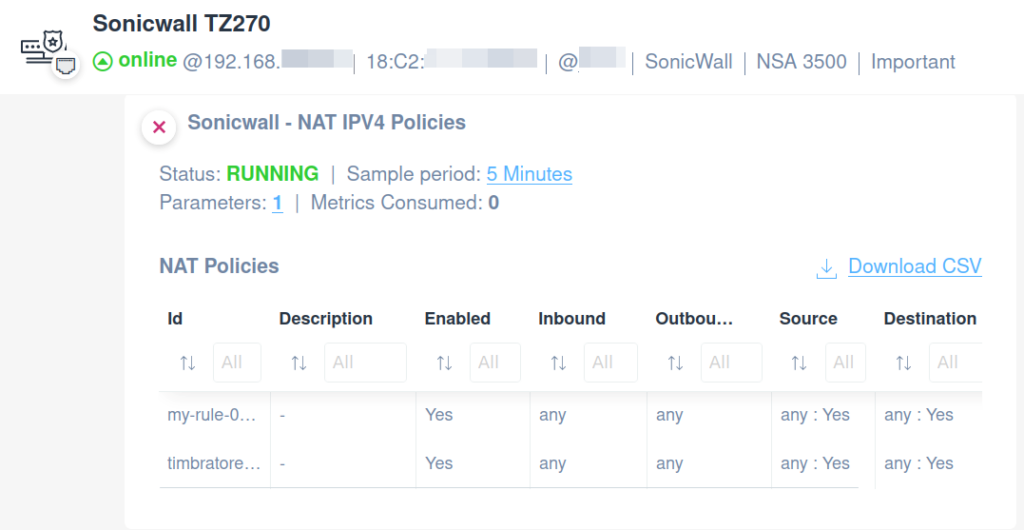
Sonicwall NAT IPv4 Policies Overview
1. Verify the status as "RUNNING" to ensure NAT policies are active.
2. Check the sample period link, noted as "5 Minutes," to understand the frequency of data sampling.
3. Review parameters by clicking "1" to see detailed settings.
4. Look at "NAT Policies" details:
- Each row lists an ID (e.g., "my-rule-0"), description, and whether the policy is enabled.
- Check inbound and outbound settings, indicated as "any."
- Confirm source and destination columns, with values showing "any : Yes."
5. Option to download the policy details using the "Download CSV" link.
SonicWall (SonicOS 7) – Access-Rules (IPV4)
Last but not least, with this script, you will be able to monitor the following:
- Rule Name
- Description
- Enabled (or Disabled)
- From (network)
- To (network)
- Source (ip/host/port)
- Destination (ip/host/port)
- Action
By the use of a parameter value, it is possible to filter among the Access Rules Names:
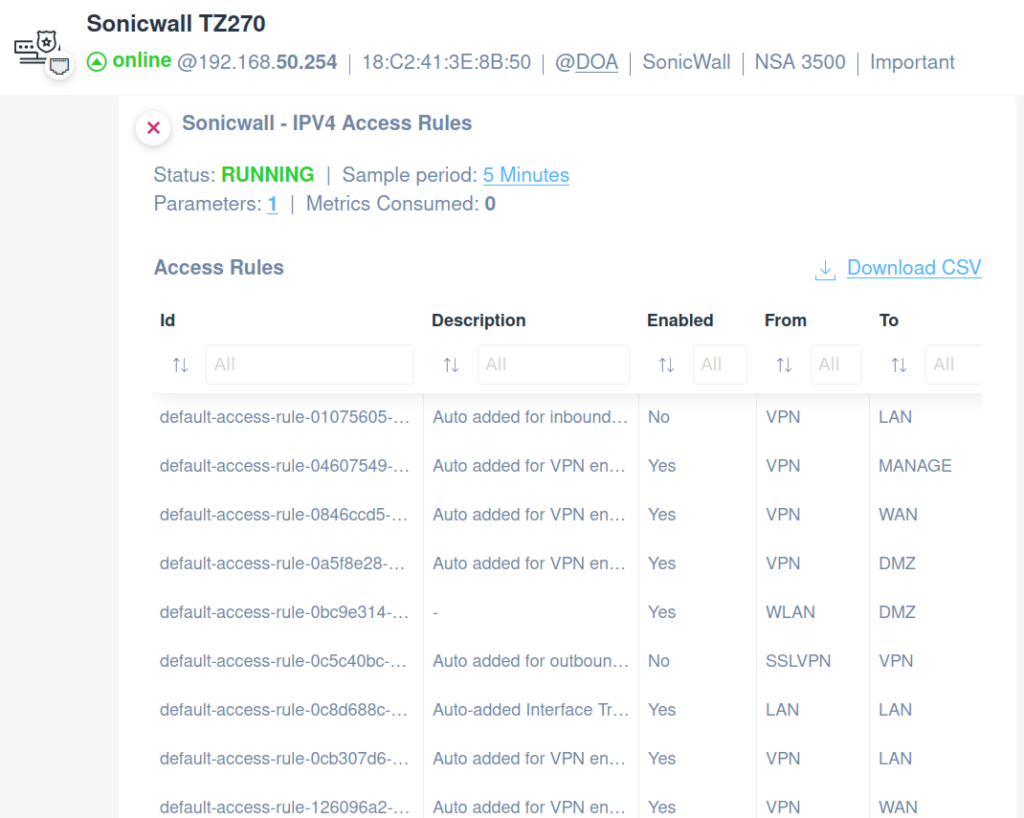
Sonicwall Access Rules and Status Overview
1. The Sonicwall TZ270 device is online with an IP address of 192.168.50.254.
2. The status section shows "RUNNING" with a sample period of 5 minutes. It indicates one parameter and zero metrics consumed.
3. The "Access Rules" section lists rules for IPV4 with columns for Id, Description, Enabled status, From, and To.
4. There are several entries such as "default-access-rule-01075605-" which is not enabled and is set from VPN to LAN.
5. Other rules example: "default-access-rule-04607549-" is enabled, set from VPN to MANAGE.
6. An option to download the rules as a CSV file is available, useful for further analysis or record-keeping.
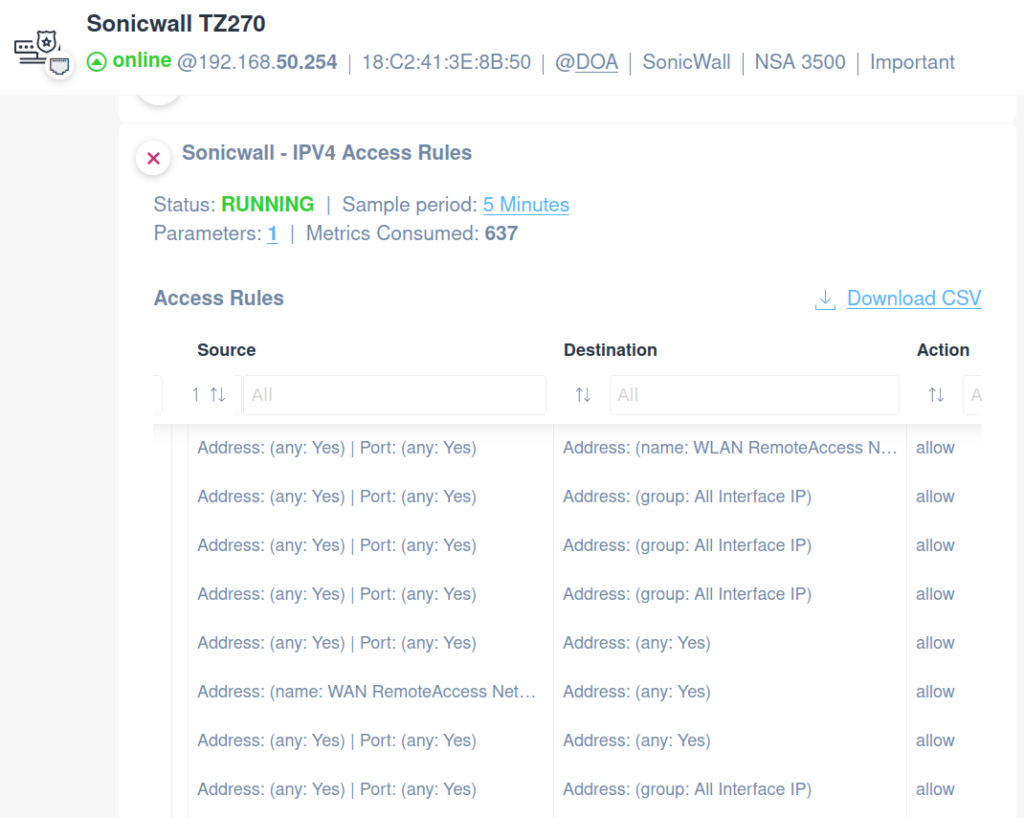
SonicWall TZ270 Access Rules Overview
1. The SonicWall TZ270 interface shows the device status as "online" with the IP address 192.168.50.254 and MAC address 18:C2:41:3E:8B:50. The relevant SonicWall model and settings are displayed in the header.
2. Under "SonicWall - IPV4 Access Rules," the status is "RUNNING," indicating the device is active. The sample period is set to 5 Minutes with 1 parameter and 637 metrics consumed.
3. The "Access Rules" section lists rules governing traffic. Each rule has three columns: "Source," "Destination," and "Action."
4. The "Source" and "Destination" columns show address configurations. Most entries indicate any address and port, with specific names or groups in some destinations.
5. The "Action" column denotes that all listed rules are set to "allow."
6. A "Download CSV" link is available for exporting the rules and logs for further analysis.
Switch Vlan List
This custom script will allow you to monitor the list of the VLANs configured on a switch:
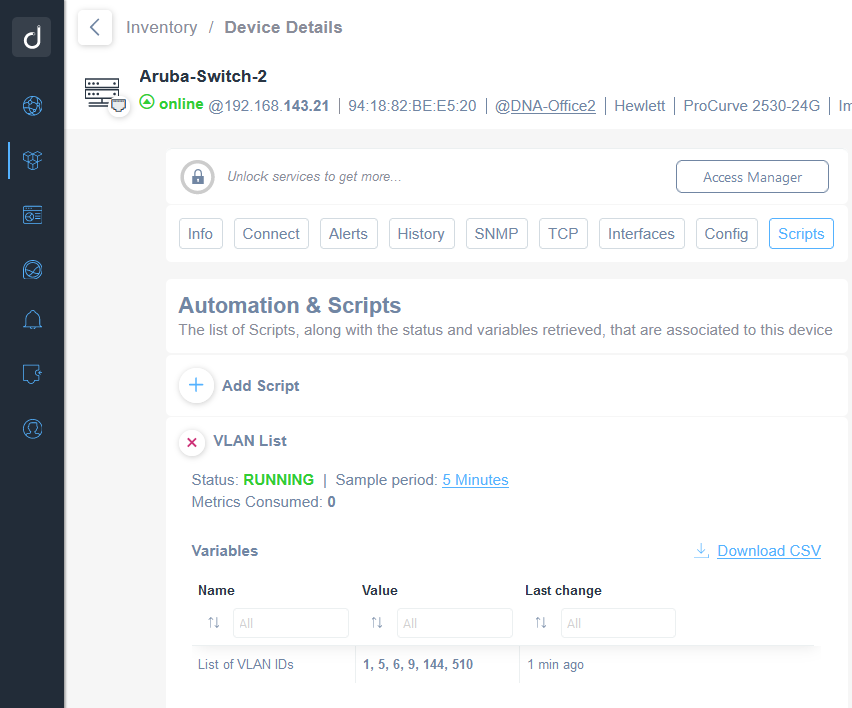
Device Script Management Interface
1. This view shows the details for "Aruba-Switch-2" under the "Inventory / Device Details" tab.
2. The device status is online, with the IP address 192.168.143.21 and additional specifications like MAC address, location, manufacturer, and model.
3. The navigation bar provides options like Info, Connect, Alerts, History, SNMP, TCP, Interfaces, Config, and Scripts.
4. The "Automation & Scripts" section lists scripts associated with this device.
5. Under "VLAN List," the script's status is marked as running. The sample period is set to 5 minutes and metrics consumed are zero.
6. The "Variables" subsection lists the VLAN IDs with recent changes.
7. Options to "Add Script" or "Download CSV" are available to manage scripts and export data.
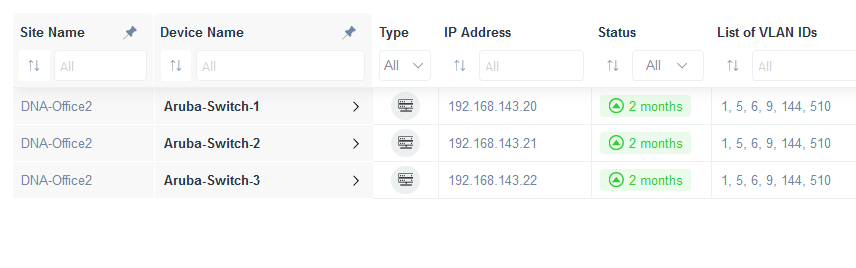
Network Device Overview Table
1. Site Name: Displays "DNA-Office2" for all entries.
2. Device Name: Shows "Aruba-Switch-1", "Aruba-Switch-2", and "Aruba-Switch-3" respectively across rows.
3. Type: Each device is marked with a generic icon.
4. IP Address: Lists the IPs "192.168.143.20", "192.168.143.21", and "192.168.143.22".
5. Status: Indicates the devices have been active for "2 months".
6. List of VLAN IDs: Displays VLAN IDs "1, 5, 6, 9, 144, 510" for each device.
7. Filters available at the top allow sorting and selecting options for each column.
New SNMP templates
About the pre-configured SNMP templates, this month, we released the following:
- SonicWall – General Documentation
- Juniper – Serial Number
Sonicwall – General Documentation
With this SNMP template, you will be able to monitor the following general properties:
- Serial Number
- Firmware Version
- CPU Utilization
- Ram Utilization
- Connections Available
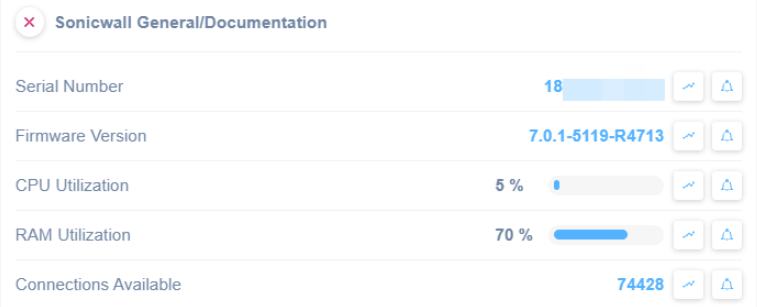
Sonicwall System Overview
1. The serial number is partially obscured for security. Use it for product identification and support.
2. The firmware version is 7.0.1-5119-R4713, indicating the current software build. Check for updates regularly.
3. CPU utilization is at 5%, showing system processing load. Monitor to ensure efficient operation.
4. RAM utilization is at 70%, depicting memory usage. Consider upgrading if consistently high.
5. Connections available are 74,428, indicating capacity for handling network traffic.
Juniper – Serial Number
The Juniper Serial Number SNMP template is really useful if you want to get the serial number of your Juniper appliances to synchronize it with your documentation system:

Juniper Serial Number Section
1. The section is titled "Juniper Serial Number."
2. Below the title, the label "Serial Number" is followed by the serial number "NY0," which is partially highlighted.
3. To the right of the serial number, there are icons for additional actions: a graph icon and a bell icon.
Once applied, the serial number will be populated in the Domotz Info tab, allowing you to synchronize it with your favorite documentation system:
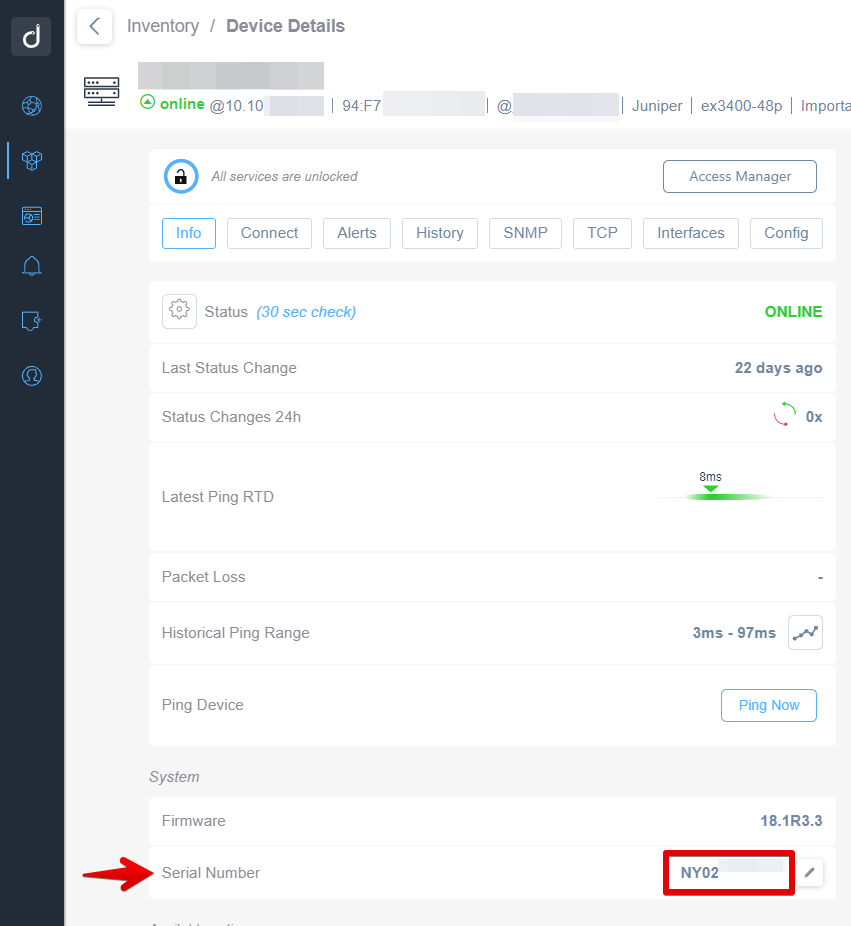
Device Details Interface Overview
1. **Navigation:** The image shows a device details page within an inventory system. The breadcrumb navigation at the top indicates the user is viewing "Device Details" under "Inventory."
2. **Device Status:** The device is currently "online," with the IP address and other identifying details like the device type and model shown.
3. **Tabs:** There are several tabs available for device information: Info, Connect, Alerts, History, SNMP, TCP, Interfaces, and Config.
4. **Status Information:** The status section displays operational metrics:
- The status is labeled "ONLINE."
- The last status change occurred "22 days ago."
- Status changes in the past 24 hours are "0x."
- The latest ping round-trip delay (RTD) is "8ms."
- Historical ping ranges from "3ms - 97ms."
5. **System Information:** The firmware version is "18.1R3.3." The serial number is displayed as "NY02" and can be edited as indicated by a pencil icon next to it.
This layout is designed for users to easily access detailed information about network devices and manage their configurations efficiently.
Improvements
Serial Number Export/Import in Excel
Domotz enhances the Excel export/import functionality for device lists. Now, the Serial Number of devices, whether it’s retrieved automatically via UPnP, SNMP, Bonjour, etc., manually entered by the user, or synchronized with external systems like IT Glue, ConnectWise Manage, Syncro, is included in the Excel sheet exported from the Domotz Device list.
Furthermore, this Serial Number field in the Excel sheet can be edited and re-imported back into Domotz, offering greater flexibility and control in device management.
Reduction of Custom Scripts Metrics Consumption
We’ve optimized the consumption accounting for variables extracted via Custom Scripts. Previously, each cell within a table was counted as a separate metric, leading to higher consumption counts. Now, we’ve refined this metric count (in line with what is offered with the SNMP templates) to consider each column as one metric, regardless of the number of rows.
For instance, a table with ten rows and six columns, which used to count as 60 metrics, will now only count as 6. This change significantly reduces the consumption count, allowing for more efficient use of Custom Scripts.
Enhanced Ubiquiti Model Extraction in Ubiquiti Integration
In our latest update, we have refined the process of extracting data for Ubiquiti devices. By sourcing data from a wider array of fields, we’ve significantly improved the reliability and accuracy in identifying specific Ubiquiti models. This enhancement ensures more precise device recognition, providing users with more dependable information for their Ubiquiti integrations.
Fetch Activity Logs via Public API
Domotz expands its Public API offerings to include the ability to extract Agent Activity Logs. This new functionality enables users to access, for instance, logs related to notes, remote connections, power control, and more directly through the Domotz API. This enhancement provides a more streamlined and efficient way to manage and analyze activity logs.
For more details and to access this feature, visit the Domotz Public API documentation.
Fixes
Additionally, we’ve fixed the following issues:
- Serial Number column filters on the Inventory Dashboard were not always working.
- PoE Port Mapping – Mikrotik Switches missing PoE Port Control.
- ITGlue integration – increased number of displayed organizations.
- ITGlue integration – Error on Sync when creating entities.
- ITGlue integration – auto/manual sync stuck “in progress”.
- When opening the Monitoring Side Panels, the operation sometimes dragged the table the user was on.
- Serial Numbers from SNMP Templates were not showing in Inventory.
- Cisco Catalyst integration: A single VLAN data fetching must not break other working data collection retrieval.
- Sony TV Built-in Driver now Includes ‘Sony Home Entertainment&Sound Products Inc’ as a vendor.
- Configuration Management: HP Aruba AP is constantly changing backups, and the issue has been resolved.
- Lastly, Domotz Mobile App for iPhone/iPad: the user could not add a pre-configured SNMP sensor template.
Known limitations
- You cannot remove the alerts for IP Conflict without removing the default custom filter for all the Agents.
- There is no central repository for all the SNMP pre-configured, OS Monitoring, and Custom Integration script sensor alerts.
- Monitoring Dashboards are currently limited to Monitoring Tables as Widgets.
- Luxul Router-based Agents do not support VPN on demand. To elaborate, we’ll add this capability as soon as Luxul’s team provides us with the required API.
- You can’t configure the static IP address on the Domotz Box before configuring the Agent.
- Lastly, you can’t leverage DHCP on additional VLANs on the Domotz Box.
To conclude, these release notes cover the changes, including Domotz Pro Cloud, Domotz Agent, and Domotz Pro App. Learn more about our software on our website or read our blog to stay updated with modern network and IT Infrastructure monitoring and management.