
The purpose of this article is to explain the distinctions between “Managed devices” and “Unmanaged devices” within Domotz when utilizing the Custom Selection Monitoring feature of the Domotz Collector.
Managed devices
For Managed device, we intend an asset for which you intend to:
- associate an alert
- trigger a workflow (like syncing to a documentation system, PSA, Slack, a webhook or anything else)
- view behavioral properties (either SNMP variables or our very flexible custom integration drivers) or history of state changes
- perform any action such as establish a secure connection for remote access, or backup a configuration file
Unmanaged (aka Monitored) devices
Unmanaged devices are assets connected to your network but not actively monitored or controlled by Domotz. Consequently, you cannot assign alerts, sensors or drivers to these devices. However, they remain visible on the Topology Map and within each Collector Device List, making them easy to identify.
Please note that these devices will not appear in searches within the Inventory Dashboard, or being synced with Documentation systems.
Display Managed and Unmanaged devices
Collector’s Device List
Within the Devices List on your Collector, you can display both Managed and Unmanaged devices by clicking on the specified buttons:
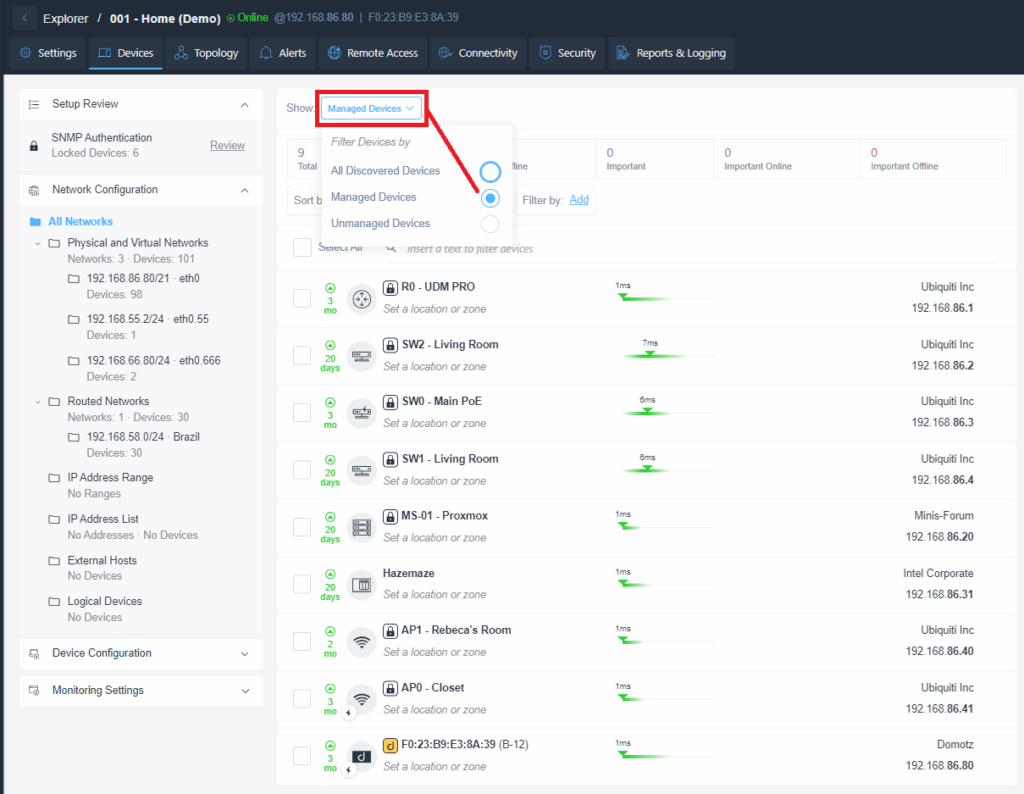
Filtering Devices in a Network Management Interface
1. Locate the "Show" dropdown menu at the top center of the interface and select "Managed Devices" from the options. This filters the network device list to display only managed devices.
2. On the left, explore the network tree under "All Networks" to view details about physical and virtual networks, routed networks, IP address ranges, and external hosts.
3. In the main panel, view the list of devices, which include information like device names (e.g., "R0 - UDM PRO"), location status, and the manufacturer with their IP addresses (e.g., "Ubiquiti Inc 192.168.86.1").
4. Use the checkboxes beside each device to select them for applying further actions or settings if needed.
5. The columns above the device list provide quick status insights, such as the number of devices online or flagged as important.
6. Additional settings like "Setup Review" and "Network Configuration" are available on the left sidebar for deeper configurations.
Use these steps to efficiently manage and analyze devices within this network management tool.

Manage Unmanaged Devices in Network Configuration
1. Navigate to the "Explorer" tab in the top navigation bar and select the "Devices" section.
2. In the left sidebar under "Setup Review," expand "Network Configuration" and select "All Networks."
3. Within "All Networks," choose the network "192.168.86.80/21 - eth0.666" under "Physical and Virtual Networks."
4. In the right panel, ensure "Unmanaged Devices" is selected from the filter options at the top.
5. Review the list of unmanaged devices displayed, such as "Echo," "ProductAgent for Windows," "iPhone," and others.
6. For each unmanaged device, locate the "Add to Managed Devices" option next to the device's name and select it to manage the device. Repeat for each device you wish to manage.
Use these steps to efficiently convert unmanaged devices to managed ones.
Inventory Dashboard
In the Inventory section, you can see all Managed devices across all your sites, or All Devices (Managed and Umanaged):

Device Inventory Management Interface
1. Navigate to the Inventory section, which displays a list of devices with tabs for "Organizations," "Collectors," "Managed Devices," and "All Devices." The "Managed Devices" and "All Devices" tabs are highlighted for selection. Use these to filter and view different device groups as needed.
2. View device statistics at the top, showing totals for "Devices," "Managed," "Unmanaged," "Online," "Offline," and "Not Configured." These numbers provide an overview of the device status.
3. Use the filter options to narrow down devices by various criteria including "Collector," "Device Name," "Status," "Type," "Make/Model," "IP Address," "Organization," "Location/Zone," "Tags," and "Credentials."
4. Observe the device list, which includes columns for "Collector," "Device Name," "Status," "Type," "Make/Model," "IP Address," "Organization," "Location/Zone," "Tags," and "Credentials." Relevant information like status (e.g., 'Critical', 'Important') is highlighted in red for emphasis.
5. To update or refresh the device information, select the "Refresh Data" option found at the upper right corner.
This interface efficiently categorizes and provides detailed information on all connected devices, aiding in effective inventory management and troubleshooting.
Network Topology
In the Domotz Network Topology, on the other hand, you will be able to see ALL the devices regardless of whether they are Managed or Unmanaged:

Network Topology Visualization
1. The central node labeled "R0 - UDM PRO" shows an IP address of 192.168.86.1 and indicates a connection to the internet with download and upload speeds specified.
2. From the central node, connections branch out to several devices. The "SW0 - Main PoE" node directly connects to "R0 - UDM PRO" with an IP of 192.168.86.3.
3. "SW0 - Main PoE" connects to multiple devices:
- "AP0 - Closet" with IP 192.168.86.41.
- "ZoneFlex R710" marked as unmanaged at 192.168.86.40.
- "AP1 - Rebellious Room" with the last map update on 2023 September 26, IP 192.168.86.48.
- "MikroTik" which is unmanaged at IP 192.168.86.215.
- "ZimaBoard2" at IP 192.168.86.121.
4. The device "SW1 - Living Room" at IP 192.168.86.4 is connected to "SW0 - Main PoE" and branches out to "SW2 - Living Room" which has 3 devices connected.
5. Each node indicates the number of associated devices, e.g., "ZoneFlex R710" has 4 devices, "AP1 - Rebellious Room" has 9 devices, and "MikroTik" connects to 10 devices.