
The Network Performance section includes a number of tools that help analyze the network to which the Collector is connected.
The feature is accessible from the Collector Dashboard, by selecting the following tile:
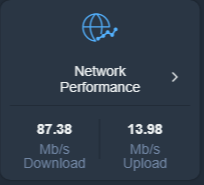
Network Performance Overview
1. View the "Network Performance" section indicated by a globe with a graph.
2. Find "Download" speed listed as "87.38 Mb/s".
3. See "Upload" speed listed as "13.98 Mb/s".
4. Use this information to assess the current network performance.
Info
The Info tab displays handy information such as the public (Internet-facing) IP address, network gateway, DNS, and DHCP server.
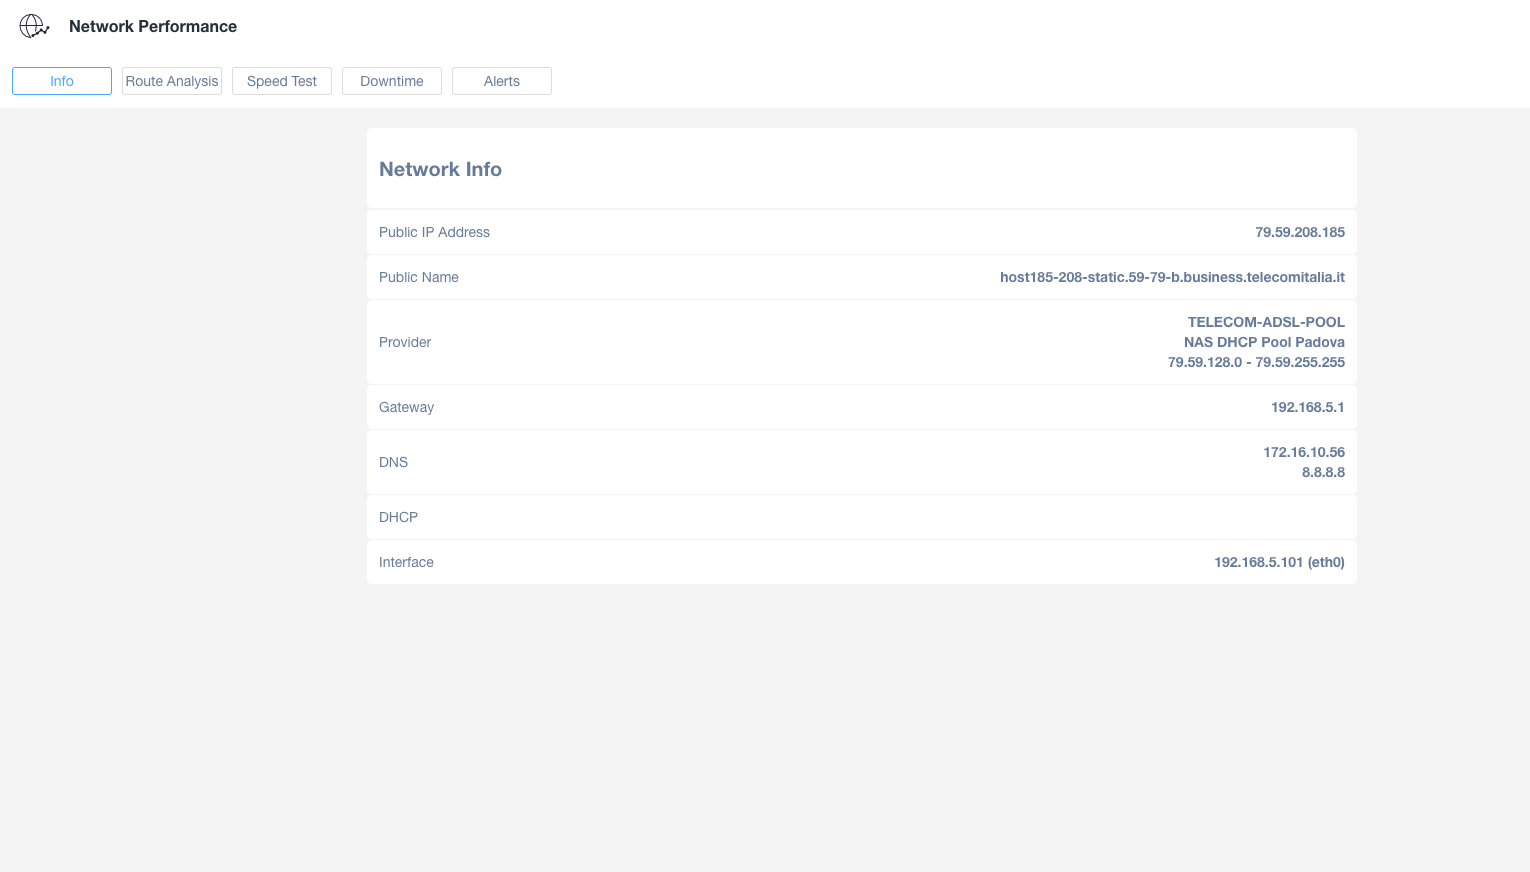
Network Performance Information Panel
1. The panel is titled "Network Performance" with navigation tabs for Info, Route Analysis, Speed Test, Downtime, and Alerts. The "Info" tab is currently selected.
2. Under "Network Info," the following details are displayed:
- Public IP Address: 79.59.208.185
- Public Name: host185-208-static.59-79-b.business.telecomitalia.it
- Provider: TELECOM-ADSL-POOL, NAS DHCP Pool Padova, 79.59.128.0 - 79.59.255.255
- Gateway: 192.168.5.1
- DNS: 172.16.10.56, 8.8.8.8
- DHCP: Not specified
- Interface: 192.168.5.101 (eth0)
Use this panel to view and assess network configuration and connectivity details.
Route Analysis
The Route Analysis allows you to send test packets to any Internet public server and measure packet loss in percentage, as well as round-trip delays.
This can be useful to understand where bottlenecks and issues reside in communicating with an external (or internal) target. For example, you can simply type in a website name or an IP address to start the analysis, then select if you want to send 10, 20, or 50 packets. We recommend starting with 10 packets. Once you’ve selected your options, simply select Start to begin the test.
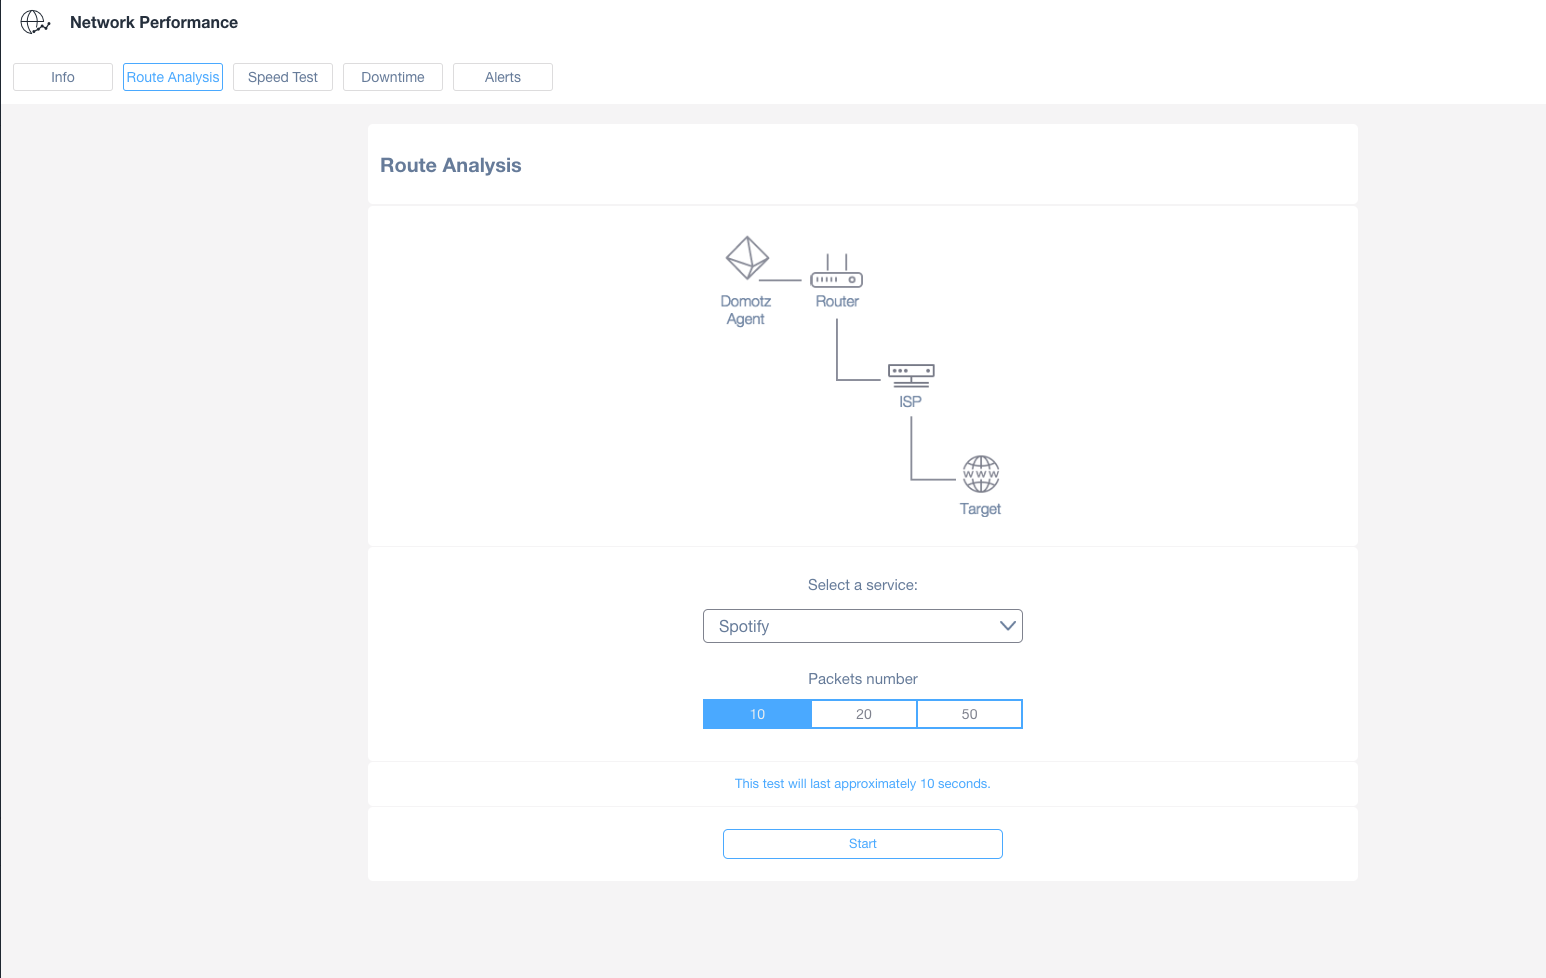
Network Performance Route Analysis
1. Navigate to the "Route Analysis" tab in the Network Performance section.
2. In the "Route Analysis" section, you will see a diagram displaying the pathway from a Domotz Agent, through a Router and ISP, to a Target.
3. Below the diagram, use the "Select a service" dropdown to choose the service you want to analyze, such as Spotify.
4. Choose the number of packets for the test by selecting one of the options: 10, 20, or 50.
5. Note that the test will take approximately 10 seconds.
6. Click the "Start" button to begin the route analysis test.
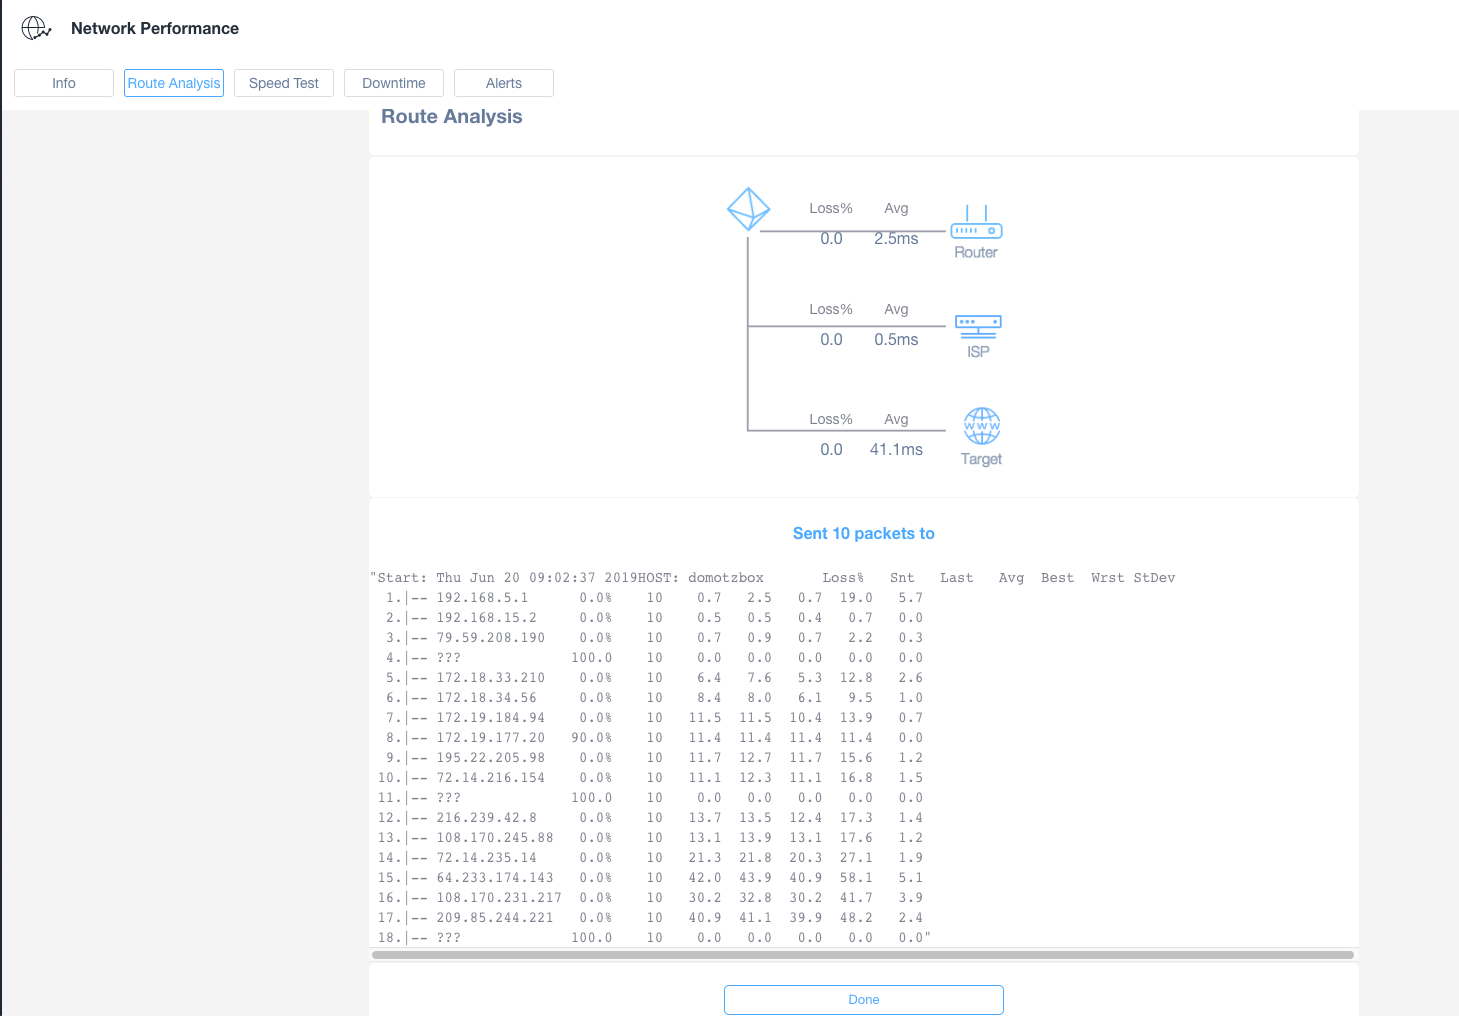
Network Route Analysis Overview
1. Navigate to the "Route Analysis" tab in the Network Performance section. This displays network performance metrics.
2. Examine the diagram for loss and average latency. The "Router" shows 0.0% packet loss and 2.5ms average latency. The "ISP" section also shows 0.0% packet loss with 0.5ms latency. The "Target" displays 0.0% packet loss and 41.1ms latency.
3. Review the data below the diagram for detailed packet transmission statistics, including packet loss percentage, sent packets count, and response times (last, average, best, worst, and standard deviation) across various IP addresses.
4. The final row may indicate complete packet loss, represented by 100% loss and zero statistics.
5. Click "Done" when you have finished analyzing the data.
You’ll see a graphical representation of the route, and then once the test is finished, you’ll see how long it took and if there were any obvious issues within your LAN (before the Router), between the Router and the ISP cabinet, or between ISP and the selected target.
You can select “See raw data” to get a full breakdown of the entire route. To start a new test, simply select Done and you’ll return to a screen where you can enter a new URL or IP address.
Speed Test
Domotz automatically executes a speed test between the Collector and the nearest test server every 6 hours. The following features are visible in this tab:
- Searchable graph, allowing you to zoom, search, and filter the history of the speed test results.
- Statistics are shown in the lower-left-hand corner of the screen.
- You can disable the automatic speed test using the toggle button below the graph.
- It is also possible to run the test manually at any time by selecting the Test Now button.
The speed tests are based on test Servers spread around the globe.
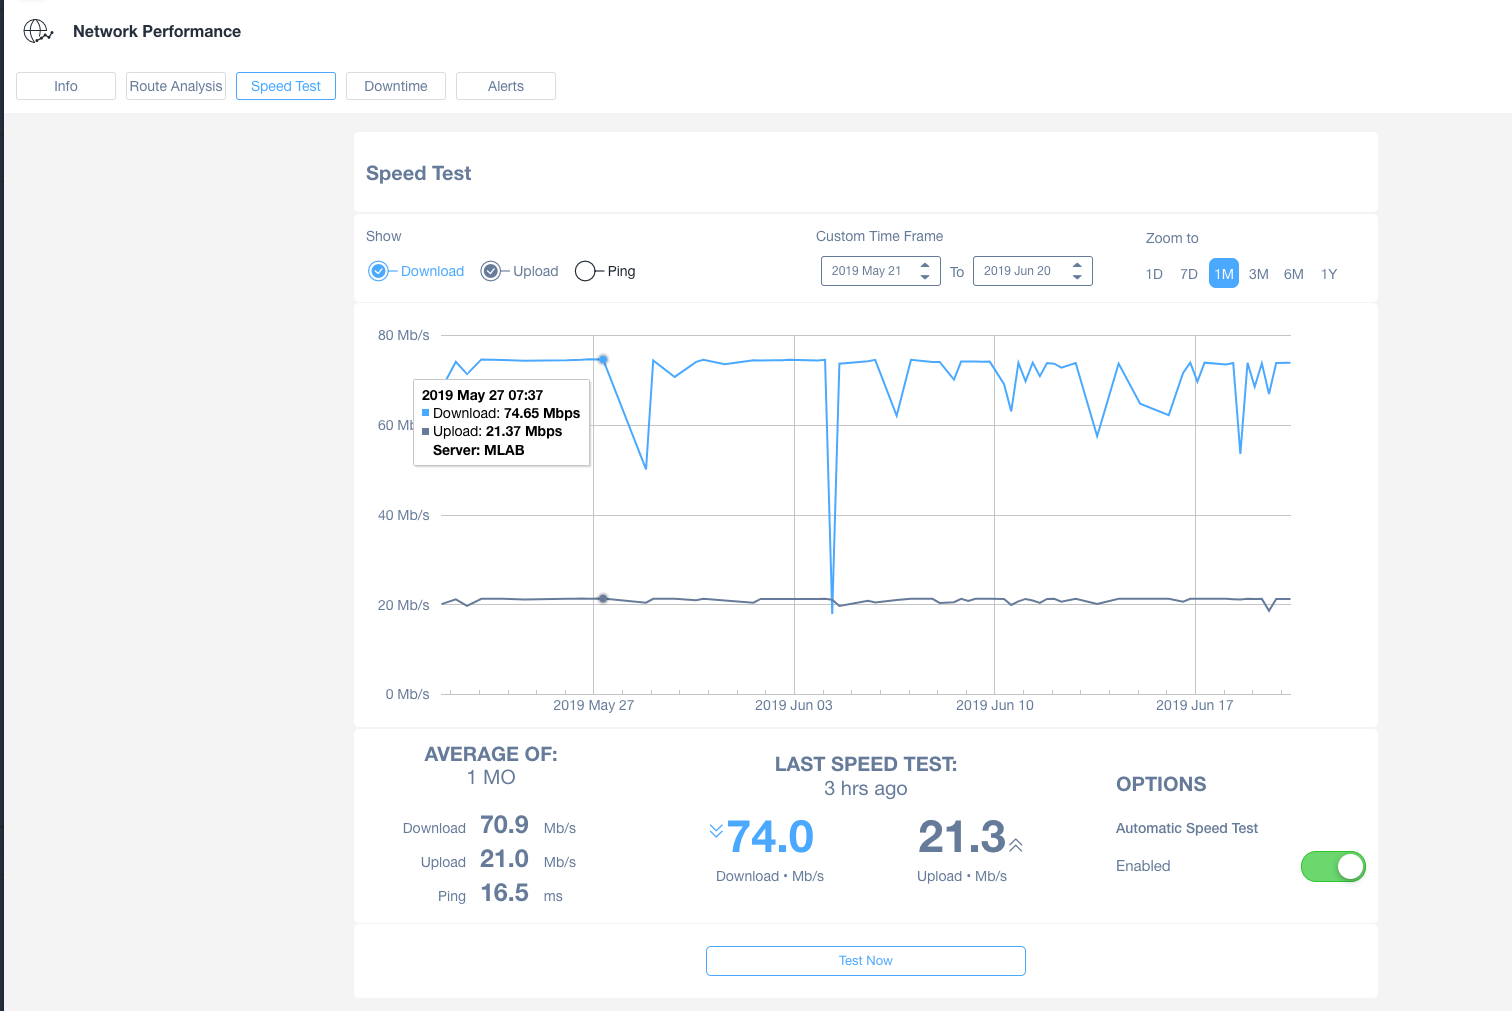
Network Performance Speed Test Results
1. The interface shows a "Speed Test" tab where download, upload, and ping speeds can be selected for display.
2. A graph displays internet performance over time with data points for download and upload speeds. An example data point on May 27 includes a download speed of 74.65 Mbps, an upload speed of 21.37 Mbps, on server MLAB.
3. Custom time frames for reviewing results can be selected using drop-down menus, or through preset options like 1 day, 7 days, or 1 month.
4. Below the graph, the average performance over one month is shown: Download at 70.9 Mbps, Upload at 21.0 Mbps, and Ping at 16.5 ms.
5. The most recent speed test, conducted 3 hours ago, shows a download speed of 74.0 Mbps and an upload speed of 21.3 Mbps.
6. An "Automatic Speed Test" option is enabled, indicated by a green toggle switch. A "Test Now" button is available to perform a new speed test.
Downtime
The Downtime tab provides a detailed log of the Collector’s connection status. This log captures changes in connectivity, indicating whether the internet connection is available (“Up”) or unavailable (“Down”). Specifically, the Domotz Collector tests the connection between itself and the Domotz Cloud.
For example, if you disconnect the Domotz Collector and then reconnect it, you will observe a pair of events in the log: “Connection Went Down” followed by “Connection Went Up.”
The network connection is measured from two points of view (see next section for further details):
- From the Collector’s point of view: every minute the Collector tries to ping outside the network. The downtime is reported as soon as the Collector is available to send the message back to the cloud.
- From the Cloud point of view: every minute the Collector sends a Heartbeat to the Domotz Cloud. If the Heartbeat is not received for a few minutes, the Cloud generates a trigger (Alert marked with a “bell” in the next picture), which if enabled generates a notification (either via email or push notification).
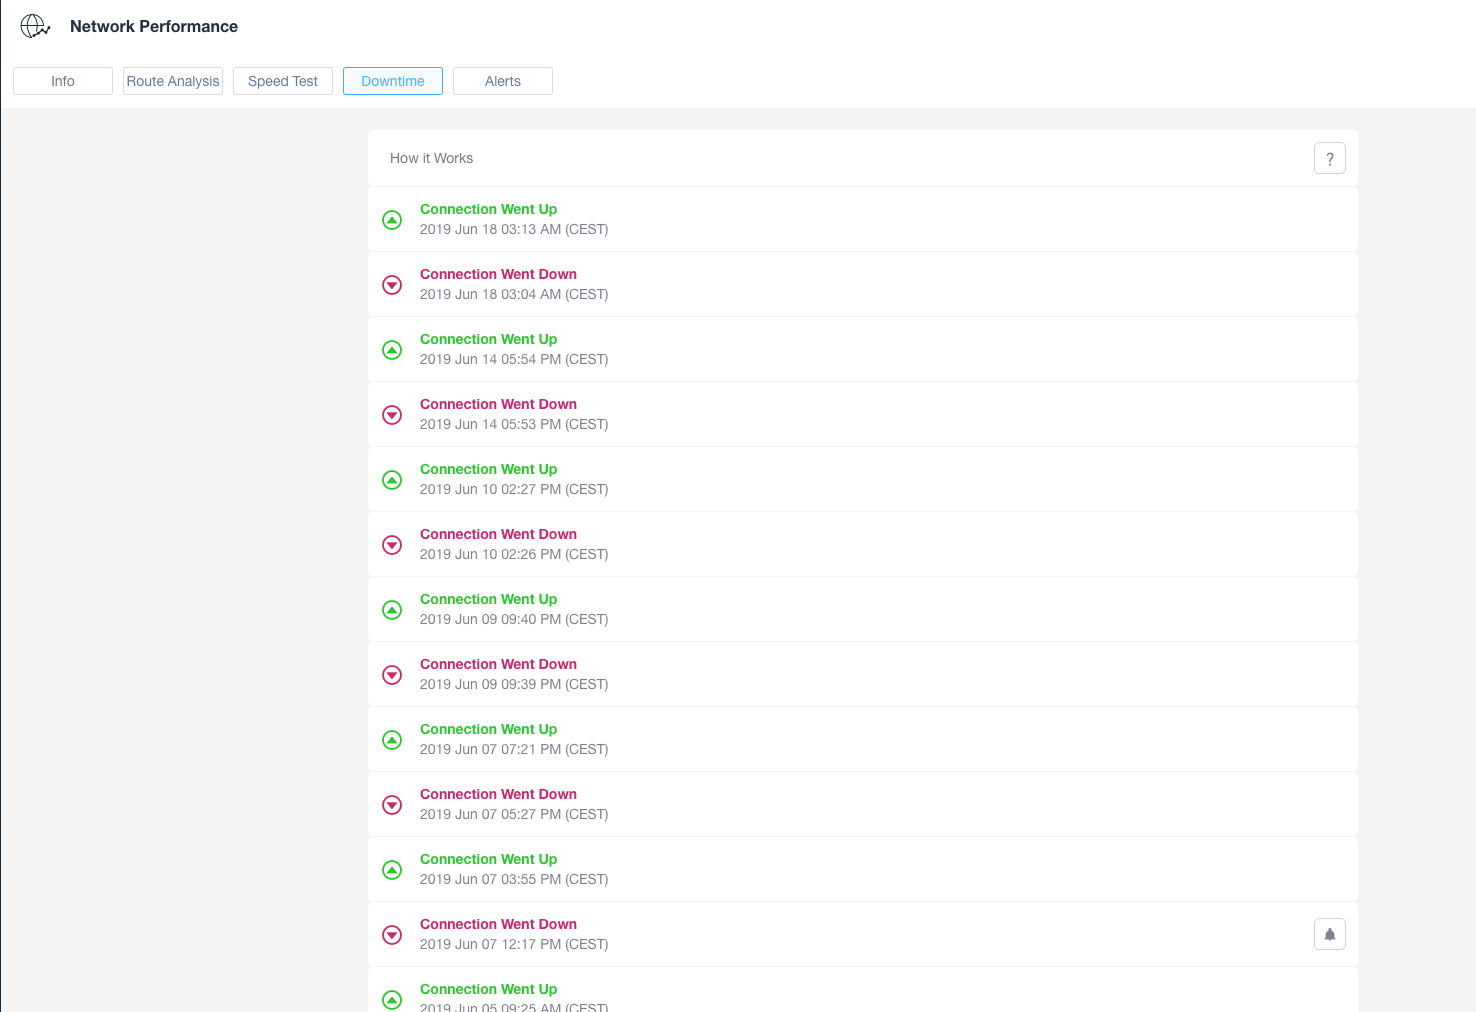
Network Downtime and Uptime Log
1. Navigate to the "Network Performance" section.
2. Select the "Downtime" tab to view connection status logs.
3. Each entry lists whether the connection went up or down, along with the precise date and time in CEST.
4. "Connection Went Up" and "Connection Went Down" events are shown with their respective timestamps for monitoring network stability.