
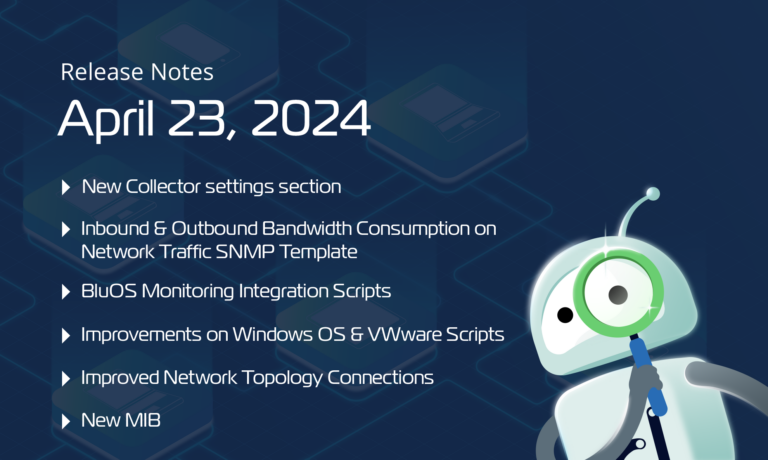
We’re excited to announce the newest round of updates and additions to Domotz. This April, we’re rolling out new integration scripts, like Windows OS Monitoring and BluOS, and the new Collector Settings section, providing more information on inbound and outbound bandwidth consumption, improving our network topology, improving IP-conflict resolution, and more.
We highly value your feedback and encourage you to contact our support team at support@domotz.com for any comments, questions, or suggestions you may have.
New Features
New Collector Settings section
With this new section, named “Collector Settings”, you can now effortlessly configure and modify your collector(s) settings in one convenient environment.
Currently, the Collector Settings section allows you to manage the following:
- Basic Information
- Default Credentials
- Documentation & Data Aggregation Platform
- Monitoring Configuration
- Booster Packs
- Notes

Collector Settings Overview and Configuration Steps
1. **Basic Information Section**: Displays details such as the Collector Name (Draper Office), Location (Draper, UT, United States), Time Zone (Denver, America), Customer Info (support@gmail.com), and Organization Name | ID (Domotz Inc.).
2. **Default Credentials**: Shows SNMP Authentication details, with Read: public and Read/Write: private.
3. **Documentation & Data Aggregation Platform**: Indicates that no integration has been added yet. Provides examples of potential integrations like Hudu, ConnectWise, Halo PSA, and Syncro, with an option to "Add".
4. **Monitoring Configuration**:
- States that all discovered devices will be automatically added, monitored, and managed.
- Monitoring Networks: Domotz scans periodic sources for discovering new devices.
- Additional Devices: Options to add External Hosts and Logical Devices.
5. **Licensing Information**: Notes that licensing and packaging options are changing on June 18th, with contact information provided for further inquiries and additional subscription details.
6. **Booster Packs**: Lists options to increase monitoring limits through Booster Packs, with details on Persistent Devices (44/10000) and Metrics (270/550).
The recent updates bring several significant improvements, enhancing your overall experience:
- User-Friendly Interface: The interface is even more intuitive, making navigation and settings management straightforward.
- Centralized Management: All collector-related information can now be managed from a single access point, streamlining the process.
- Faster Implementation: The system has been optimized for quicker setup and deployment.
- Cost Efficiency: Last but not least, by reducing installation time, we help you save on associated costs.
In the upcoming months, our developers’ team will work to add more management information in this section. Continue to follow us to be always updated
Add Inbound and Outbound Bandwidth Consumption Data on the Network Traffic SNMP Template
These new metrics provide an improved view of your network’s bandwidth usage, allowing for precise monitoring of inbound and outbound traffic through SNMP templates. You can easily analyze results, optimize network performance, identify bottlenecks, and plan for capacity.
Extend Public API to display Device SNMP Status information
By extending the Public API to include device SNMP status, you can leverage the Public API to automate both deployment and configuration processes.
You can now easily verify that all devices are correctly configured with the appropriate SNMP credentials. This capability streamlines the setup process, ensuring that network devices are properly authenticated and able to communicate via SNMP. It’s a significant step forward in simplifying network management, allowing for more efficient operations and reduced manual intervention in the configuration of network devices.
Domotz Public-API allows the configuration of the External Hosts scan policy
This update offers customizable scan policies for external hosts, including method selection and port scanning preferences. Additionally, it enhances security and efficiency by allowing you to tailor the scan to your specific needs. More detailed guidance is available in the Domotz Public API documentation, ensuring users can maximize this feature’s potential.
Integration Scripts
VMware Monitoring
VMware Virtual Machine vCenter Host Info
This script enables you to monitor the following metrics:
- Name
- Model
- Operating System
- CPU Model
- Processors
- Cores
- CPU Usage
- Memory
- Memory Usage
- Power State
- Status
- Connection State
- Uptime
The script has been validated and tested on VMware vCenter 8.0.2.
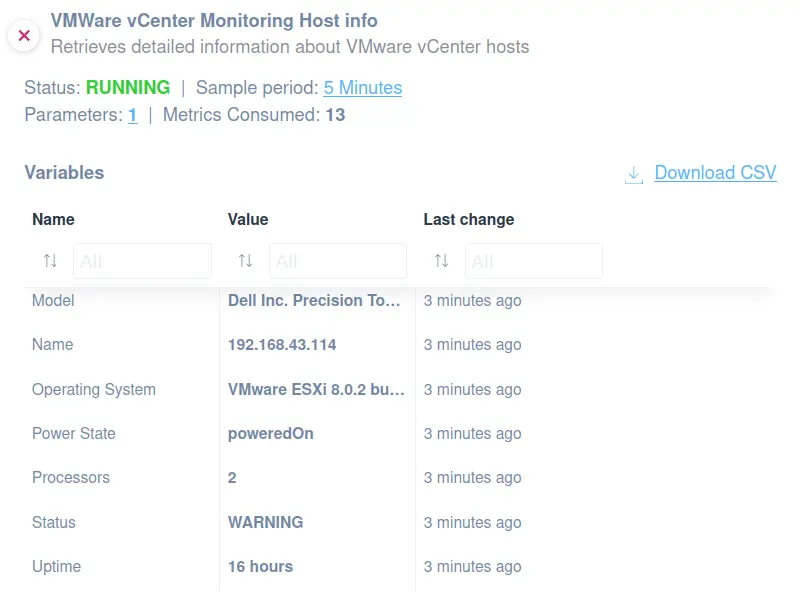
VMware vCenter Monitoring Host Information
1. Overview section displays the status as "Running" and provides details such as a sample period of 5 minutes, 1 parameter, and 13 metrics consumed.
2. Click "Download CSV" to export the data.
3. The "Variables" table lists information in three columns: "Name," "Value," and "Last change."
4. Key entries include:
- Model: Dell Inc. Precision Tower.
- Name: 192.168.43.114.
- Operating System: VMware ESXi 8.0.2 build.
- Power State: poweredOn.
- Processors: 2.
- Status: WARNING.
- Uptime: 16 hours.
5. The "Last change" column indicates all entries were last updated about 3 minutes ago.
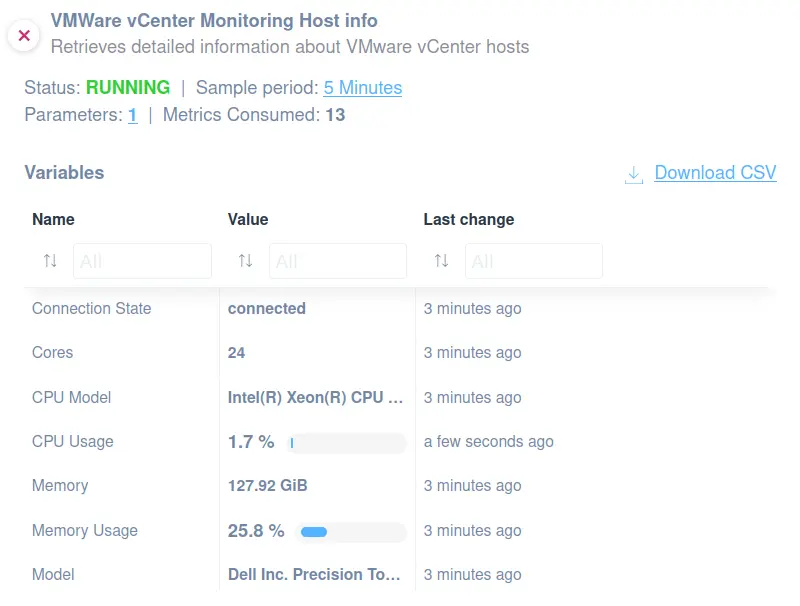
VMware vCenter Monitoring Host Information Screen
1. Title: Indicates that detailed information about VMware vCenter hosts is being retrieved.
2. Status: The current status is "RUNNING." The sample period is set to "5 Minutes." Parameters and metrics consumed are noted with values of 1 and 13 respectively.
3. Download Option: A "Download CSV" link is available for exporting the data.
4. Variables Section:
- "Connection State" is shown as "connected," indicating active status.
- "Cores" display the value "24."
- "CPU Model" lists "Intel(R) Xeon(R) CPU..."
- "CPU Usage" is at "1.7%," updated a few seconds ago.
- "Memory" shows "127.92 GiB."
- "Memory Usage" is at "25.8%," with a progress bar indicating usage.
- "Model" specifies "Dell Inc. Precision T..."
Each variable includes the time of the last change, showing when the data was last updated.
VMware Virtual Machine vCenter VM Snapshots
This script allows monitoring of the following variables about the last VM snapshot:
- Name
- Description
- Creation time
- Age in days
- ID
The script uses HTTP protocol and has been validated and tested on VMware vCenter 8.0.2.
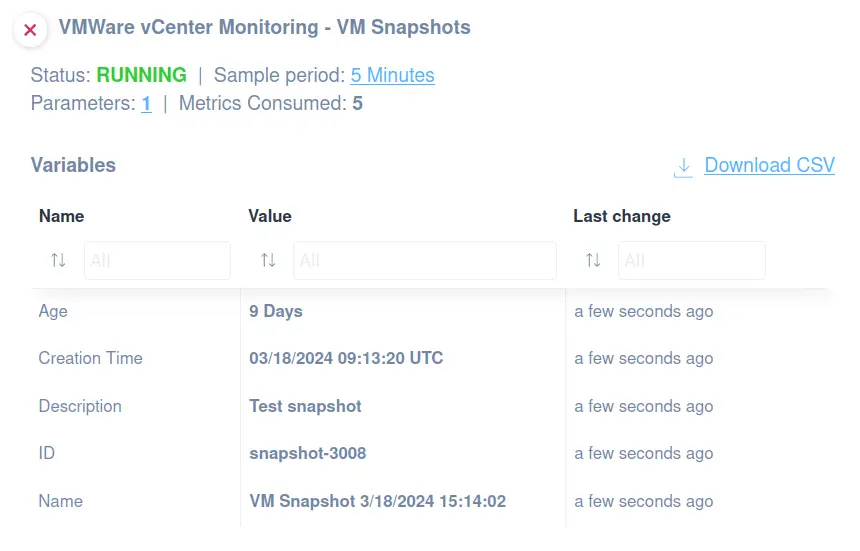
VMware vCenter Monitoring Snapshot Details
1. The monitoring status is shown as "RUNNING."
2. The sample period is set to 5 minutes.
3. There is 1 parameter and 5 metrics consumed.
4. A "Download CSV" option is available.
5. Under "Variables," details include:
- Age: 9 Days
- Creation Time: 03/18/2024 09:13:20 UTC
- Description: Test snapshot
- ID: snapshot-3008
- Name: VM Snapshot 3/18/2024 15:14:02
6. The "Last change" indicates updates occurred "a few seconds ago."
Windows OS Monitoring
Use the new following custom scripts to optimize your Windows OS monitoring:
- OS General Monitoring
- CPU and Memory
- Physical Disks
- Logical Disks
- Failed logon
Windows OS General Monitoring
The following information can be monitored by applying the script:
- OS Name
- Version
- Build Number
- Architecture
- Device Serial Number
- Vendor
- OS Product ID
This script and the following Windows-related scripts use WinRM protocol and have been validated and tested on Windows 11.
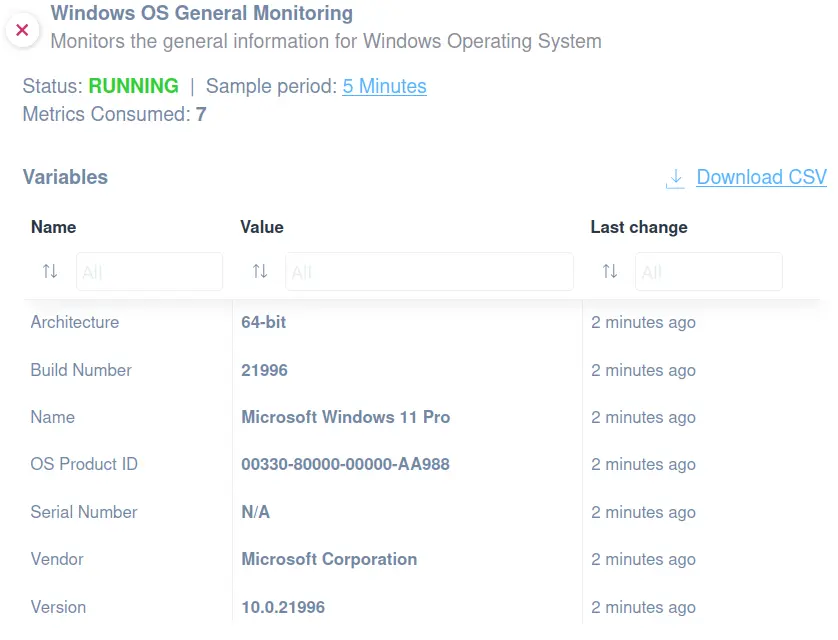
Windows OS Monitoring Dashboard Summary
1. The dashboard monitors general information for the Windows Operating System.
2. The status is displayed as "RUNNING" in green, indicating it's active. The sample period is set to "5 Minutes" and "Metrics Consumed" shows a value of 7.
3. Under the "Variables" section, data is divided into three columns: Name, Value, and Last change.
4. Key information includes:
- Architecture: 64-bit
- Build Number: 21996
- Name: Microsoft Windows 11 Pro
- OS Product ID: 00330-80000-00000-AA988
- Serial Number: N/A
- Vendor: Microsoft Corporation
- Version: 10.0.21996
5. "Last change" for all entries was "2 minutes ago."
6. An option to "Download CSV" is available for exporting the data.
CPU and Memory Usage
You will have more information about the following:
- Total Memory
- Available Memory
- Memory Usage
- CPU Name
- CPU max clock speed
- Logical processors number
- CoresNumber
- CPU Status
- CPU Usage
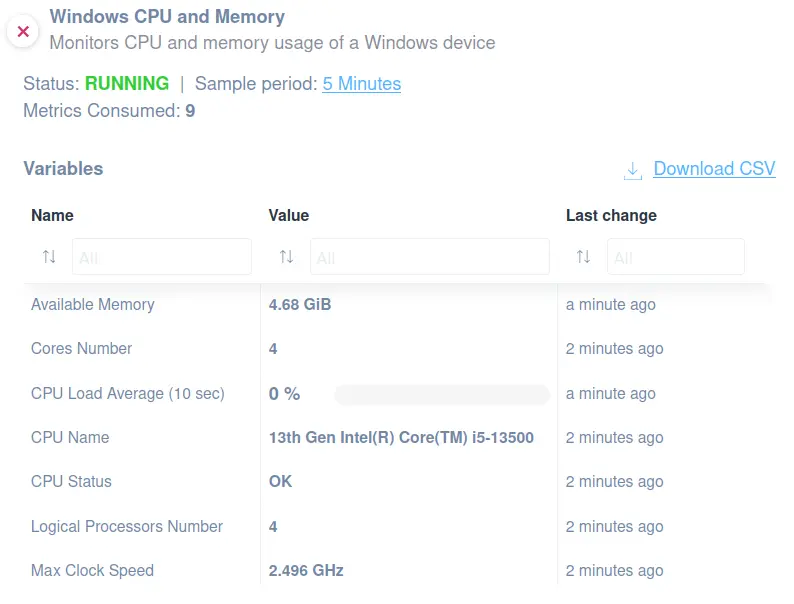
Monitoring Windows CPU and Memory Usage
1. The monitoring tool is active, indicated by the "Status: RUNNING" label.
2. The sample period for data collection is every 5 minutes.
3. The system currently uses 9 metrics.
4. Variables displayed include:
- Available Memory: 4.68 GiB
- Cores Number: 4
- CPU Load Average (10 sec): 0%
- CPU Name: 13th Gen Intel(R) Core(TM) i5-13500
- CPU Status: OK
- Logical Processors Number: 4
- Max Clock Speed: 2.496 GHz
5. Each variable has a timestamp for the last update, ranging from 1 to 2 minutes ago.
6. A "Download CSV" option is available for exporting the data.
Physical Disks
The script enables you to monitor the following:
- ID
- Model
- Status
- Size
- Media Type
- Serial Number
- Partitions Number
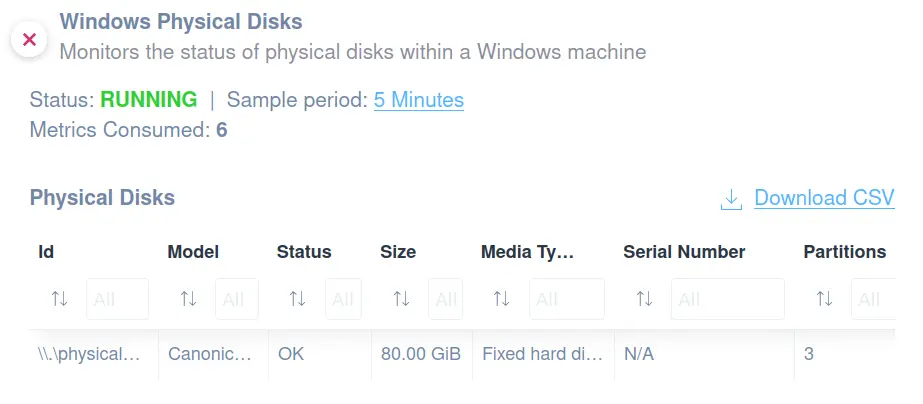
Monitoring Windows Physical Disks
1. The section monitors the status of physical disks within a Windows machine.
2. Displays the status as "RUNNING" and indicates a sample period of 5 minutes, with 6 metrics consumed.
3. Provides information under "Physical Disks," with columns for Id, Model, Status, Size, Media Type, Serial Number, and Partitions.
4. Example entry: Id shows a physical location, Model is "Canonical...," Status is "OK," Size is "80.00 GiB," Media Type is "Fixed hard disk," Serial Number is "N/A," and Partitions count is "3."
5. Offers a link to download the data as a CSV file.
Logical Disks
Applying the Windows Logical disks script, you will be able to monitor the following:
- Drive Letter
- Name
- Physical Disk ID
- Usage
- Free Space
- Size
- File System
- Type
- Is Read-only
- Bitlocker Status
- Bitlocker Protection Status
- Bitlocker Encryption Percentage
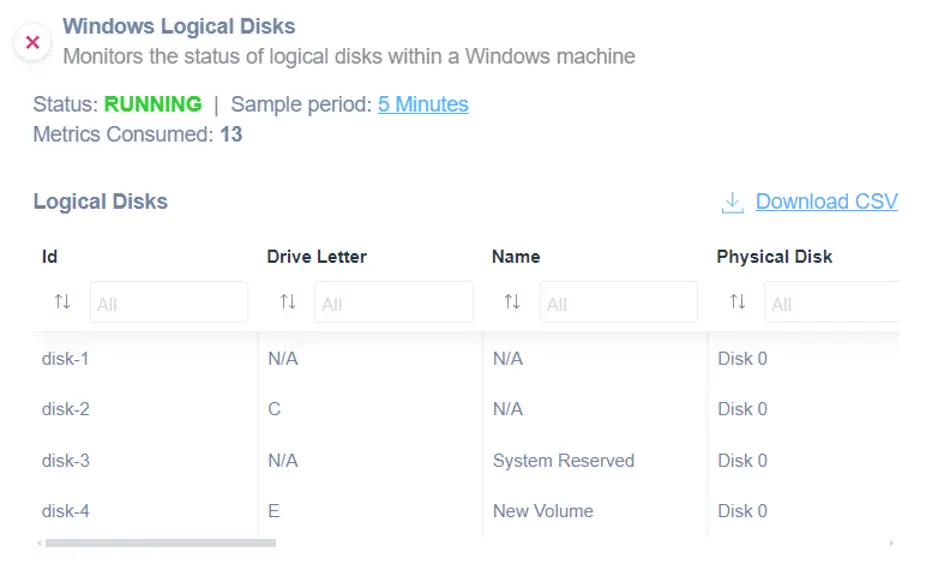
Monitoring Windows Logical Disks Status
1. The system status is "RUNNING," with a sample period of 5 minutes and 13 metrics consumed.
2. A table lists logical disks with columns for ID, Drive Letter, Name, and Physical Disk.
3. Disk IDs include "disk-1" to "disk-4." Their drive letters are shown as "N/A," "C," "N/A," and "E."
4. Disk names are "N/A," "System Reserved," and "New Volume."
5. All disks are associated with "Disk 0" under the Physical Disk column.
6. A "Download CSV" link is available to download the table data.
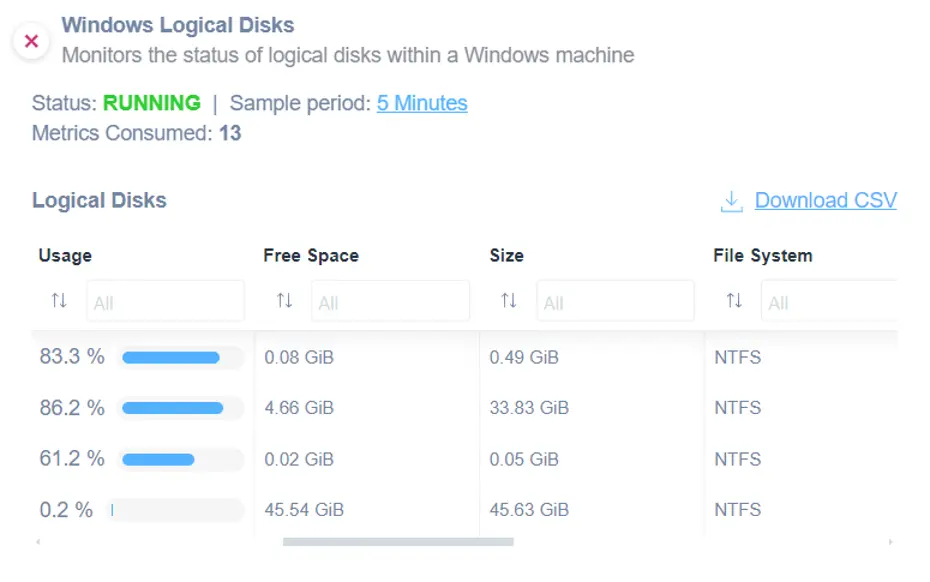
Windows Logical Disks Monitoring Overview.
1. Displays the status of logical disks on a Windows machine, currently marked as "RUNNING."
2. Indicates a sample period of 5 minutes and shows 13 metrics consumed.
3. Lists logical disks with columns for Usage, Free Space, Size, and File System.
4. Usage percentages vary, with examples shown as 83.3%, 86.2%, 61.2%, and 0.2%.
5. Free space is displayed in GiB, e.g., 0.08 GiB, 4.66 GiB.
6. Size column lists total disk size, such as 0.49 GiB, 33.83 GiB.
7. File System column specifies NTFS for each disk.
8. Provides an option to download the data as a CSV file.
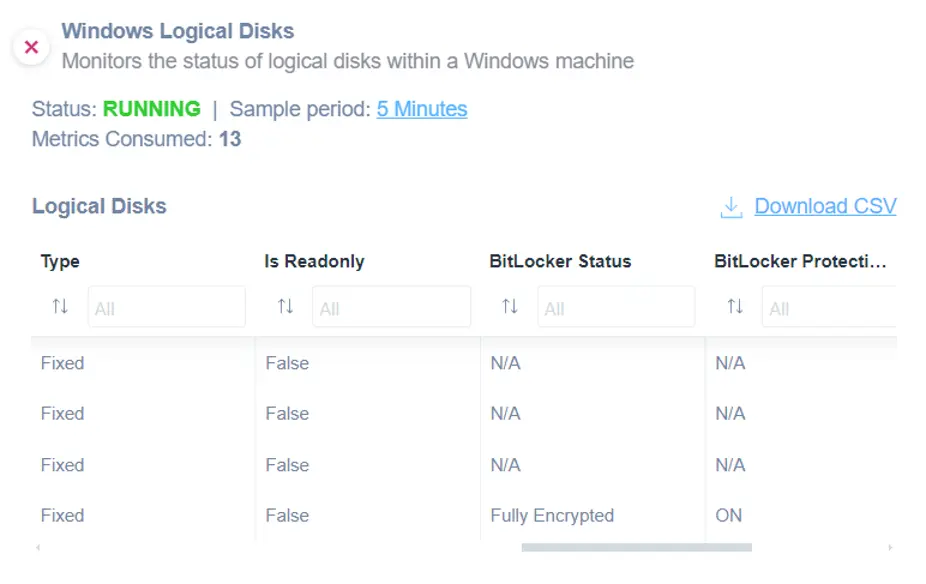
Windows Logical Disks Monitoring Interface
1. The interface is titled "Windows Logical Disks" and is used for monitoring the status of logical disks in a Windows machine.
2. Current status of the monitoring tool is "RUNNING".
3. The sample period is set to "5 Minutes", and "Metrics Consumed" is indicated as 13.
4. A table titled "Logical Disks" lists the details of various disks.
5. Column headers include "Type", "Is Readonly", "BitLocker Status", and "BitLocker Protection".
6. The "Type" column shows all disks as "Fixed".
7. The "Is Readonly" column indicates "False" for all entries, implying none of the disks are read-only.
8. The "BitLocker Status" column has "N/A" for several entries and "Fully Encrypted" for one disk.
9. "BitLocker Protection" displays "N/A" for several entries and "ON" for one corresponding to the "Fully Encrypted" status.
10. An option to "Download CSV" is available for exporting the data.
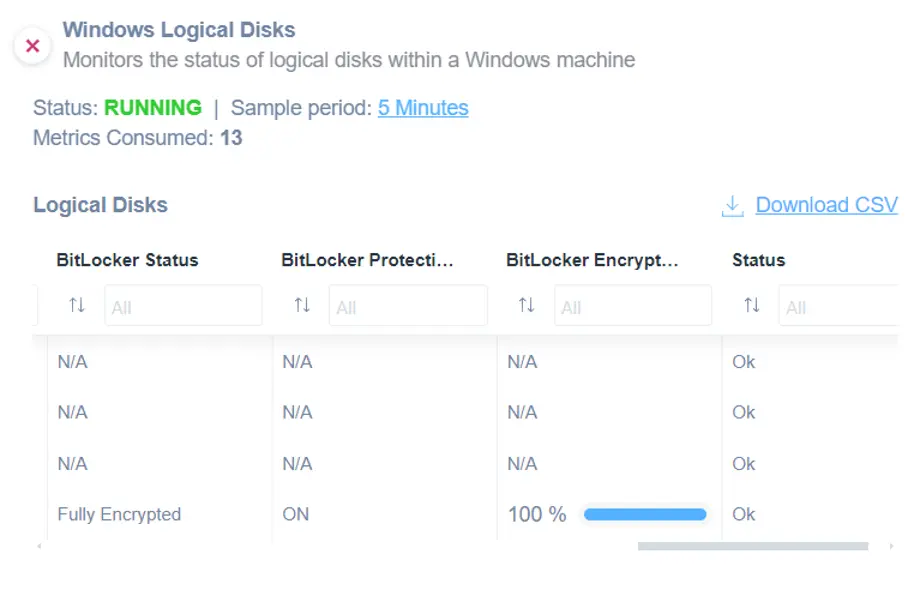
Monitoring the Status of Logical Disks
1. The monitor is titled "Windows Logical Disks" and checks the status of logical disks on a Windows machine.
2. The current status is shown as "RUNNING," indicating active monitoring.
3. The sample period is every 5 minutes.
4. Thirteen metrics have been consumed for analysis.
5. Under "Logical Disks," details include columns for BitLocker Status, BitLocker Protection, BitLocker Encryption, and Status.
6. Rows display different disks with values such as "N/A" or "Fully Encrypted" under BitLocker Status, and encryption percentages with a progress bar under BitLocker Encryption.
7. The general status is marked as "Ok" for each disk.
8. A "Download CSV" option is available for exporting data.
Failed logon
You can monitor the following information considering the last N hours, where N can be passed as a parameter:
- Total number of failed logs
- Number of failed logons grouped by user name
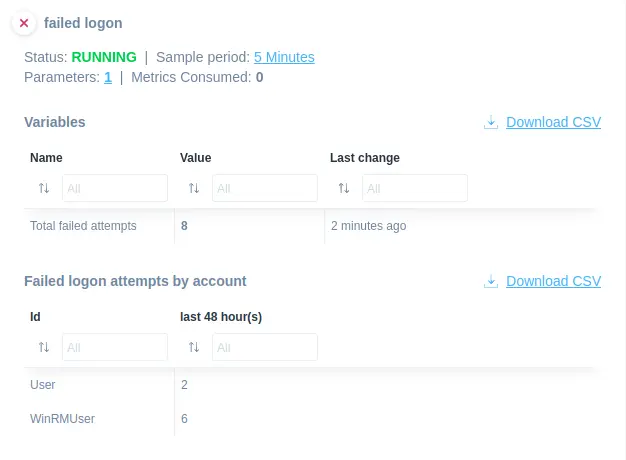
Overview of Failed Logon Attempts Dashboard
1. The dashboard displays the status as "Running" with a sample period of 5 minutes, indicating real-time monitoring of failed logon attempts.
2. The "Variables" section shows "Total failed attempts" with a value of 8, updated 2 minutes ago.
3. The "Failed logon attempts by account" section lists attempts over the last 48 hours. "User" has 2 failed attempts, while "WinRMUser" has 6.
4. Options are available to download this data as a CSV file.
BluOS Monitoring
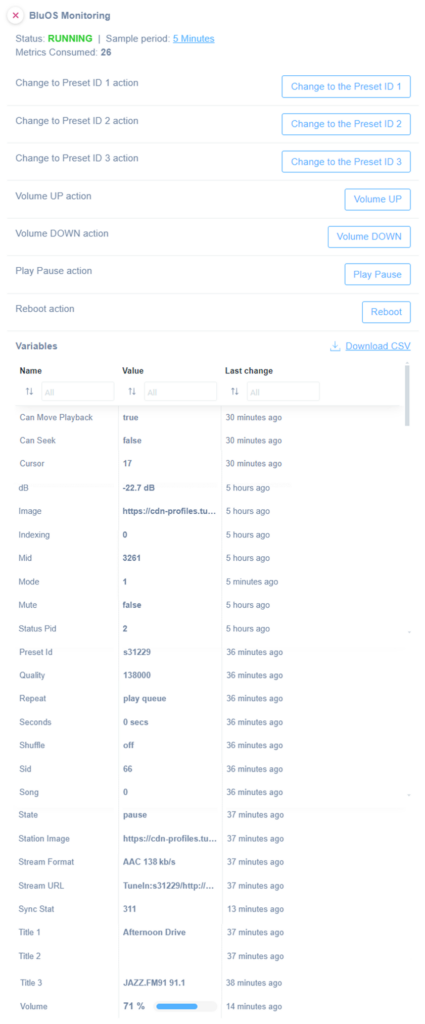
Take advantage of Domotz and BluOS working together to proactively monitor, control, and remotely manage BluOS amplifiers. Easily apply this script to retrieve information about BluOS devices and execute specific actions on them.
BluOS Monitoring Interface Overview
1. **Status and Sample Period**: The status is indicated as "RUNNING" with a sample period of 5 minutes. Metrics consumed number is 26.
2. **Preset Actions**: The interface provides buttons to change to three preset IDs labeled "Change to the Preset ID 1", "Change to the Preset ID 2", and "Change to the Preset ID 3".
3. **Volume and Playback Controls**: Buttons are available for "Volume UP", "Volume DOWN", and "Play Pause". There is also a "Reboot" button.
4. **Data Section**: Below, there's a section titled "Variables" with options to download a CSV file. There are columns for Name, Value, and Last Change, listing various settings and their last modification times, such as playback ability, cursor position, volume level, and station information.
You can get access to the following information:
- Title 1
- Title 2
- Title 3
- Image – URL of the image associated with the current audio (album, station, input, etc.)
- Station image
- Stream format
- Stream URL
- Quality
- State
- Seconds – the number of seconds the current audio track has been played
- Volume percentage
- dB – volume level in dB
- Mute
- Shuffle mode
- Repeat mode
- Song – position of the current track in the play queue
- Can move playback – if it is possible to move the current playing or paused content to another player
- Can seek -if it is possible to scrub through the current track
- Mode
- Cursor
- Indexing
- Mid
- Status Pid
- Preset Id
- Sid
- Sync Stat
The following actions can be executed on a BluOS device:
- Change to the preset ID 1
- Change to the preset ID 2
- Change to the preset ID 3
- Volume up
- Volume down
- Play/pause
- Reboot
Improvements
Improve Network Topology connections for devices monitored through a Layer3 scan, for which their MAC address is now discovered via additional protocols
With improved discovery of MAC addresses through additional protocols (like SNMP, when available), this enhancement offers a more accurate and detailed network topology. It aids in identifying how devices are interconnected, especially in complex networks, enhancing visibility and control over the network structure.
Merge Network Traffic (Extended) and Network Traffic SNMP Template
This improvement combines two key network traffic monitoring possibilities into a more powerful template. It simplifies your monitoring section interface while providing a comprehensive view of network traffic, making it easier to analyze and manage network performance.
Rely on Domotz Cloud to calculate the Public IP address of the Agent
The following enhancement improves accuracy and reliability in determining an agent’s IP address. It streamlines network setup and maintenance, ensuring seamless connectivity and monitoring.
Disable IP conflict detection on broadcast network addresses
This update enhances network stability by disabling IP-conflict detection on broadcast addresses, reducing false positives and unnecessary alerts. It ensures that network administrators can focus on genuine issues, improving overall network management efficiency.
Domotz is committed to continuously improving its IT Infrastructure monitoring and management solution for IT professionals, Managed Service Providers, and Commercial Integrators.
Prevent NodeJS 0.10 Network Collectors to use Integration Scripts
In conclusion, we want to specify that Domotz will no longer support the integration scripts that run on node js 0.10.
Updated our Terms and Conditions and Privacy Policy
MIB
Add support for LSI-MegaRAID-SAS-MIB
We add support for LSI-MegaRAID-SAS-MIB. You can now monitor and manage devices using this widely used storage interface.
Fixes
- Fix the issue on the Devices Interfaces tab, not collecting traffic information with the right periodicity
- The “Configuration Management” tab on Device Detail was not visible until when selecting a tab
- The Configuration Management feature did not display a Configuration Misalignment in the ‘diff’ view
- Fix on Configuration Management: It cannot upload an archive backup if there are no configuration backups saved
- Purchasing or removing booster packs did not immediately update the limits
- Prevent false positive heartbeat lost events in some network edge cases (DHCPDISCOVER packets arrived while device discovery was in progress)
- Configuration backup for HP Aruba saves incomplete configurations in the backup file
- Fix the Network Troubleshooting dashboard displaying inconsistent IP Conflict data and IP Conflicts on not existing MAC Addresses
- New Windows Collector crashing when the SpeedTest is executed
- The alerts tab on Device Detail was not properly updated after importing a configuration containing an SNMP sensor trigger
- Manage Booster Packs when having more than 300 Collectors
- Fix on Configuration Management: Unlocking the Aruba OS switch results in a timeout
- Improve FortiGate integration timing out for some devices
- Fix for Contact Channels and Ticketing Systems not being displayed correctly
- Improve error handling for Documentation System integrations
- Fix IT Glue integration not accepting API key for “.com” and “.au” domains and losing mapping for Agents and Devices
- Fix Public API returning 503 when fetching Devices variables
- Fix the table detach option on the Monitoring Dashboard. The detached table was being closed when moving between Dashboards
- Improved percentage metrics rounding
- Fix link to Metrics Help Page
- Device Settings and Property import failed when SNMP OID triggers were selected
- Device Discovery via DHCP option was creating new devices from blocked interfaces; due to incompatibility reasons, Device Discovery via DHCP will be automatically turned off when one or more interfaces are blocked via Public API
- Improved Aruba device identification for Configuration Management
- Fix an issue that was preventing concurrent Scripts from running on devices
- Packet Loss history chart on Network Troubleshooting was not showing the chart line if all samples had 0 values
- Possibility to remove all emails from the IP Conflict monitoring profile
- Add a missing loader on the device detail SNMP view so that it is now clear if some SNMP templates are configured and are being loaded
- Fix the UI issue on the Monitoring Tables buttons appearing under the cell badges