We’re excited to announce the newest round of updates and additions to Domotz. This month, we’re rolling out a new Domotz collector on NETGEAR routers, extended port mapping for Ubiquiti controllers, new integration scripts, improved connectivity issue resolution, and configuration management.
We highly value your feedback and encourage you to contact our support team at support@domotz.com for any comments, questions, or suggestions you may have.
New Features
Domotz collector on NETGEAR routers
We’re thrilled to announce an update to our services: the extension of our collector’s compatibility to now include NETGEAR routers and the enhancement of VLAN interface monitoring. This update broadens the array of network devices that can leverage Domotz’s robust monitoring and management capabilities, enabling you to gain greater control and insight over your network infrastructure. With the improved VLAN interface monitoring, we’re ensuring a more efficient and detailed oversight of your network’s performance and security, focusing on the critical segments that matter most.
NETGEAR Routers Compatibility: The Domotz Network Collector/Agent can seamlessly integrate with NETGEAR Router models. This expansion broadens the spectrum of network devices that benefit from Domotz’s advanced monitoring and management capabilities, offering you more flexibility and control over your network infrastructure.
VLAN Interface Scanning: Domotz has introduced the option to scan VLAN interfaces by default on NETGEAR Routers to enhance network monitoring efficiency further. This targeted approach ensures critical network segments are monitored more effectively, providing you with detailed insights into your network’s performance and security posture.
Enhanced Ubiquiti Controller Support
We have enhanced the support for Ubiquiti controllers within the Domotz platform.
This update introduces an extension of IP-based port mapping for Ubiquiti devices, significantly improving network topology visualization and management. With this advanced functionality, Domotz now adeptly maps Ubiquiti devices even when the MAC address is unavailable, such as when devices are visible on routed networks (Layer 3) but not on Layer 2.
This development ensures more accurate network topology representations and gives deeper insights into IT infrastructures, especially in complex network environments.
New Integration Scripts
VMware vCenter Monitoring
Take advantage of our new pre-configured integration scripts:
- VM Info
- VM List
- VM Disks
- VM Network Adapters
- VCenter Host List
- VCenter General Info
- VCenter System Health
- VCenter Datastore
- VCenter Services Health
These scripts have been validated and tested on VMware vCenter 7.0.3 and use HTTPS protocol. Find them in our library or customize them to fit your needs.
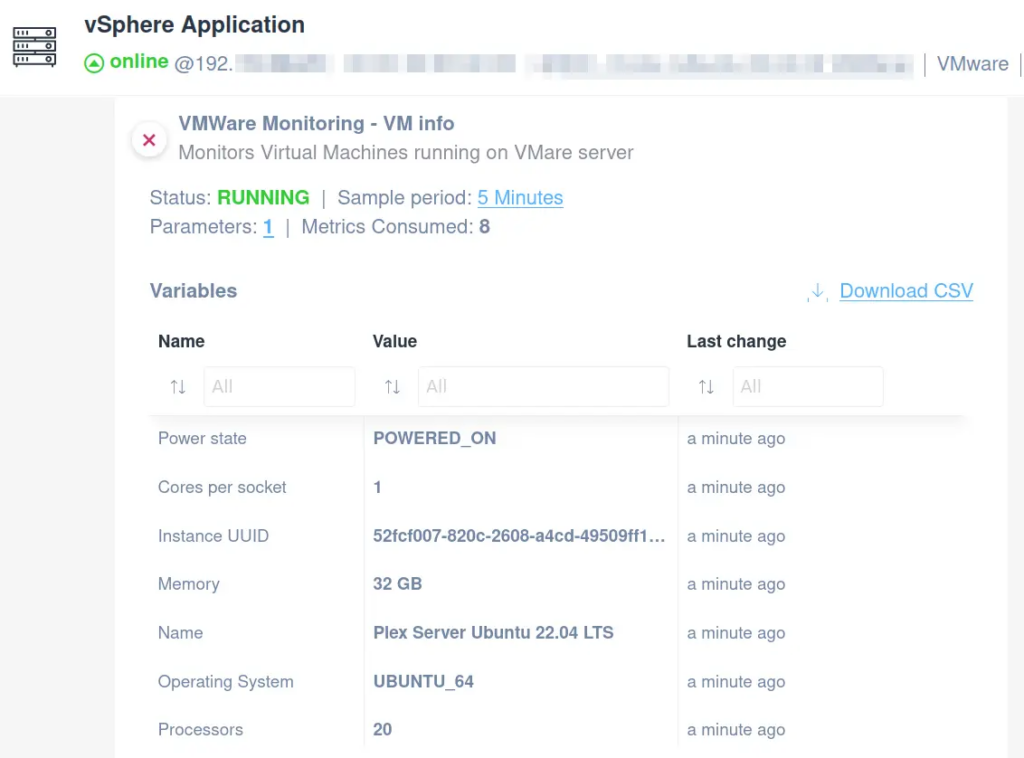
VM Info
Use this script to monitor the following VM info running on VMware vCenter.
You’ll be able to retrieve information about these variables:
- Name
- Instance UUID
- Operating System
- Memory
- Processors
- Cores per socket
- Version
- Power state
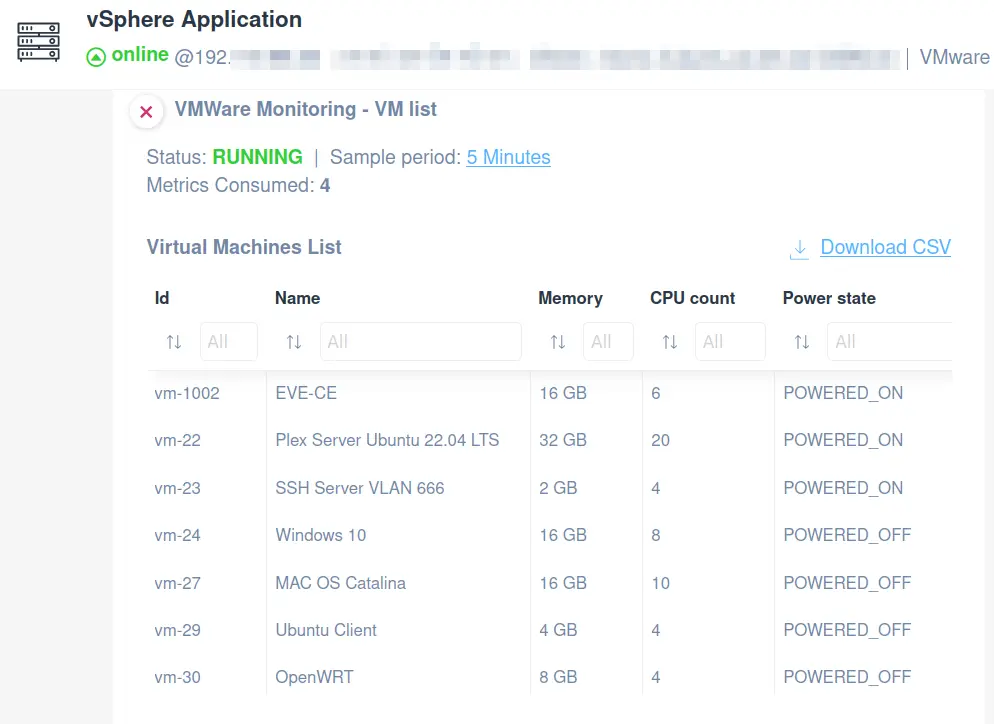
VM List
Easily apply the script in order to monitor the VMs running on VMWare vCenter and the following:
- VM ID
- Name
- Memory
- CPU count
- Power state
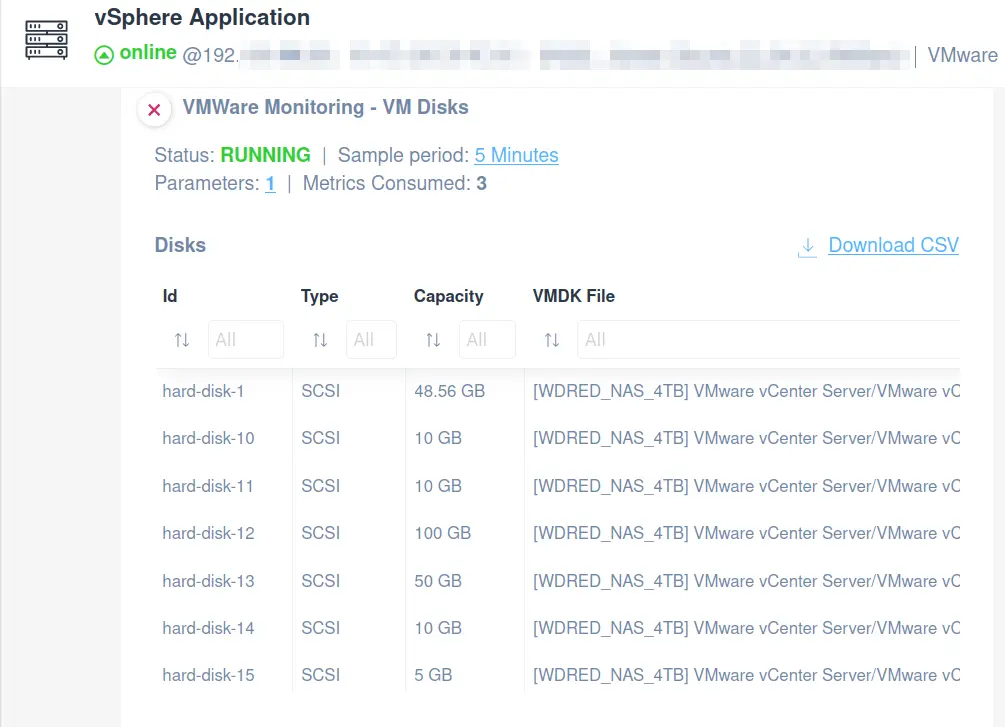
VM Disks
Use our dedicated script to monitor the disks connected to each VM running on VMware vCenter and the following:
- Disk ID
- Type
- Capacity
- VMDK file
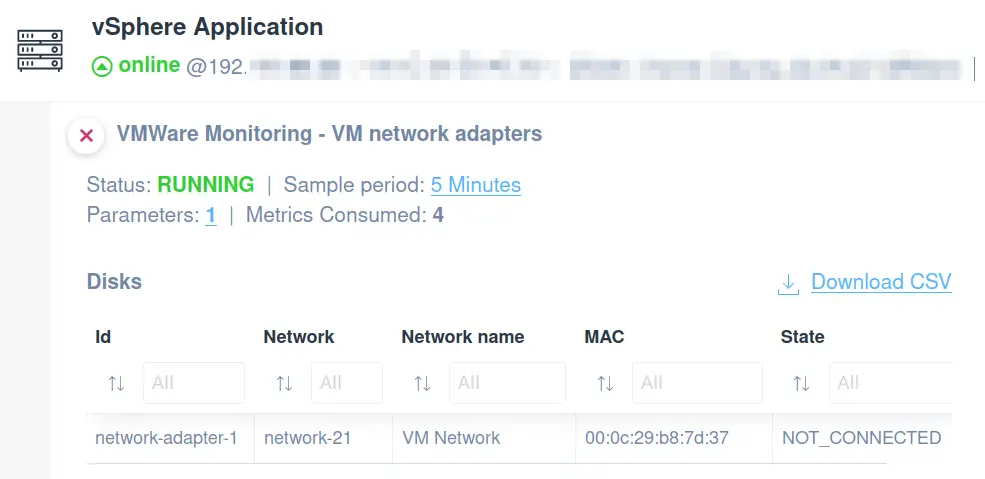
VM Network Adapters
This script allows you to monitor several key aspects of network adapters, including:
- Network adapter ID
- Network
- Network name
- MAC address
- State
By implementing this script, you can ensure comprehensive monitoring of your VMs’ network adapters, aiding in network management and troubleshooting within your VMware vCenter environment.
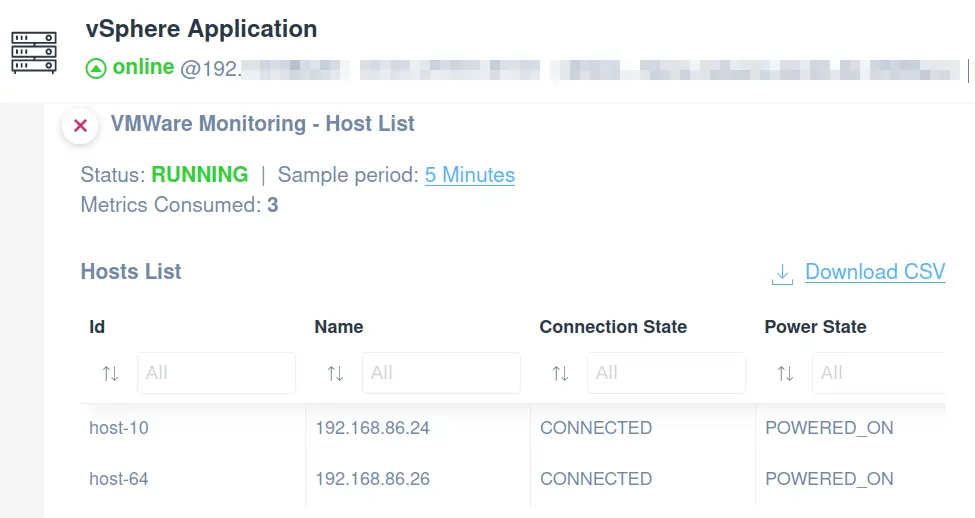
vCenter Host List
You can monitor the hosts managed by VMWare vCenter and the following metrics:
- Host ID
- Name
- Connection state
- Power state
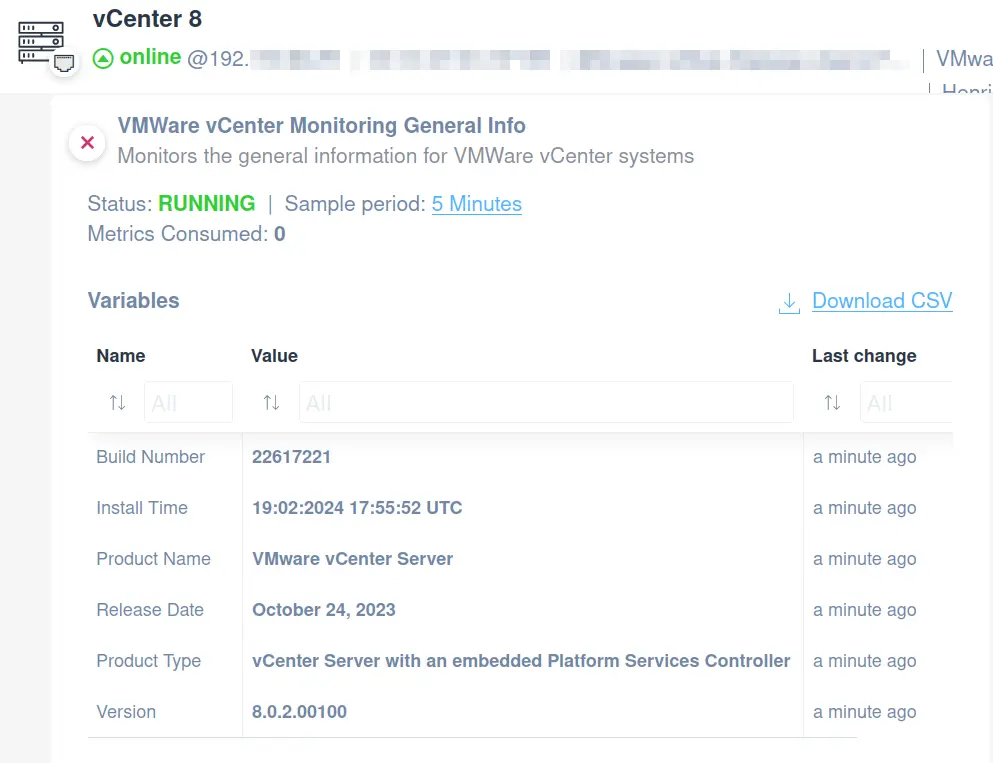
vCenter General Info
Applying our ready-to-use integration script, you will be able to monitor VMWare vCenter and the following:
- Product name
- Product type
- Version
- Build number
- Release date
- Install time
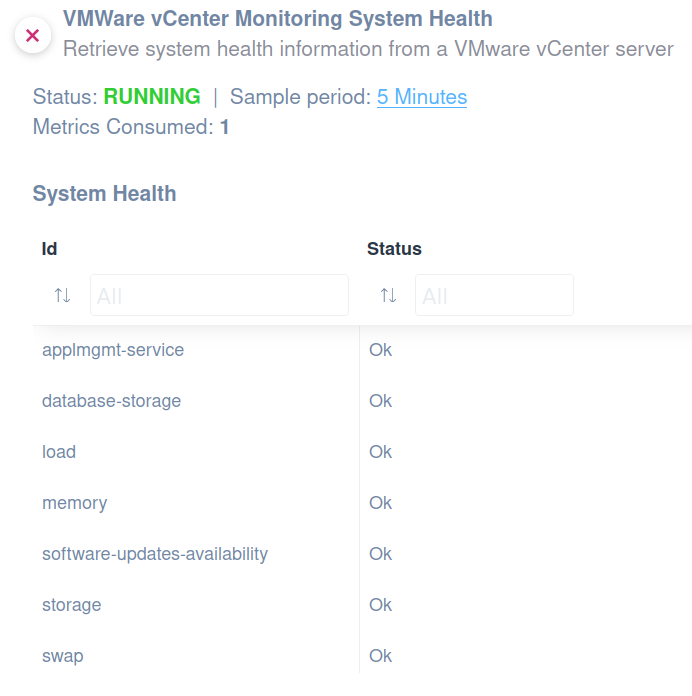
vCenter System Health
This script enables you to gather a detailed view of the health status of your VMware vCenter.
The following can be monitored:
- System Health
- Load
- Memory health
- Appliance Management Service Health
- Storage health
- Swap health
- Database storage health
- Software updates availability
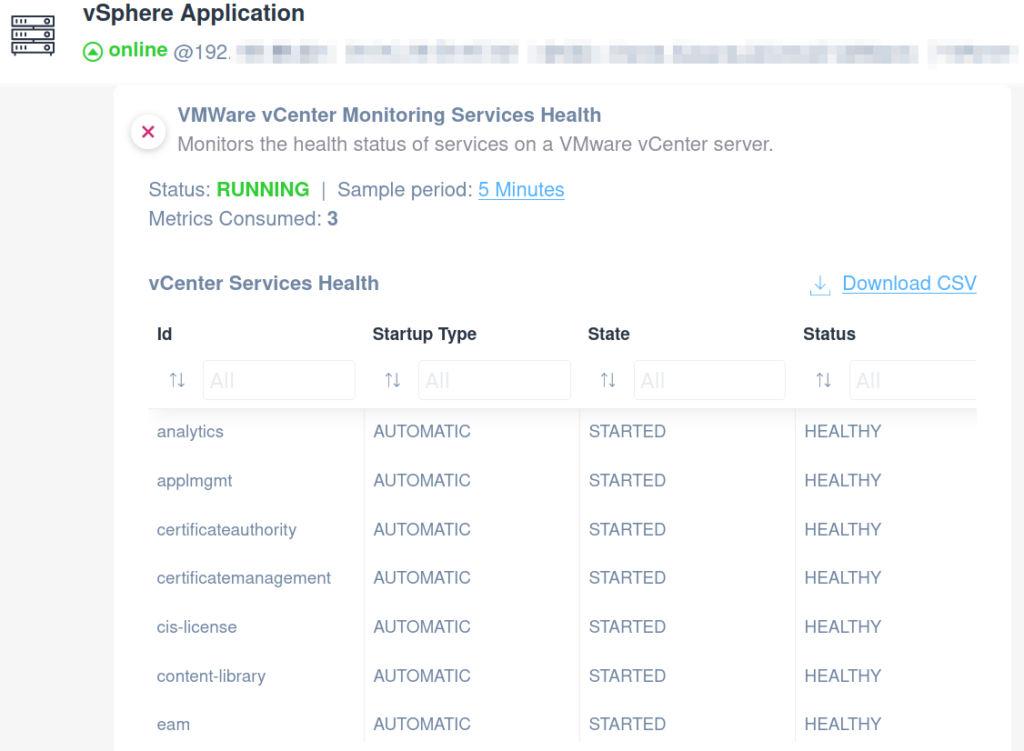
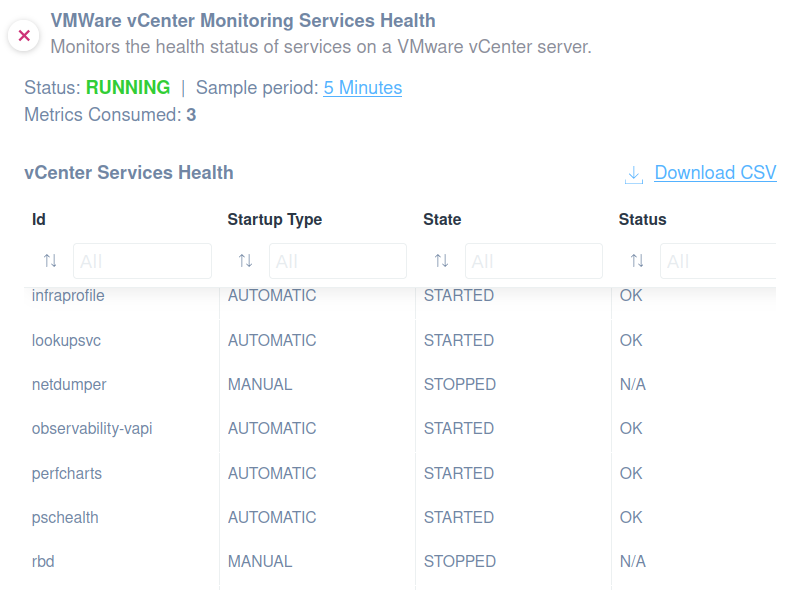
vCenter Services Health
By applying this script, you will immediately have more details and monitor the following:
- Service name
- Startup Type
- State
- Status
You can access this script from our library.
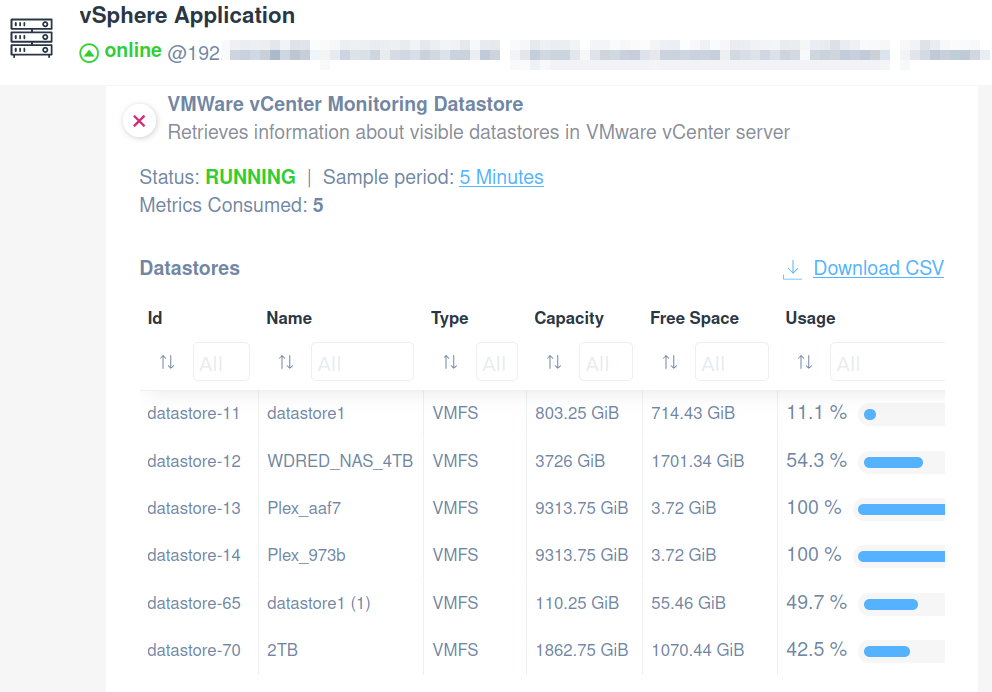
vCenter Datastore
By implementing this script, you will be able to monitor free space in your VMware vCenter Datastores. The following can be monitored:
- Datastore ID
- Name
- Type
- Capacity
- Free space
- % usage
Please note that this script has been validated and tested on VMware vCenter 8.0.2.
HPE MSA SAN
Domotz network monitoring software allows you to monitor HPE MSA Storage Area Network (SAN), a flash-ready system designed for affordable application acceleration and is ideal for remote office deployments.
Monitor your HPE MSA SAN hardware using our custom scripts:
- System General Information
- Overall unit status
- HW Sensors – Temperature
- HW Sensors – Charge
- HW Sensors – Voltage/Current
- Fans
- Controllers
- Disks
These scripts use the HTTP protocol and have been validated and tested on HPE MSA 2050 SAN version VL270P005.
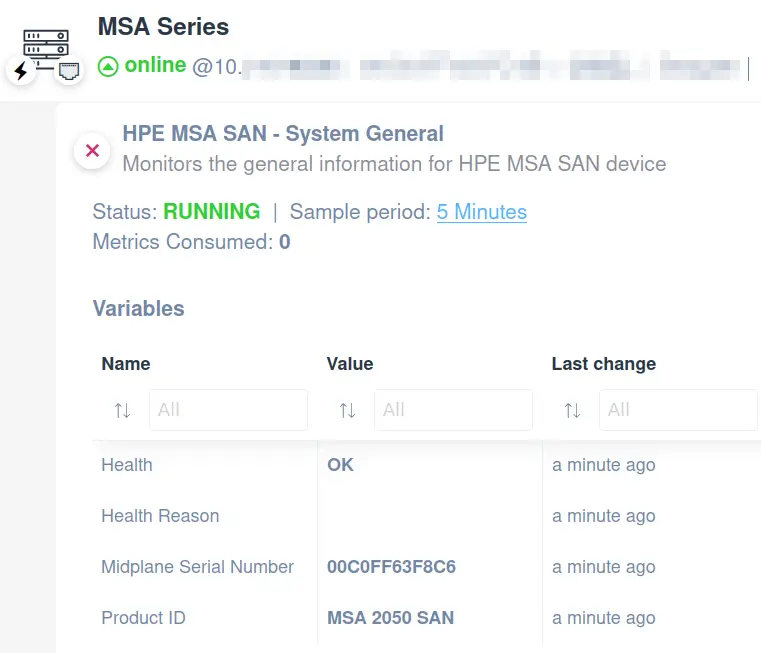
System General Information
Consider leveraging our System General Info custom script to keep tabs on the key aspects of your HPE MSA SAN. Key metrics you can monitor include:
- Product ID
- Midplane serial number
- Health
- Health reason
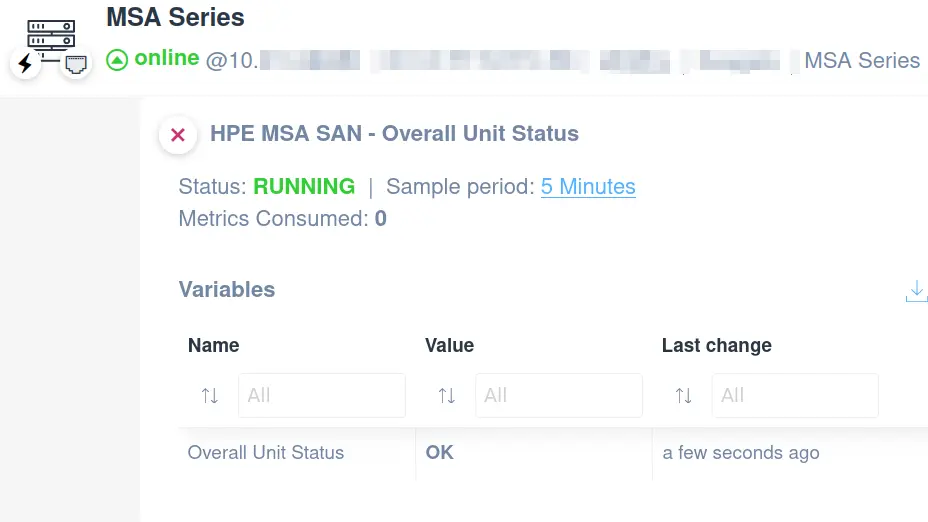
Overall unit status
This script allows you to monitor the overall unit status of an HPE MSA SAN.
Find this script and more in our library. Use them as they are, or personalize them according to your requirements. Easily monitor the overall unit status for HPE MSA SAN through HPE MSA API.
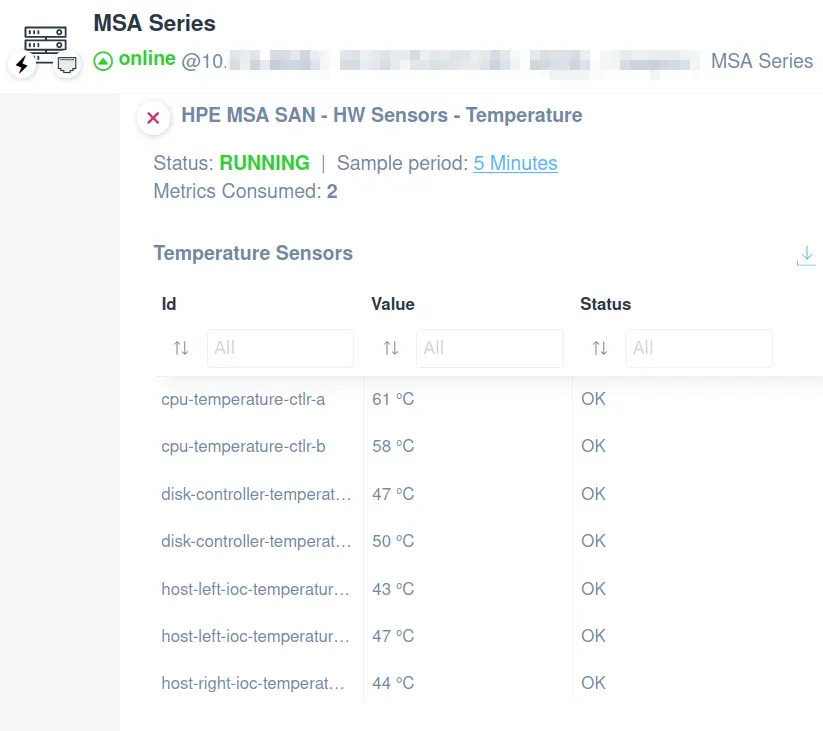
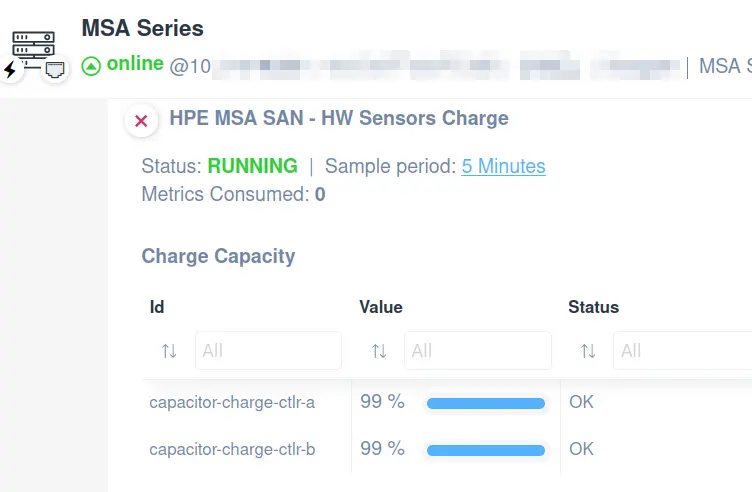
HW Sensors – Temperature and Charge
These two scripts are designed to provide detailed insights into:
- Sensor name (ID)
- Value
- Status
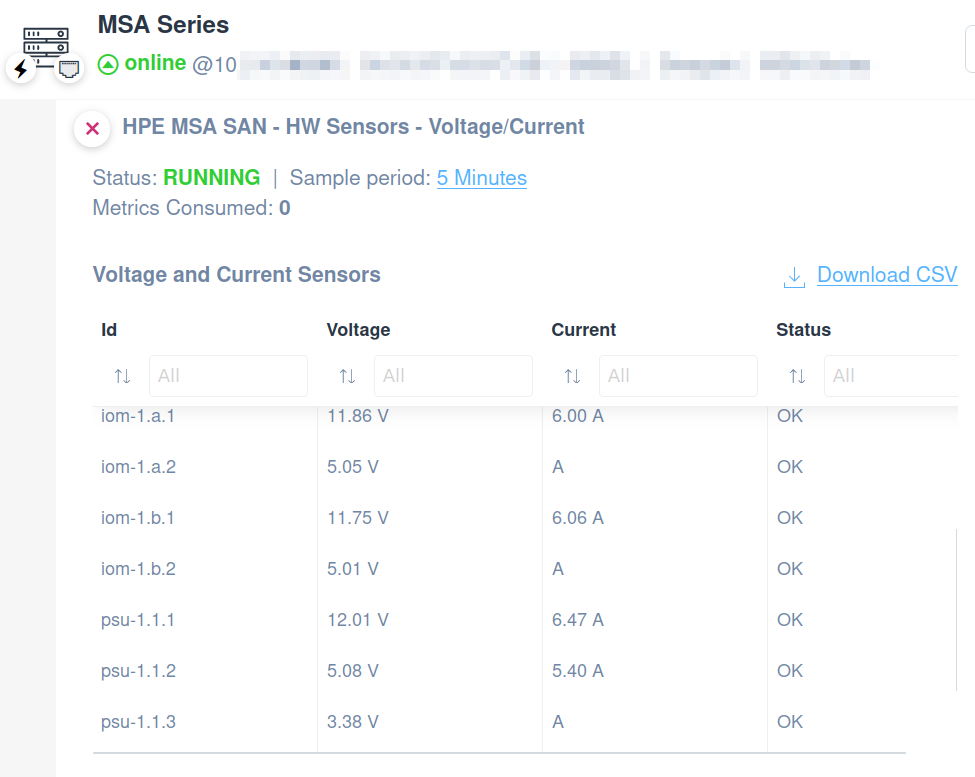
HW Sensors – Voltage/Current
Applying this script, you will be able to monitor the following:
- Sensor name (ID)
- Voltage
- Current
- Status
The script has been validated and tested on HPE MSA 2050 SAN version VL270P005.
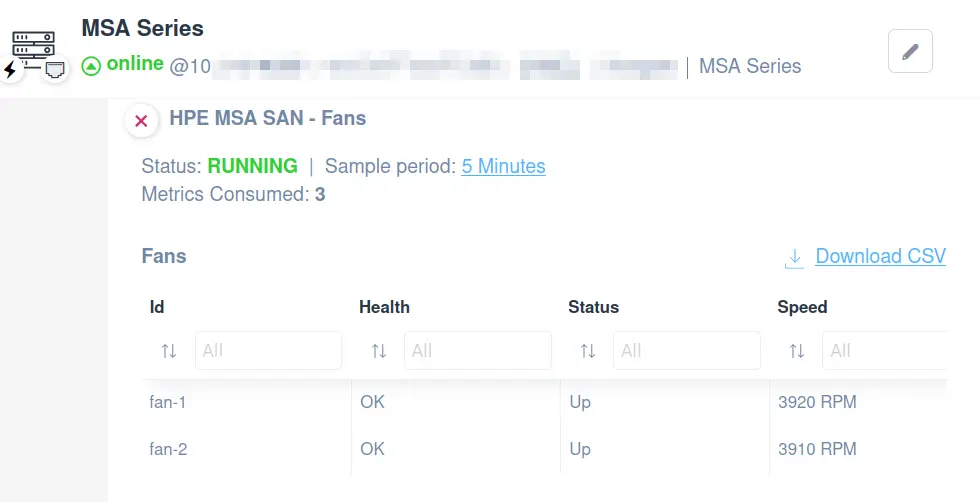
Fans
This script is designed to allow you to monitor key aspects of fan operation, ensuring your system remains cool and functions optimally.
With this script, you can track:
- Fan name (ID)
- Health status
- Fan status
- Speed
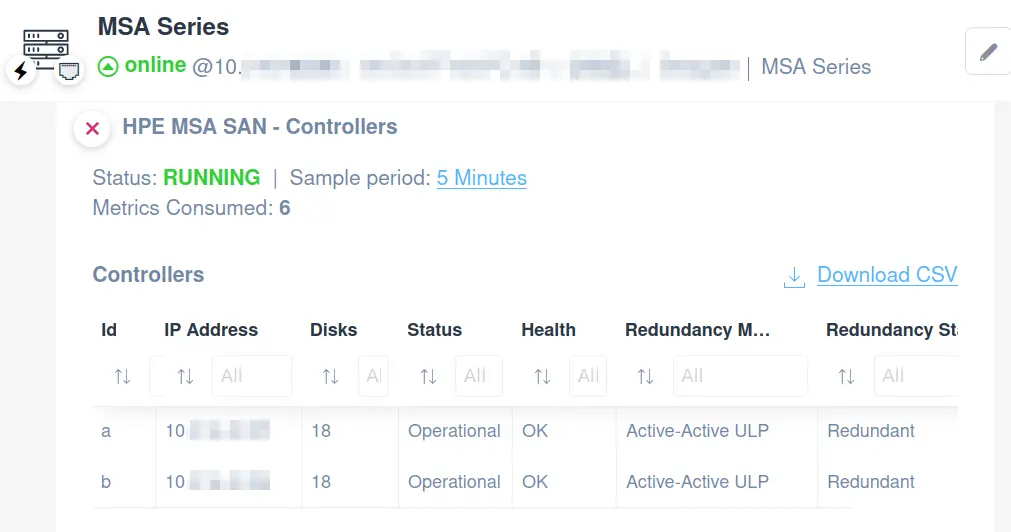
Controllers
Rely on our script to monitor the status of each controller in an HPE MSA SAN server. You’ll be able to monitor the following:
- Controller ID
- IP address
- Disks
- Controller status
- Health status
- Redundancy mode
- Redundancy status
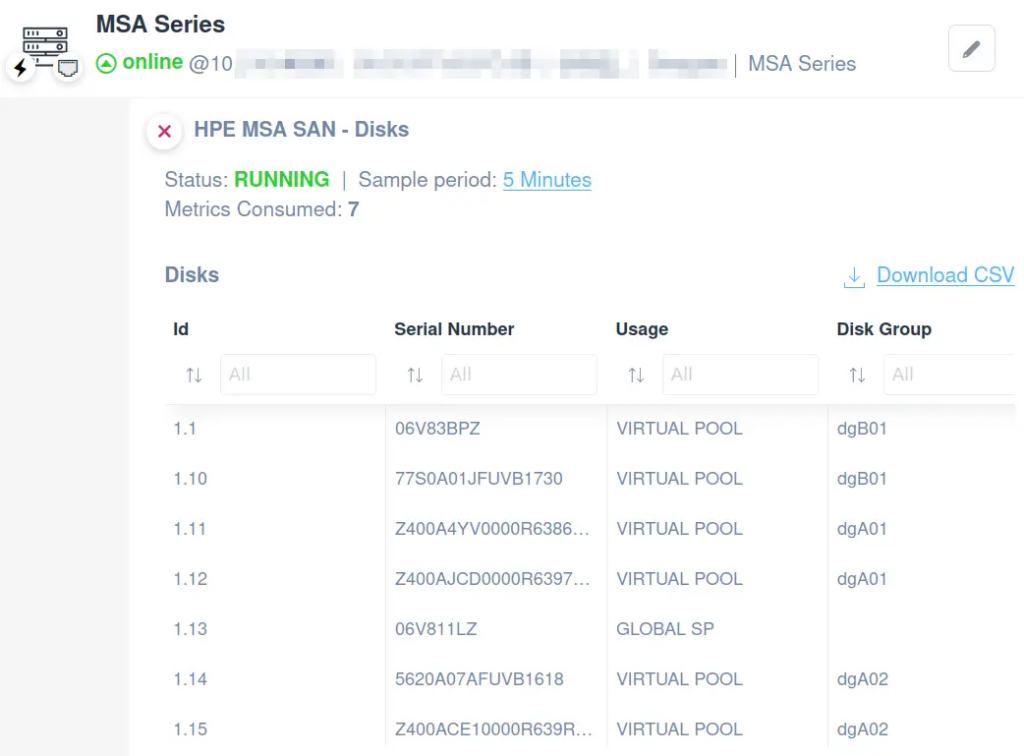
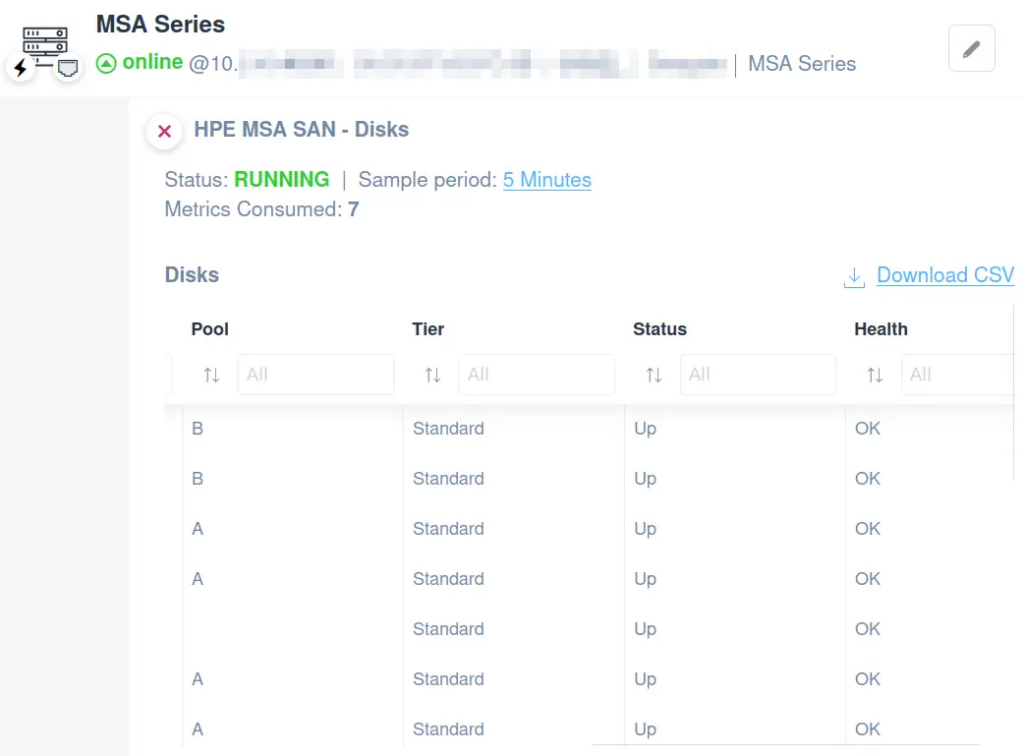
Disks
Use our ready-to-use script to monitor the Disks on the following components:
- Disk location (ID)
- Serial number
- Usage
- Disk group
- Pool name
- Tier
- Status
- Health status
HPE iLO
Easily apply our integration scripts. Use them to monitor the following:
- System Information
- Fans
- Components Temperatures
- Power Supplies
- Memory Status
- System Status
Please note that these scripts use HTTP protocol and have been validated and tested on HPE iLO 5.
System General Monitoring
You can easily apply our General Monitoring script to monitor general information about your HPE iLO. Use it to create a variable section with the following:
- System type
- BIOS version
- Serial number
- System status
Easily monitor HPE iLO General information using the RedFish API.
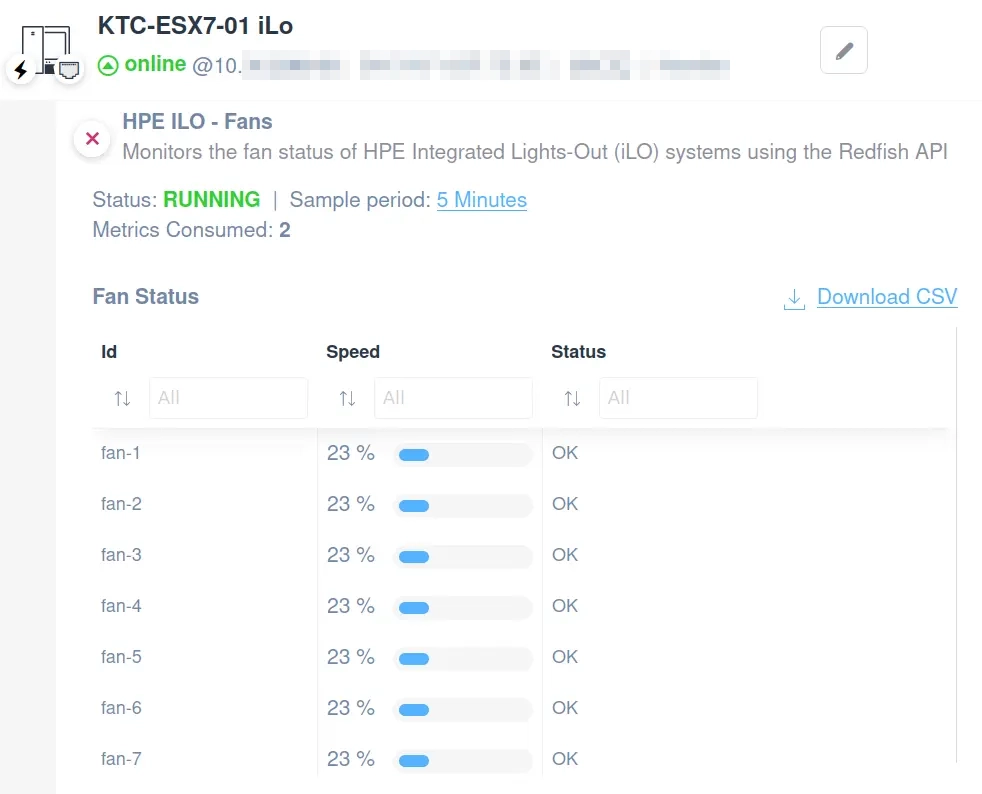
Fans
This scripts retrieve detailed information about:
- Fan name (ID)
- Speed
- Fan status
Accessible in our library, this script stands as a crucial asset for maintaining the health and efficiency of your HPE iLO servers.
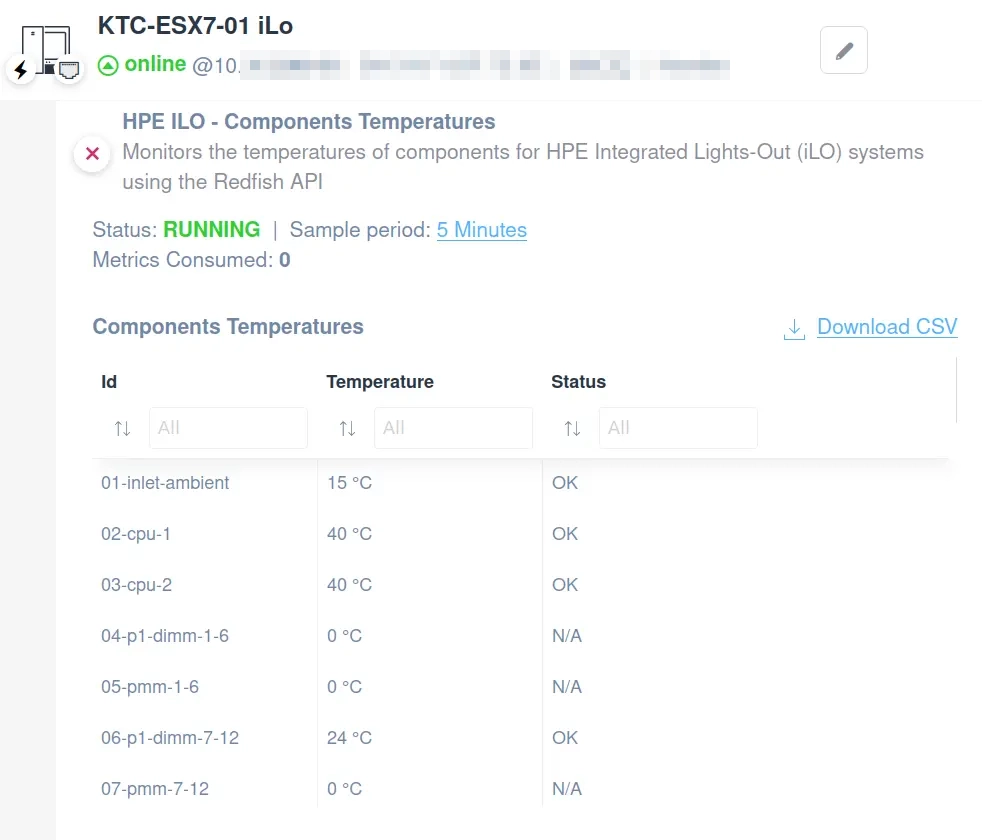
Components’ Temperatures
This script provides rapid access to critical temperature data, ensuring your hardware operates within safe thermal thresholds. Key features include monitoring of:
- Sensor name (ID)
- Temperature
- Status
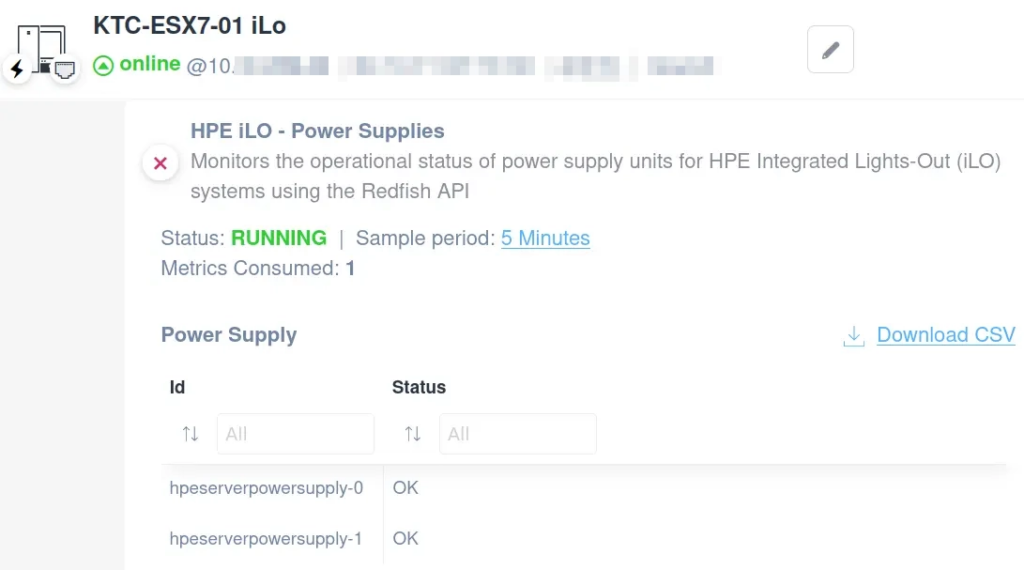
Power Supplies
This script, which employs the HTTP protocol for seamless integration, provides real-time monitoring capabilities, enabling you to monitor as follows:
- PSU ID
- PSU status
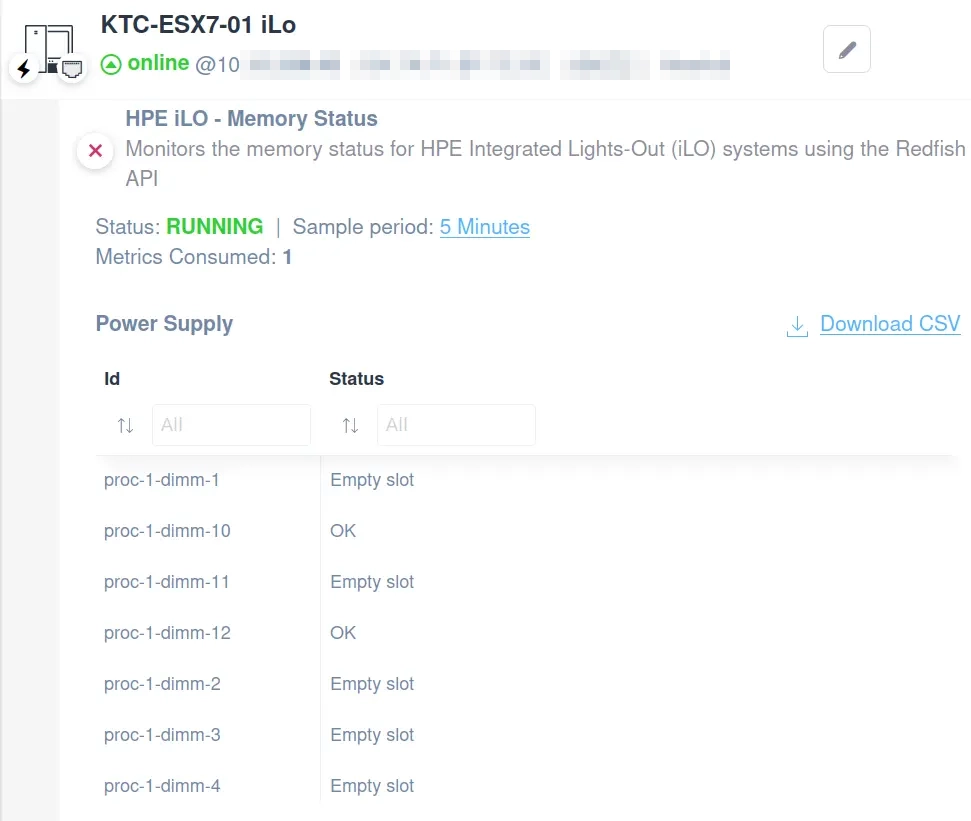
Memory Status
This pre-designed script offers a straightforward approach to ensure your system’s memory is functioning correctly, enabling you to monitor:
- Memory slot ID
- Status
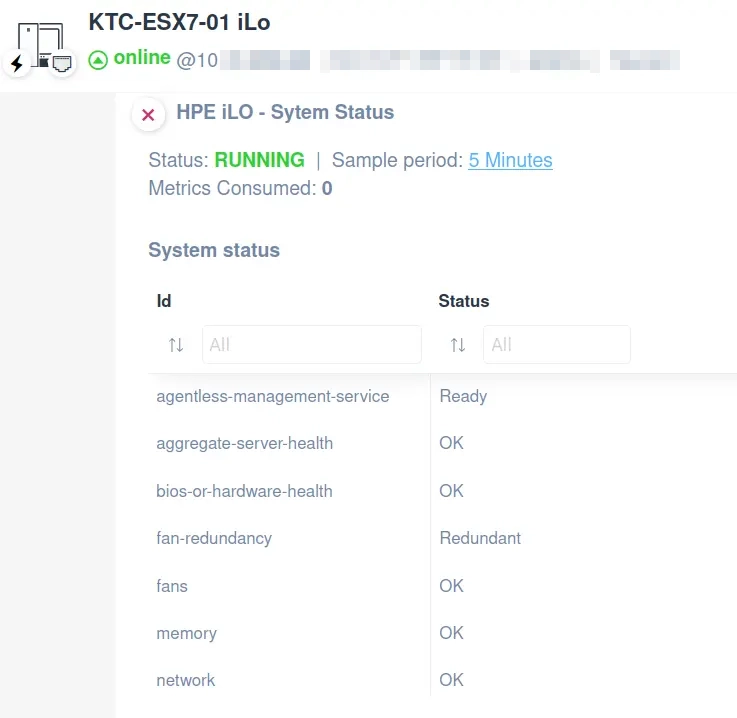
System Status
Apply the HPE iLO System Status to improve your monitoring activities on the following valuable data:
- Component name (ID)
- System status
Dell PowerVault SAN
Effortlessly manage your Dell PowerVault Storage Area Network (SAN), a system optimized for cost-effective application acceleration perfectly suited for remote office setups.
Utilize our custom scripts to monitor your Dell PowerVault SAN hardware efficiently, covering:
- System General
- Drives
- Controllers Parameters
Using the HTTP protocol, these scripts are rigorously validated and tested on the Dell PowerVault ME502 model.
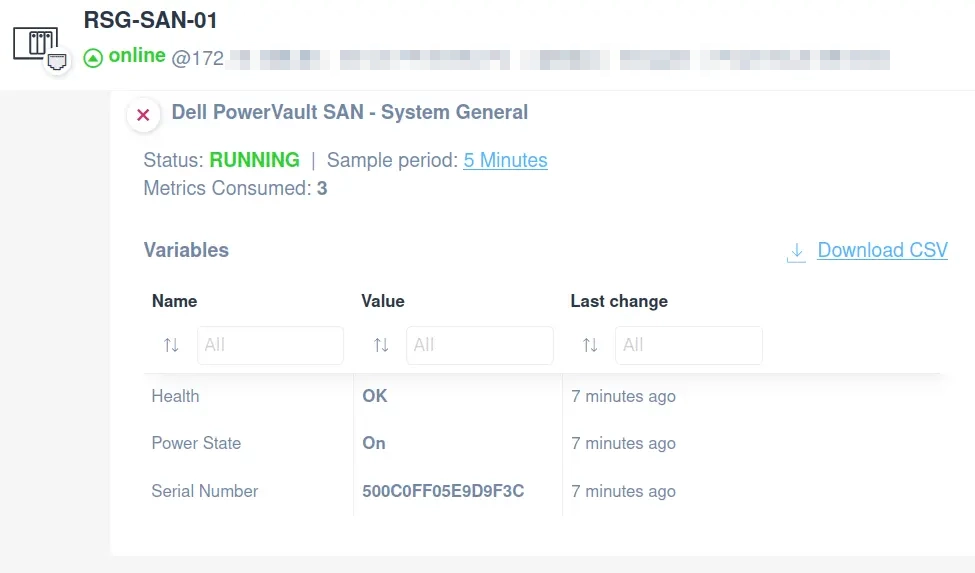
System General
With this script, you can effortlessly track:
- Serial number
- Health status
- Power state
Leverage the RedFish API to streamline the monitoring of general information on Dell PowerVault SAN systems.
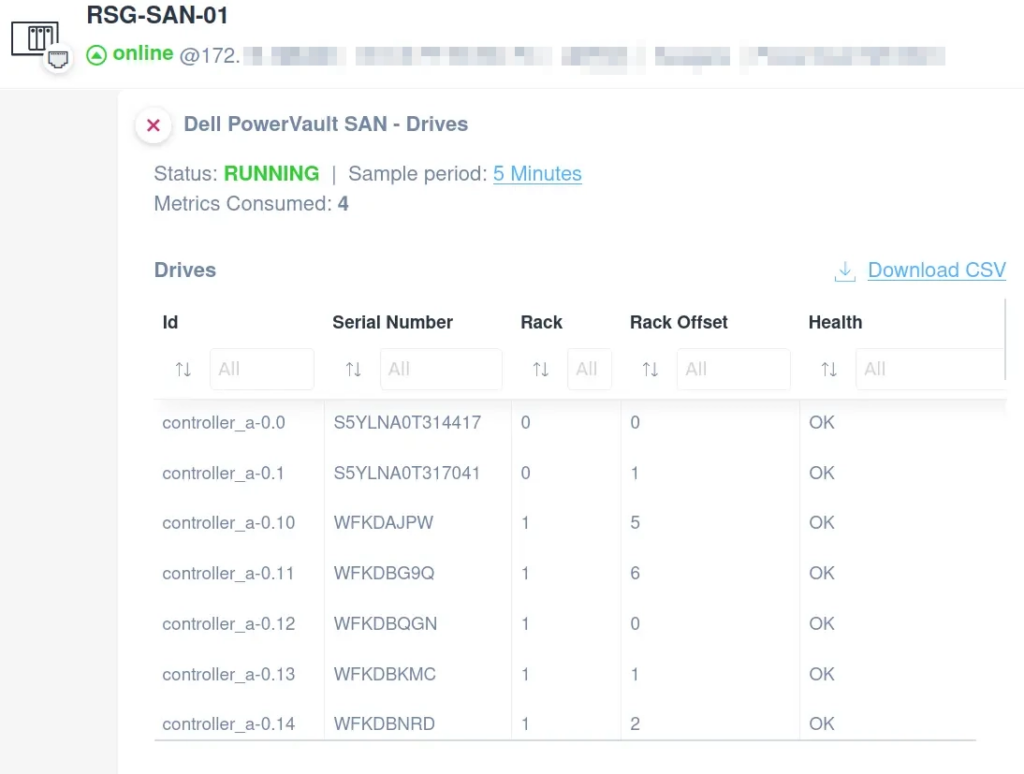
Drives
This integration script enables you to track drive status within the Dell PowerVault SAN system efficiently, covering crucial information such as:
- Drive ID
- Serial number
- Rack
- Rack offset
- Health
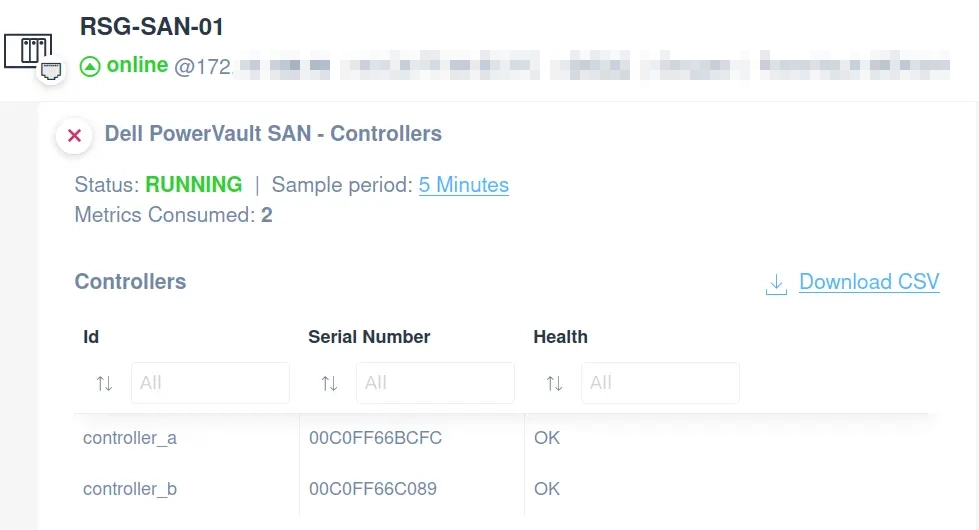
Controllers
This customized tool grants you the capability to oversee each controller’s status within a Dell PowerVault SAN setup, offering comprehensive insights into:
- Controller name (ID)
- Serial number
- Health status
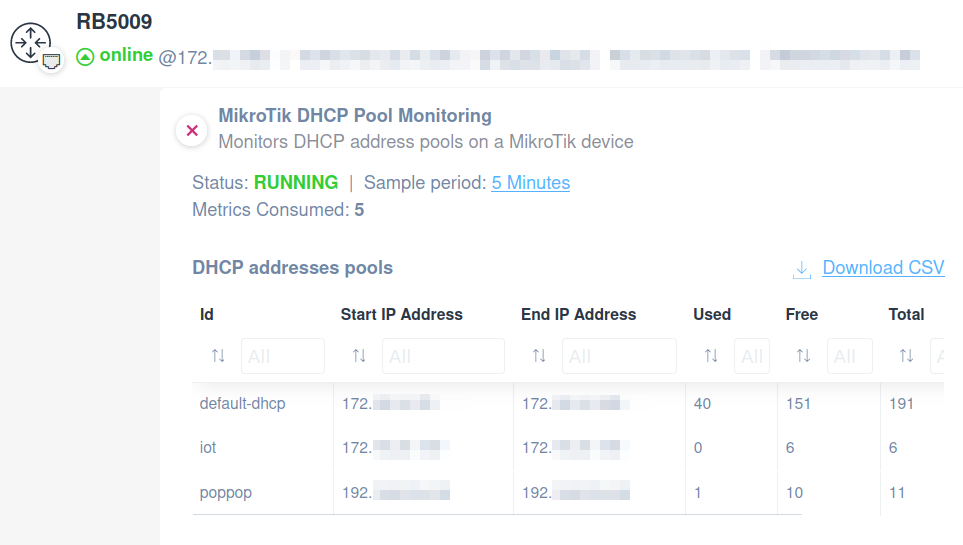
MikroTik
Easily apply the MikroTik script in order to monitor DHCP address pools. You’ll be able to monitor the following:
- Pool name (Id)
- Start IP Address
- End IP Address
- Number of used IP addresses
- Number of free IP addresses
- Number of total IP addresses
The script uses SSH protocol and has been validated and tested on the following MikroTik routers: RB5009UG+S+.
Improvements
Configuration Management Enhancements
We’re excited to announce several improvements to our Configuration Management feature, designed to enhance usability and reliability:
- Automatic Integration Pause: To maintain operational efficiency, Configuration Management will now pause after five consecutive backup failures, with an alert sent to the account owner. You can manually reactivate Configuration Management from the device’s details tab.
- Access to Backups on Locked Devices: You can now access Configuration backups even when devices are locked due to authentication errors, ensuring vital data remains reachable. Please note that the re-authentication is required to restart automatic backups.
- Difference View Enhancement: The Configuration Management feature has been upgraded for better performance with large files, making it easier to spot differences and changes over time.
- Helpful Unlocking Instructions: New users unlocking a device for Configuration Management will find a helpful link directing them to a guide with detailed configuration instructions, streamlining the setup process.
These updates are part of our commitment to continually improve the Domotz experience, making network management more intuitive and effective.
Custom Drivers/Integration Scripts
Significant improvements were also made to our Custom Drivers/Integration Scripts aimed at enhancing stability and expanding functionality:
Optimized Parallelism: To ensure the reliability of our Network Collector, we introduce a cap on the parallel execution of Scripts. This measure is designed to prevent potential crashes by efficiently managing the system’s resource usage.
Enhanced Script Capabilities: Scripts can utilize discovered device MAC addresses and serial numbers, allowing for more robust device identification methods beyond IP addresses. This enhancement enables you to tailor your integration scripts more precisely to your networking environment.
Improved Connectivity Issue Resolution
In our latest update, we’ve improved the message that our WebApp and Mobile App show in relation to connectivity issues.
When Domotz detects that a firewall is blocking outgoing connections to the Domotz Cloud, you will be presented with a clearer, more informative message.
This message will guide you to a dedicated help page, offering a step-by-step guide on adjusting your firewall settings to resolve the issue.
Streamlined Device Detail Access
We’ve made an important improvement to your experience within the Domotz platform. Recognizing the need for a smoother interaction, we have removed the unlock popup that previously appeared upon the first visit to a device’s detail page.
This change means you will no longer receive an immediate suggestion to unlock the device for credential input during your initial inspection. This update is designed to enhance navigation efficiency within the Domotz platform, allowing you to explore device details more seamlessly and without interruption, thereby improving the overall user experience.
Add support for Configuration Management on Aruba CX Switch OS
This enhancement signifies our commitment to expanding compatibility and ensuring seamless network management experiences.
Specifically, the new Aruba CX Switch OSl now supports Configuration Management, marking a significant step forward in our efforts to provide comprehensive control and flexibility for network administrators.
Additional MIBs available in the Domotz Database
Additional MIB files are available for the following devices.
- ARDF cell devices
- Aruba instant MIB
- Zyxel GS1900 series
- Riedel Artist
- HP LaserJet
- DHCP MIB
Fix
- Display the correct number of Important Offline devices when there are devices with grouped interfaces
- Display appropriate Metrics consumption for devices
- Configuration Management issues with Aruba and Netgear devices
- Configuration Management: Incorrect state of config inspection
- You could not connect to the new UniFi Controller when there was an old one previously deleted
- Latest Configuration Backup older than one year is not accessible
- Configuration Backup: the “unlock” should not appear in the access management of Aruba
- HP Aruba AP Configuration changes alerted every six hours
- Account Management, “Agent Cleanup”, option not deleting expected information
- DHCP Requests Rate not showing
- DHCP Requests Rate wrong device sort
- Wrong date format inside the Logging & Reports page
- Logging & Reports page has missing icons for Agents Alerts change
- Cannot create a Domotz Agent on a machine already having a GlassWire Endpoint
- Wrong color on the input field
- Ubiquiti Edge Switch authentication status reset incorrectly
- Rectified the Metrics calculation for devices with SNMP Pre-Configured Templates. Incorrect numbers were displayed on the Device detail and Metrics management view.
- Visualization of long script parameters description was breaking the UI
- Netgear switch missing Interfaces tab
- Remote connection issues
- The number of devices supporting a sensor is inconsistent
- Network troubleshooting dashboard showing inconsistent IP-Conflict data
- Cannot sync ITGlue to Domotz due to missing location
- Fake Synology devices discovered, causing hundreds of important offline devices