
The year might be wrapping up, but we’re not slowing down! This December release brings a mix of powerful new features, Domotz Public API updates, refined scripts, and key improvements to make your IT infrastructure monitoring even smoother. Whether it’s advanced troubleshooting solutions, new integrations, or enhanced automation, there’s something here to simplify your day-to-day tasks.
As always, we love hearing from you! If you have any feedback or questions, feel free to reach out to our support team at support@domotz.com. Let’s make the new year even better, together!
New features and integrations
New features
Enhancing Domotz Public API for scalable automation
We’ve expanded the Domotz Public API to improve automation capabilities and streamline network management.
First, the API now provides programmatic access to the WAN (Public) IP address of each Collector, enabling tasks like active WAN connection verification, IP whitelist updates, and load balancing checks across multiple sites—reducing manual effort and enhancing efficiency.
Additionally, we’ve extended the API to support the Device Notes property. Network administrators can now retrieve notes via the listDevices and getDevice endpoints or update them using the editDevice API. This allows for consistent management of device-specific details such as labels or setup notes, ensuring smoother identification and documentation across your networks.
You are able to simplify network health checks, reduce manual effort, and boosts efficiency for teams managing large-scale infrastructures.
Add support for UniFi Cloud Controller
We’ve added support for UniFi Cloud Controller, including solutions like the UniFi Dream Machine and other local UniFi controllers.
By leveraging this new capability, users can improve device identification, streamline network management, and gain deeper insights into their UniFi-managed environments—all from within Domotz.
Once connected, Domotz retrieves detailed information about devices managed through the UniFi Cloud Controller, such as radio links, model details, serial numbers, and firmware versions. This integration ensures that your device data is periodically updated, providing an accurate and up-to-date view of your network.
Automation and Scripts
Dell iDRAC
Dell iDrac Components Temperature
This script can monitor the temperature of various components on a Dell iDRAC server, ensuring that the system does not overheat and operates efficiently.
You will be able to monitor the following:
- Status
- Reading
- Min Warning Threshold
- Max Warning Threshold
- Min Critical Threshold
- Max Critical Threshold
The script connects to the Dell iDRAC interface using the Redfish protocol.
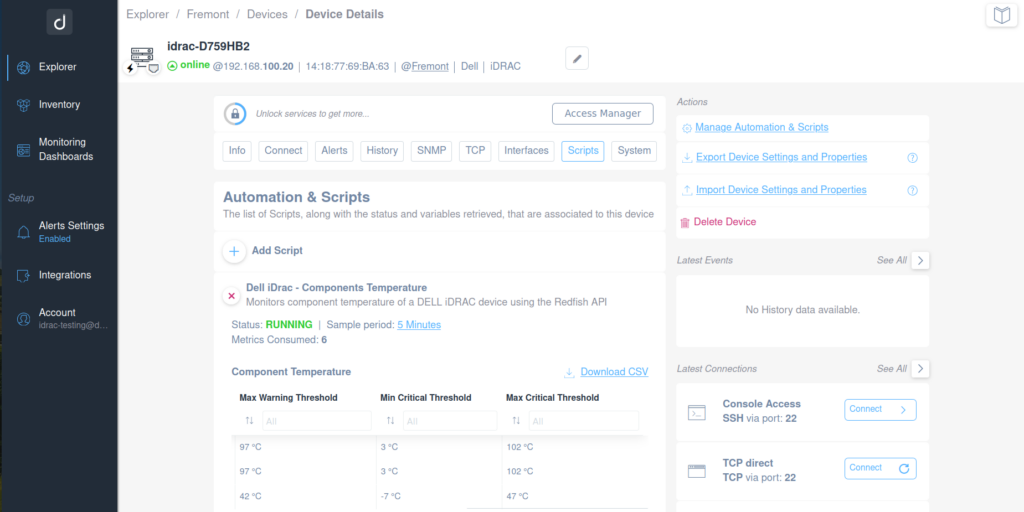
Device Details Interface Overview
1. The top section displays the device name "idrac-D759HB2" with its status shown as online and includes IP and MAC addresses.
2. Below, a menu provides various tabs: Info, Connect, Alerts, History, SNMP, TCP, Interfaces, Scripts, and System. Click a tab to view more details.
3. The "Automation & Scripts" section features a button to add a script and details about a current script titled "Dell iDrac - Components Temperature". It shows the script's status as RUNNING and offers a sample period of 5 Minutes. Metrics consumed are listed as 6.
4. Component temperature thresholds are shown: Max Warning and Min Critical, with values 97°C, 42°C, and 102°C, 3°C.
5. The right sidebar lists actions such as "Manage Automation & Scripts", "Export Device Settings and Properties", "Import Device Settings and Properties", and an option to delete the device.
6. Latest events and connections are shown, including options for console access via SSH and TCP connections, both of which have connect buttons.
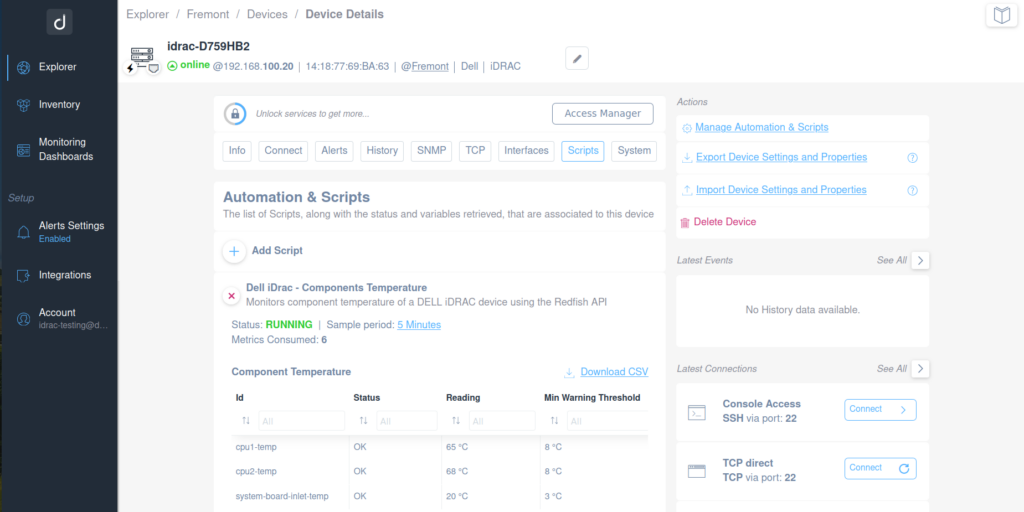
Dell iDRAC Device Details Interface
1. The image shows the device details for a Dell iDRAC unit with the ID "idrac-D759HB2," which is online and displays its IP address as 192.168.100.20.
2. The main menu on the left includes options like Explorer, Inventory, Monitoring Dashboards, Alerts Settings, Integrations, and Account settings.
3. In the Automation & Scripts section, there is an option to "Add Script" and details for "Dell iDrac - Components Temperature." This monitors the component temperature using the Redfish API. The status is marked as "RUNNING," with a sample period link to "5 Minutes" and "Metrics Consumed: 6."
4. A table displays Component Temperature readings with columns such as Id, Status, Reading, and Min Warning Threshold. Listed components include cpu1-temp and cpu2-temp, both showing "OK" status with readings and thresholds.
5. On the right, under Actions, there are options labeled "Manage Automation & Scripts," "Export Device Settings and Properties," "Import Device Settings and Properties," and "Delete Device."
6. The Latest Connections section shows "Console Access SSH via port: 22" and "TCP direct TCP via port: 22," both with "Connect" buttons.
Dell iDrac PSU Power Usage
Use this script to monitor the operational status of Power Supply Units (PSUs) and track power usage details, including total power consumption and capacity utilization, on a Dell iDRAC server.
You will be able to monitor the following:
- Description
- Primary Status
- Total Output Power
- Input Voltage
- Redundancy Status
- Part Number
- Model
- Manufacturer
- Power Usage
- Power Capacity
- Capacity Percentage
The script uses SSH as a communication protocol.
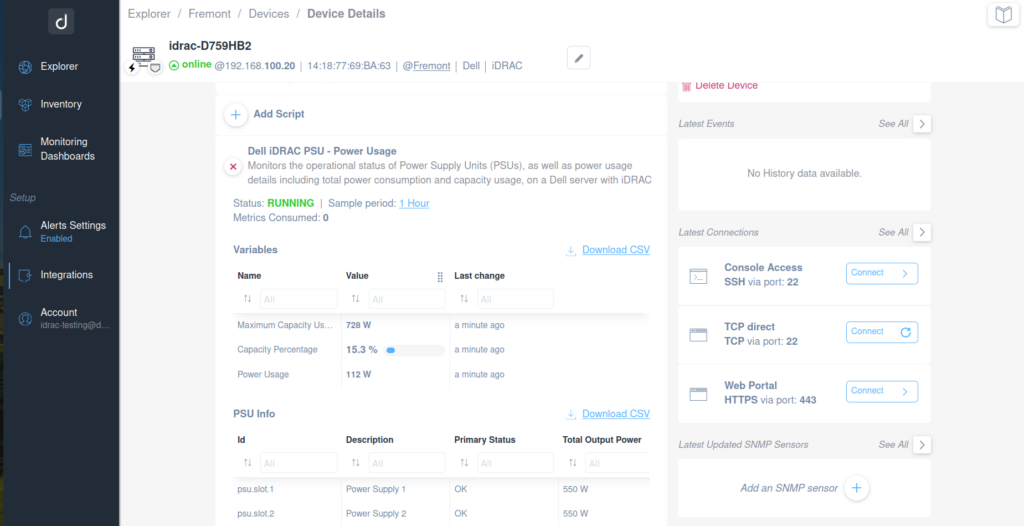
Device Power Usage Details Page
1. The top section displays the device ID `idrac-D759HB2`, its status as "online," and the network address `192.168.100.20`.
2. The main area shows "Dell iDRAC PSU - Power Usage" monitoring details, including status "RUNNING," the sample period of "1 Hour," and metrics consumed being "0."
3. Under "Variables," three values are shown:
- Maximum Capacity Usage: 728 W
- Capacity Percentage: 15.3%
- Power Usage: 112 W
4. In the "PSU Info" section:
- Two power supply units are listed:
- "psu.slot.1" labeled as "Power Supply 1," with a status of "OK" and total output power of "550 W."
- "psu.slot.2" labeled as "Power Supply 2," with a status of "OK" and total output power of "550 W."
5. On the right sidebar, under "Latest Connections," there are three options:
- Console Access via SSH on port 22
- TCP direct access on port 22
- Web Portal access via HTTPS on port 443
6. Below the sidebar, there's an option to "Add an SNMP sensor."
Zoom
Zoom Rooms List
This script allows you to monitor the status of all Zoom Rooms to ensure that all rooms are properly configured and available for meetings.
You will be able to monitor the following:
- Room Name
- Status
- Location Name
- Time Zone
The script uses HTTPS as a communication protocol.
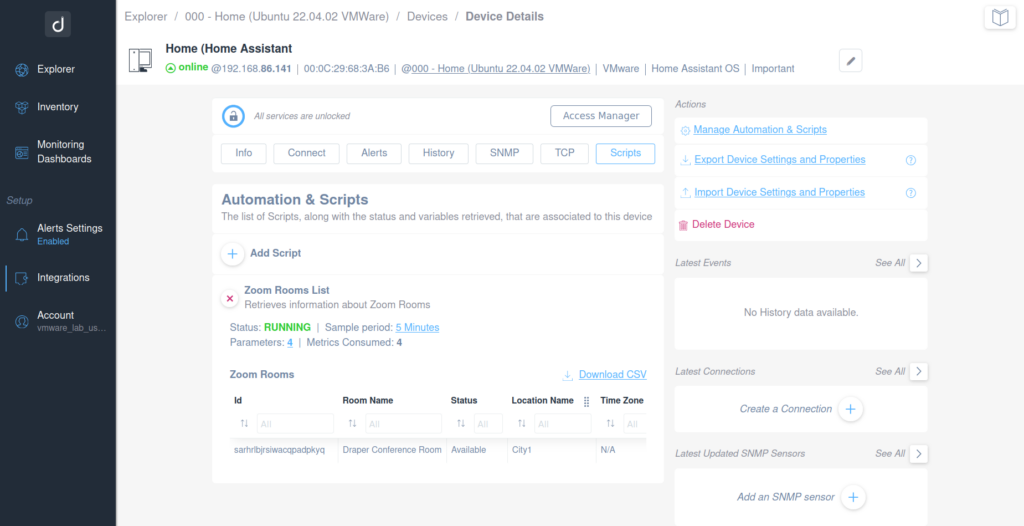
Device Management Dashboard Overview
1. The dashboard displays the details for "Home (Home Assistant)" including its online status and associated IP and MAC addresses.
2. Main navigation is on the left sidebar with sections for Explorer, Inventory, Monitoring Dashboards, Alerts Settings, Integrations, and Account.
3. Top action buttons include Info, Connect, Alerts, History, SNMP, TCP, and Scripts for device management.
4. Under "Automation & Scripts," there is a list featuring "Zoom Rooms List" with status "RUNNING." Options to add a script and download CSV are available.
5. On the right, under Actions, users can manage automation and scripts, export, or import device settings. The "Delete Device" option is also present.
6. Bottom sections on the right provide options for creating a connection, adding an SNMP sensor, and viewing latest events and connections.
Zoom Device List
If you want to ensure optimal performance and uptime of your collaboration spaces, you can use our integration script to monitor the status of all your Zoom Room devices.
Extract more information about the following:
- Device Name
- Room ID
- Room Name
- Serial Number
- Vendor
- Model
- Platform OS
- App Version
- Tag
- Enrolled in Zoom Device Manager (ZDM) flag
- Connected to Zoom Device Manager (ZDM) flag
- Device Type
- Device Status
- Last Online time
The script uses HTTPS as a communication protocol. Transform Zoom Room management into a proactive and automated process.
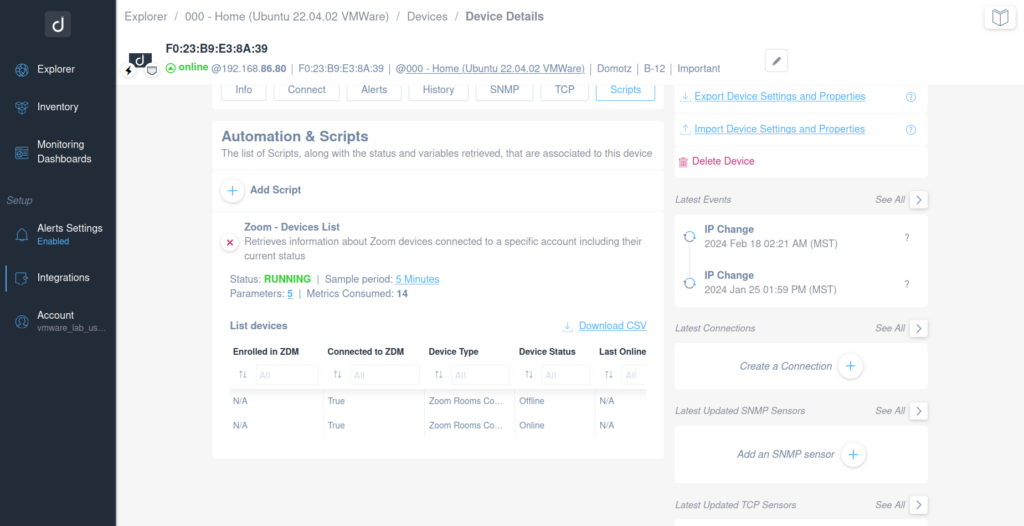
Device Details and Automation Management Interface
1. The page displays details for a device with MAC address F0:23:B9:E3:8A:39, currently marked as online and connected at IP 192.168.86.80.
2. The main section "Automation & Scripts" includes an option to add a script and lists a script titled "Zoom - Devices List" which retrieves information about Zoom devices. The status of this script is running, with a sample period of 5 minutes.
3. The "List devices" table includes columns for Enrolled in ZDM, Connected to ZDM, Device Type, Device Status, and Last Online, showing two devices connected.
4. Options to export and import device settings and properties are available on the right sidebar.
5. A red "Delete Device" link allows for device removal.
6. The right sidebar also highlights latest events, such as recent IP changes with timestamps, and allows for actions such as creating a connection or adding an SNMP sensor.
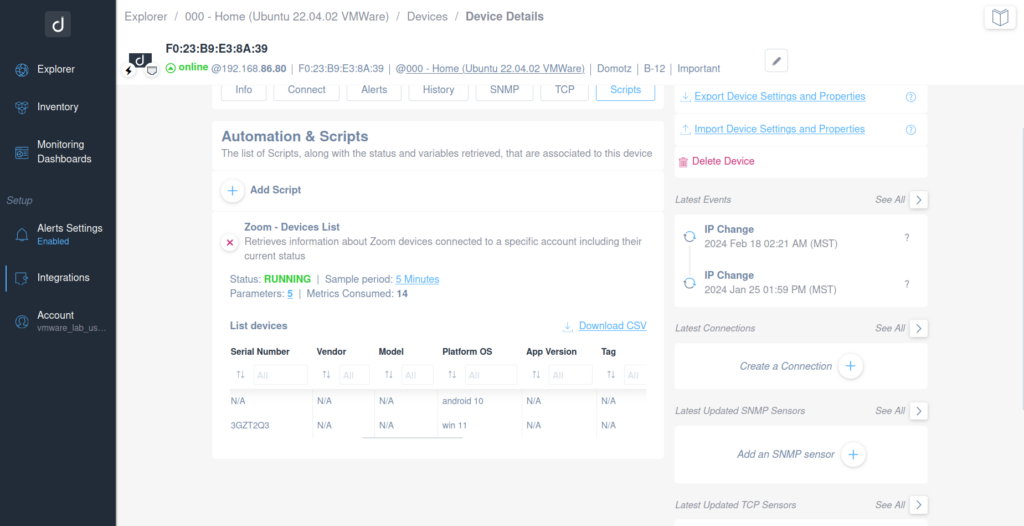
Device Details and Automation Scripts Interface in Domotz
1. The interface shows the device details, including the MAC address and status, which is online with a specified IP address.
2. The "Automation & Scripts" section lists scripts associated with the device. The example script, "Zoom - Devices List," retrieves Zoom device information and currently has a status of "RUNNING."
3. A table lists device details such as serial number, vendor, model, platform OS, app version, and tag, with options to filter each column.
4. Additional options include buttons to "Export Device Settings and Properties," "Import Device Settings and Properties," and "Delete Device."
5. The sidebar provides navigation options, including Explorer, Inventory, Monitoring Dashboards, Alerts Settings, Integrations, and Account.
6. The right panel contains sections for "Latest Events," "Latest Connections," "Latest Updated SNMP Sensors," and "Latest Updated TCP Sensors," each with options to view more details.
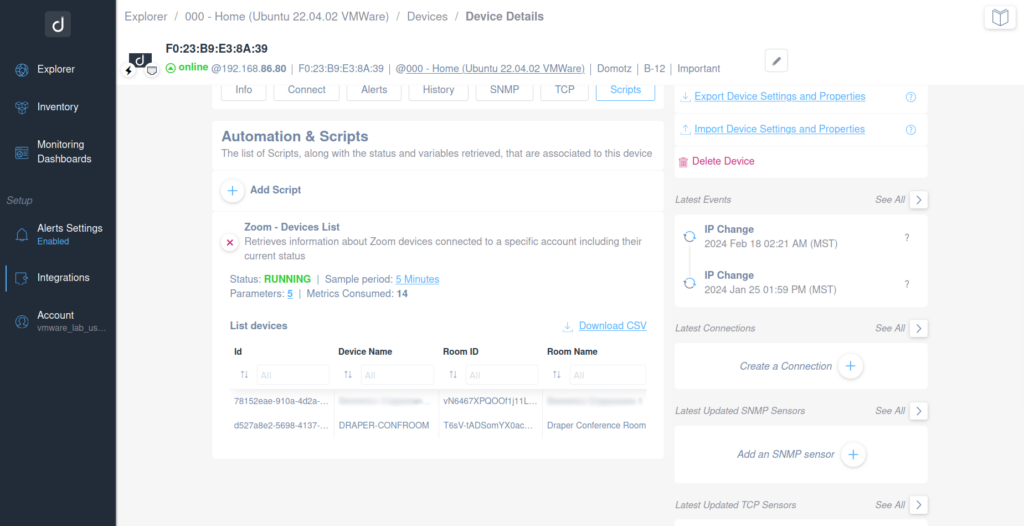
Device Details and Script Automation Interface
1. The device's MAC address and current online status are displayed at the top, along with an IP address.
2. The "Automation & Scripts" section shows a script named "Zoom - Devices List," which retrieves information about connected Zoom devices. The script status is "RUNNING."
3. You can access the list of devices, which includes columns for ID, Device Name, and Room ID.
4. Options to "Add Script," view "Sample period" (5 Minutes), and see the number of parameters and metrics consumed are available.
5. Various actions are accessible on the right side, such as exporting or importing device settings, and deleting a device.
6. Recent events are listed under "Latest Events," showing IP changes with timestamps.
7. Below, options to "Create a Connection" and "Add an SNMP sensor" are available.
SNMP pre-configured templates
Crestron System Information
Use this SNMP pre-configured template to monitor Crestron Control System info, like CPU usage and error count:
- CPU Utilization
- CPU Max Utilization
- Error Log Error Count
- Error Log Warning Count
- Error Log Notice Count
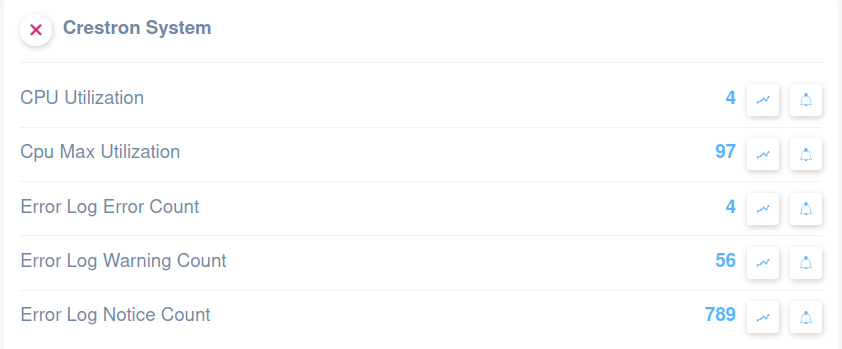
Crestron System Dashboard Overview
1. **CPU Utilization**: Shows a value of 4, indicating current CPU usage level.
2. **CPU Max Utilization**: Displays a value of 97, reflecting the maximum CPU usage recorded.
3. **Error Log Error Count**: Indicates 4 errors logged in the system.
4. **Error Log Warning Count**: Lists 56 warnings found in the error log.
5. **Error Log Notice Count**: The count is 789 for notices in the error log.
Each metric includes options to view trends or set alerts, enabling monitoring and management of system performance and error handling.
Crestron Processor Monitoring
Through this SNMP pre-configured template, you can monitor Crestron Control System Processor info, like:
- Crestron Processor Firmware
- Crestron Processor Power On Time
- Crestron Touchpanel Program
- Crestron Processor Program
- Crestron Processor Current Time
- Crestron Processor Uptime
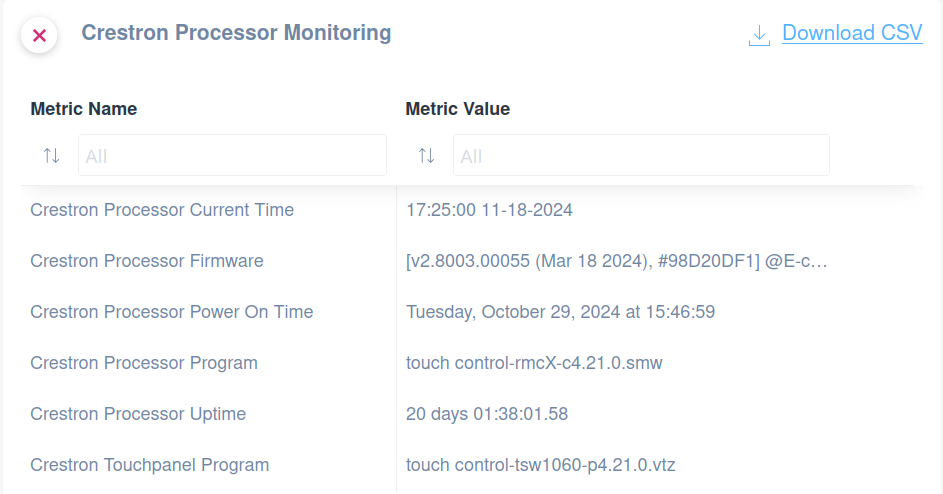
Crestron Processor Monitoring Dashboard
1. The dashboard displays various metrics related to Crestron Processor Monitoring.
2. The "Metric Name" column lists the metrics: Current Time, Firmware, Power On Time, Program, Uptime, and Touchpanel Program.
3. The "Metric Value" column shows corresponding details:
- Current Time: 17:25:00 on November 18, 2024.
- Firmware Version: v2.8003.00055 with additional identifiers.
- Power On Time: October 29, 2024, at 15:46:59.
- Program: touch control-rmcX-c4.21.0.smw.
- Uptime: 20 days 01:38:01.58.
- Touchpanel Program: touch control-tsw1060-p4.21.0.vtz.
4. There is an option to download the data in CSV format via a "Download CSV" link.
Crestron Codec and System Power
Using this SNMP pre-configured template, you can extract Crestron Control System Codec info and System Power:
- Codec Call Status
- Codec Connection
- Codec Temperature
- Call Support Button Events
- System Power
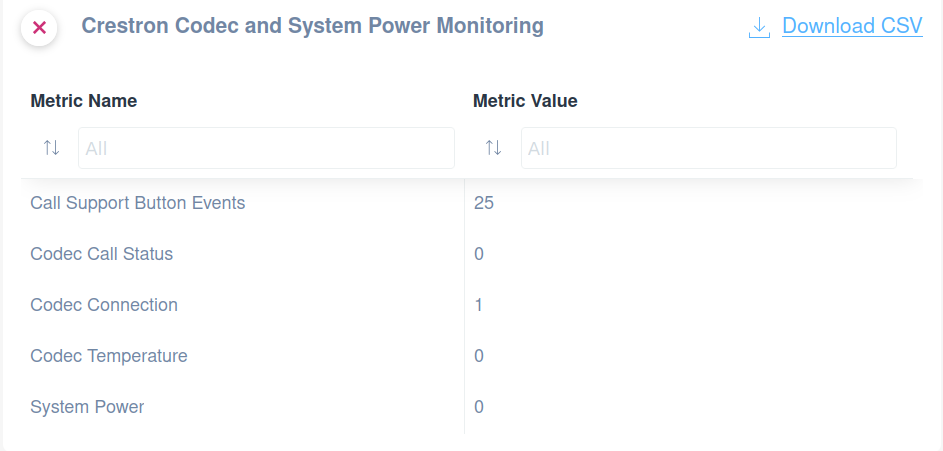
Crestron Codec and System Power Monitoring metrics table.
1. At the top, there are options to filter metrics by their names or values using dropdown menus labeled "Metric Name" and "Metric Value."
2. The table lists various metrics on the left, such as "Call Support Button Events," "Codec Call Status," "Codec Connection," "Codec Temperature," and "System Power."
3. Corresponding metric values are displayed on the right: 25 for Call Support Button Events, 0 for both Codec Call Status and Codec Temperature, 1 for Codec Connection, and 0 for System Power.
4. A "Download CSV" link is available at the top right for exporting the data.
Want to know more about our SNMP pre-configured sensors? Read the article on our Help Center.
Enhancements
Improved automatic Network Topology for Ubiquiti AirMax devices
We’ve enhanced the automatic Network Topology to provide better visibility for Ubiquiti AirMax devices connected via wired (Ethernet) interfaces.
Domotz now directly retrieves information about devices reachable through the AirMax Ethernet ports, ensuring they are seamlessly integrated into the network topology map instead of appearing as “floating” devices. Existing functionality that groups connected AirMax devices together is preserved, offering a clear and accurate representation of your network.
This improvement simplifies network monitoring and enhances clarity for environments leveraging Ubiquiti AirMax solutions.
New Filters and Sorting for Monitoring Configuration View
We’ve added powerful filtering and sorting options to the Monitoring Configuration View to make it easier to manage your devices.
You can now filter devices by type, status, and tags (importance) when deciding which ones to set as Managed or Unmanaged.
Additionally, you can sort devices by Last Added date, IP address, or Name for a more organized view.
These filters and sorting options apply to both the Discovered Devices and Managed Devices columns, helping you quickly find the devices you need and streamline your monitoring configuration process.

Device Management Interface Overview
1. Navigate to "Select Devices to manage" to access the device management interface.
2. In the "Networks" section on the left:
- View and expand different network categories such as "Physical and Virtual Networks" and "Routed Networks."
- Click on the network IP address (e.g., 192.168.68.50) to see the devices within that network.
3. In the "Devices" section in the center:
- Use the dropdowns to sort devices by "Last Added," "IP Address," or "Name."
- Filter devices by entering keywords such as Name, IP Address, Make, or MAC Address.
4. In the "Managed Devices" section on the right:
- Select individual devices or "Select All" to manage multiple devices simultaneously.
- Review device information such as name, discovery timing, and IP address.
- Note the device status icons, which may indicate connectivity or issues.
This interface allows efficient management and monitoring of various network devices.

Device Management Interface Overview
1. On the left panel, there is a navigation tree under "Networks," showing categories like "Physical and Virtual Networks" and "Routed Networks." Click to expand networks and view associated devices or IP ranges.
2. In the center, the "Devices" section lists discovered devices with options to sort by "Last Added" and filter. Click "Add" to include new devices, or use the filter bar to narrow the list by name, IP address, or MAC address.
3. The "Discovered Devices" list displays device names, discovery dates, and types. Selection boxes allow for bulk actions. Click a device for more details.
4. On the right, the "Managed Devices" section shows devices selected for management, allowing for additional administration tasks.

Manage and Filter Network Devices
1. In the Networks panel on the left, choose a network category such as "Physical and Virtual Networks" to view available networks.
2. Under the Devices section at the top, use the "Sort by" dropdown to organize devices by various criteria, such as "Last Added."
3. Use the "Filter by" dropdown to narrow down devices by types, like "Audio & Video," "Audio Player," or "AV Receiver."
4. Discovered Devices are shown on the left with details like MAC addresses and discovery time. You can select individual devices or choose "Select All."
5. On the right, under Managed Devices, you can manage selected devices with similar options, including visibility of device names and the duration since discovery.
Improved Devices List and Per-Device Collector Onboarding
We’ve enhanced the Per-Device Collector onboarding process to make it more intuitive and efficient. After installing a Collector, a new device selection modal will guide users through the setup process by displaying:
- The total number of discovered devices
- A list of recommended devices for management
- Other unmanaged devices
Users can easily adjust their selection or choose manual setup, which will redirect them to the Monitoring Configuration page. The unified device list now displays managed and unmanaged devices in a single view, complete with filters, sorting, and bulk actions for improved usability.
Clear counters for all devices ensure better visibility, simplifying the onboarding experience and making device management faster and more seamless.
Remove any DCPP reference from Portal/WebApp/Backoffice
We’ve removed all references to the DCPP program across the Portal, WebApp, and Backoffice. This update ensures alignment with our updated pricing strategy and eliminates any potential confusion related to the retired program.
Network Collector Updates
We recently rollout different platform updates and related improvements:
Domotz Box and Snap Linux platforms
Version 6.4.1-b001
- Network scan performance optimizations in case of many External Hosts or many VLANs configured
- Fetch basic network information (WAN/LAN) as soon as the Collector starts for the first time
- Fix issues on false positive devices HB lost for devices monitored via IP Address Ranges
- Fix issue causing all devices to change status at the same time in particular conditions
- Fix issue on unexpected UDP port usage
- Fix routing issue for VLANs when using VPN on demand
- Fix issue preventing the display of SNMP Pre-Configured Sensors data when applied on many devices
New MIB
- NetResult MIB
Fixes
- Fix issue on Devices Export missing information for Devices Port Mapping
- Fix issue on Configuration Management for Cisco Switches (Cisco CBS220-*T-4G models)
- Fix issue of the Important Devices counter and banner not properly updating to reflect the Devices status
- Fix the broken link for Zapier integration
- Fix Collector Migration operation that was failing when performed by Team Member users
- Fix issue on device model identification for SonicWall devices
- Fix issue on the Device Detail Interfaces tab not displaying information in case the mapped devices were “Unmanaged”