
We are thrilled to share the latest suite of enhancements and additions to Domotz. This month, we’re rolling out new features, sophisticated integration scripts, and refined Dell EMC SNMP templates designed to streamline your monitoring and management tasks while broadening the scope of device compatibility and operational insight.
We highly value your feedback and encourage you to contact our support team at support@domotz.com for any comments, questions, or suggestions you may have. We can continuously enhance and elevate Domotz to surpass your network management and monitoring requirements by working together.
New Feature
Enhanced SNMP Template Customization
You can now select which properties/columns you want to monitor when applying an SNMP template. This improvement gives you more control and flexibility in monitoring, allowing you to exclude specific properties/columns that you don’t need to track.

Network Traffic Monitoring Configuration
1. In the "Manage Pre-Configured Template" window, under "Network Traffic (Extended)," choose the network properties you want to monitor.
2. Ensure "Operational Status" and "Speed" are selected to track the device's activity level and data transfer rate.
3. Select "Inbound Traffic" and "Outbound Traffic" to monitor data flowing into and out of the network.
4. Opt to track errors by selecting "Inbound Errors /s" and "Outbound Errors /s" for error management.
5. Uncheck any properties you do not wish to monitor.
6. After configuring your selections, click "Apply" to save the changes.
This enhancement greatly improves your ability to customize and streamline the monitoring process. By focusing on the most important metrics, you can proactively monitor your network and quickly address critical issues with precision and speed.
New SNMP Templates
This month, we released the following Dell EMC SNMP templates:
Dell EMC Switch – General/Documentation
In the case of Dell EMC Switch, an SNMP pre-configured template is available to extract the following properties:

Dell EMC Switch General Information
1. Software Version: Displays the current software version as 6.7.0.4.
2. Serial Number: Shows your device's serial number, partially obscured for privacy.
3. CPU Usage: Indicates CPU utilization at 13%, alongside a visual progress bar.
4. Memory Available: Lists available memory as 1005.38 MiB.
5. Memory Free: Indicates free memory as 177.91 MiB.
6. Memory Usage: Shows memory usage at 82%, with a corresponding progress bar.
Each line includes options for further actions or notifications.
Dell EMC Switch – Fans
For fans, an SNMP Pre-Configured template is available to extract the following properties:

Dell EMC Switch Fan Status Overview
1. The table displays the status of fans in a Dell EMC switch.
2. The columns are labeled "Index," "Status," and "Speed."
3. "Index" lists each fan with identifiers such as "11-Fan 1," "12-Fan 2," "21-Fan 1," and "22-Fan 2."
4. In the "Status" column, all fans are marked as "normal."
5. The "Speed" column shows the speed of each fan as "5000 RPM."
6. Dropdown filters at the top allow sorting by Index, Status, and Speed.
Dell EMC Switch – Power Supply Unit
For Dell EMC PSUs, this template is available to extract the following properties:

Dell EMC Switch Power Supply Status Overview
1. The interface displays a table with two columns: "Index" and "Status."
2. Under "Index," power supply components are listed, including "10-System," "11-Main," "12-Secondary," "20-System," "21-Main," and "22-Secondary."
3. The "Status" column shows the condition of each component, indicated by labels such as "normal" or "notPresent."
4. Use the filter boxes below the column headers to search or sort by specific indices or status types, helping to quickly identify any components that are not present or have issues.
New Integration Scripts
Integration scripts enable you to monitor and manage various entities, such as network-connected devices, cloud services, and web applications. By utilizing standard protocols, such as SSH, WINRM, SNMP, and HTTP/HTTPS, these scripts enable you to gather valuable data and perform actions on the monitored devices and services.
This month, we released the following:
Fujitsu iRMC
Use the following custom scripts to optimize your Fujitsu iRMC monitoring:
- General information
- Memory Status
- Power Supplies
- Fans
- Component Temperature
- Components Status
Improve your overall efficiency with Domotz on Fujitsu iRMC systems.
General Information
With this integration script, you will be able to get monitoring insights on the following:
- System Type
- Firmware Version
- Serial Number
- System Status

Monitoring Status Overview of Fujitsu iRMC REST API
1. The monitoring status is labeled as "RUNNING" in green.
2. The sample period is set to "5 Minutes."
3. Metrics consumed is listed as "0."
4. The "Variables" section displays several entries:
- "BIOS Version" is "V5.0.0.12 R1.46.0 for D3383-A1x."
- "Serial Number" is "YMBQ015527."
- "System Status" is "OK."
- "System Type" is "PRIMERGY RX2530 M4."
5. Each variable entry shows the last change time as "2 minutes ago."
Memory Status
With this integration script, you will be able to get monitoring insights on the following:
- Memory Slot ID
- Memory Slot Status

Memory Status Overview in Fujitsu iRMC REST API
1. The status is indicated as "RUNNING" in green text.
2. The sample period is set to "5 Minutes" and metrics consumed are listed as "1."
3. Under "Memory Status," there is a table with two columns: "Id" and "Status."
4. The Ids listed are "dimm-1a," "dimm-1b," and "dimm-1c."
5. The statuses for "dimm-1a" and "dimm-1b" are "OK," while "dimm-1c" is marked as "Empty slot."
Power Supplies
With this integration script, you will be able to get monitoring insights on the following:
- PSU ID
- PSU Status

Status Overview of Fujitsu iRMC Power Supplies
1. The status of the iRMC Power Supplies REST API is displayed as "RUNNING" in green.
2. The sample period is set to "5 Minutes."
3. Metrics consumed are listed as "0."
4. Under "Power Supply Status," three columns are presented: "Id" and "Status."
5. Two power supply units, "psu1" and "psu2," are listed with their statuses set to "OK."
Fans
With this integration script, you will be able to get monitoring insights on the following:
- Fan ID
- Fan Speed
- Fan Status

Monitoring Fan Status via Fujitsu iRMC REST API.
1. The system status is indicated as "RUNNING" in green.
2. A sample period of "5 Minutes" is set, with "2" metrics consumed.
3. The "Fan Status" table displays three columns:
- "Id" lists fan identifiers (e.g., fan-psu1, fan-psu2).
- "Speed" shows rotation speeds in RPM (revolutions per minute) for each fan (e.g., 2000 RPM, 4300 RPM).
- "Status" indicates the operational status, marked as "OK".
4. Use filters in each column to sort or search specific values.
Component Temperature
With this integration script, you will be able to get monitoring insights on the following:
- Sensor ID
- Sensor Temperature
- Sensor Status

Fujitsu iRMC Components Temperature Overview
1. Status indicates the API is "RUNNING." The sample period is set to "5 Minutes," and "2 Metrics" have been consumed.
2. The "Component Temperature" table displays three columns: "Id," "Temperature," and "Status."
3. Under "Id," the components listed are "ambient," "cpu1," and "cpu2."
4. The corresponding temperatures are "25°C," "56°C," and "58°C," respectively.
5. All components have a status of "OK."
Component Status
With this integration script, you will be able to get monitoring insights on the following:
- Component ID
- Component Category
- Component Status

Fujitsu iRMC Component Status Overview
1. Displays the status of each component of the Fujitsu iRMC device using the Redfish API.
2. The current system status is "Running."
3. Metrics have been consumed, showing a value of zero.
4. The sample period is set to five minutes.
5. The "Component Status" table includes three columns: Id, Category, and Status.
6. Example entries:
- Id: agent-systemmanagementsoftware, Category: System Management Software, Status: Prefail.
- Id: ambient-ambientsensors, Category: Air Inlet, Status: OK.
- Other components such as batt-3.0v-batterysensors and bios-systemfirmwaresensors are also marked OK.
7. An option to download this data as a CSV file is available through the "Download CSV" link.
MikroTik
Apply our custom scripts to extract crucial information about your MikroTik systems. You’ll be able to track as follows:
- CPU Usage
- Memory Usage
- System Information
- Hardware Sensors
CPU, Memory Usage, and System Information
The script uses the SSH protocol and will help you to extract properties such as:

MikroTik System Information and Usage Overview
1. The system status is labeled as "RUNNING" with a sample period of 5 minutes and metrics consumed as zero.
2. A list of variables is displayed with three columns: Name, Value, and Last Change.
3. Name column includes variables like CPU Count, CPU Frequency, CPU Usage, Firmware Version, HD Usage, and Memory Usage.
4. Value column shows current measurements:
- CPU Count: 1
- CPU Frequency: 650 MHz
- CPU Usage: 19%
- Firmware Version: 7.13 (stable)
- HD Usage: 41.8%
- Memory Usage: 42.8%
5. Last Change column indicates all values were updated "a minute ago."
6. Option to download the data as a CSV file is available.
Hardware Sensors
Use the script to extract and monitor MikroTik routers, access points, and switch details like:

MikroTik Hardware Sensors Dashboard View
1. The current status is "RUNNING" with the text highlighted in green, indicating that the hardware sensors are active.
2. The sample period is set to "5 Minutes". Click on it to adjust the sampling frequency.
3. "Metrics Consumed" shows the value "4", referring to the number of metrics being monitored.
4. Under "Variables", a table lists different sensor readings:
- "Board Temperature 1" shows a value of "50 °C", updated 7 minutes ago.
- "POE Output Consumption" displays "33 W" with the last change 7 minutes ago.
- "PSU 1 Status" reads "ok", indicating it is functioning properly, with the last update 7 minutes ago.
- "Switch Temperature" records "56 °C", also updated 7 minutes ago.
SonicWall
Apply this pre-configured script to monitor the status of the following SonicWall security services together with their license information:

SonicWall Firewall Security Services Overview
1. The status of the SonicWall firewall is "RUNNING."
2. The sample period is set to "5 Minutes."
3. There is "1" parameter and "2" metrics consumed.
4. Under "Security services status and license," a table lists services:
- "anti-spam-service" is "Off" and not licensed ("No").
- "anti-spyware" is "On" and licensed ("Yes").
- "application-control" is "Off" but licensed ("Yes").
- "botnet-filter" is "Off" but licensed ("Yes").
ClearOne
The script uses the HTTP protocol and will help you to extract and monitor the following:

Device Monitoring Status Screen
1. Heading: "ClearOne Convergence" with a description indicating it shows properties for devices.
2. Status Section: Displays "Status: RUNNING" and indicates the sample period is "5 Minutes." Links to parameters with a count of "1" and metrics consumed as "0."
3. Variables Section: Contains a table with three columns: Name, Value, and Last change.
- "Firmware Version" has a value of "1.0.8.0," changed 16 minutes ago.
- "Locate Mode" is "false," updated 16 minutes ago.
- "Location" is "Unknown," with the last change 16 minutes ago.
- "Part Number" displays "910-3200-208-D;910-..." and was updated 16 minutes ago.
- "Model" shows "BMA 360D," with the last update 16 minutes ago.
- "Status" indicates "Healthy 40 minutes," changed 2 minutes ago.
- "Serial Number" is "1783-2312-40," last updated 16 minutes ago.
4. Download Option: Option to "Download CSV" is available on the upper right side of the table.
Additional MIBs
Additional MIB files are available for the following devices:
- EDS
- Bequant
- Cambium
- Q-SYS
- Ubiquiti Edge switch
- Lanse RPDU
- RoomAlert4E
Improvements
Execute Custom Scripts as soon as they are associated with the device
We are excited to announce a significant upgrade to our software platform, focusing on enhancing device management and operational efficiency. With the latest improvement, our software can now boost your capability to execute custom scripts immediately upon their association with a device. This pivotal enhancement ensures that the integration scripts are applied and ready for use with minimal delay.
Improved number of Configuration Management backups stored
With this update, you now have the capability to view and restore up to 40 configuration backup instances spanning a period of one year. This enhancement greatly expands your capacity to audit and recover the configurations of your network appliances when necessary. It also guarantees access to a thorough history of your network’s configurations.
By leveraging this feature, you gain unparalleled visibility and control over the evolution of your network. Additionally, it empowers you to develop more effective strategies for managing disasters and facilitating recovery. For detailed insights on utilizing this configuration management feature, please refer to our network configuration management guide.
Enhanced Script Testing Flexibility with Local Credential Use
We’re excited to unveil an improvement to our network monitoring software that extends the flexibility of our scripting framework. Users now have the capability to utilize local credentials for testing drivers.
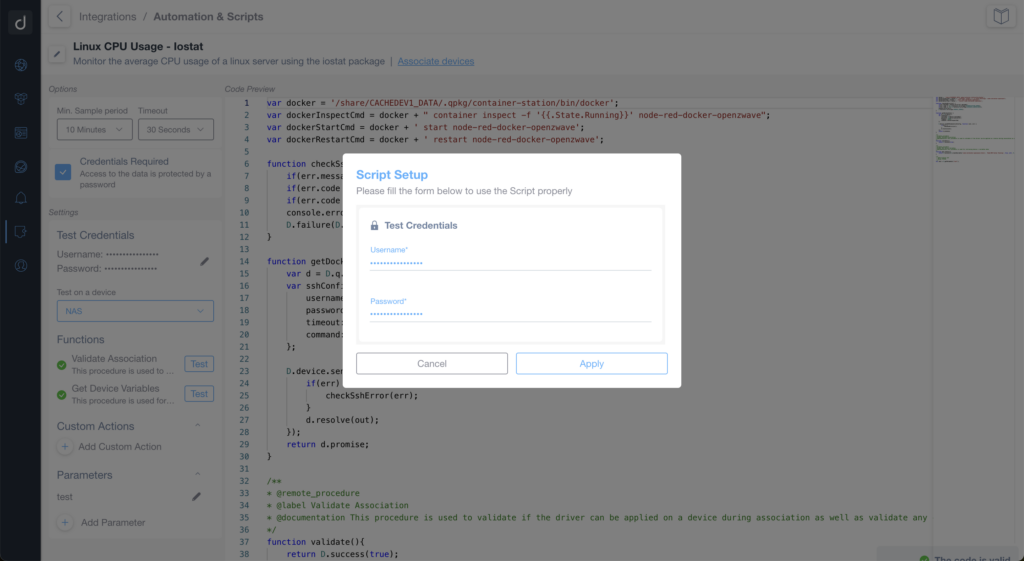
Script Setup in Automation & Scripts Integration
1. In the left pane, under "Credentials Required," enter your username and password in the "Test Credentials" section.
2. Select a device to test by choosing an option from the "Test on a device" dropdown menu.
3. In the pop-up modal titled "Script Setup," enter your username and password in the respective fields under "Test Credentials."
4. Click "Apply" to save the credentials and execute the script setup.
This enhancement allows for testing scripts with multiple sets of credentials, offering a broader range of experimentation and customization.
This flexible, user-centric upgrade is designed to streamline your script testing process and enhance your network monitoring efficiency.
Fix
We’ve fixed the following issues:
- Prevent Field Operators from viewing/accessing the Integrations section.
- Rocket Chat: Missing push notifications for new messages.
- In the marketplace account, agents were not reported correctly under Summary (all at 0).
- Portal – Broken GlassWire for business page.
- Device Configuration Restore events were not tracked on the Activity Log.
- Domotz host interface devices appear as important offline devices on the OpenSearch counter, even if they are not important.
- ConnectWise: Max length exceeding 100 characters results in an error.
- Custom Driver Variable Graph shows a different time in the point highlighted and the x-axis.
- Test credentials are not passed when testing a function.
- Cannot resize Monitoring Dashboard columns.
- Custom Driver Action execution via public API is not tracked on the activity log.
- Issues in the generation of periodic reports.
- MikroTik PoE Switch Unlock does not store device_management credentials.
- MikroTik interfaces – Timeout issue.
- Scripts were not saving credentials.
- Configuration management downloaded files cannot be re-imported without a long name.
- DHCP Requests Rate wrong device sort on Network Troubleshooting detail.
- Improved empty state for Activity Log view.
- Fix broken UI on some text fields.