
With Domotz network monitoring software you can monitor Linux machines and MAC OS via SNMP.
It is sufficient to install an SNMP deamon on the Linux machine and make sure that the Domotz agent is using the same read-only community for that device.
In this articles you can find a list of instructions to learn how to enable SNMP for Linux and Mac OS.
Here is a list of instructions for installing SNMP deamons on most popular Linux distributions and on Mac OS:
Red Hat Enterprise Linux (RHEL)
For more information about configuring SNMP in Domotz see here.
At the end of this article, you will also find a practical use case for monitoring through Domotz the HW resources of your Linux machine, and a template to achieve that.
How to enable SNMP on Linux
Debian
1. Installation
$ sudo apt-get update
$ sudo apt-get install snmpd
2. Configuration
Edit the file: /etc/snmp/snmpd.conf with a text editor of your choice.
Add the following line:
rocommunity public
Comment the line:
#agentAddress udp:127.0.0.1:161
Uncomment the line:
agentAddress udp:161,udp6:[::1]:161
Restart the snmpd service:
$ /etc/init.d/snmpd restart
Ubuntu
1. Installation
$ sudo apt-get update
$ sudo apt-get install snmpd
2. Configuration
Edit the file: /etc/snmp/snmpd.conf with a text editor of your choice.
Add the following line:
rocommunity public
Comment the line:
#agentAddress udp:127.0.0.1:161
Uncomment the line:
agentAddress udp:161,udp6:[::1]:161
Restart the snmpd service:
$ /etc/init.d/snmpd restart
3. Allow SNMP ports in Firewall
Execute the following commands to allow necessary ports:
$ ufw allow 161/udp
$ ufw allow 162/udp
CentOS
1. Installation
$ yum update
$ yum install net-snmp
2. Configuration
Edit the file: /etc/snmp/snmpd.conf
Add the following line:
rocommunity public
Replace the line below:
view systemview included .1.3.6.1.2.1.25.1.1
with the following line:
view systemview included .1.3.
Restart the snmpd service:
$ /etc/init.d/snmpd restart
3. Allow SNMP ports in Firewall
Execute the following commands to allow necessary ports:
$ firewall-cmd --zone=public --add-port=161/udp --permanent
$ firewall-cmd --zone=public --add-port=162/udp --permanent
$ firewall-cmd --reload
FreeBSD
1. Fetch Ports collection and install Installation
$ portsnap fetch
$ portsnap extract
$ cd /usr/ports/net-mgmt/net-snmp
$ make install clean
2. Configuration
Copy the following configuration file:
cp /usr/local/share/snmp/snmpd.conf.example /usr/local/etc/snmpd.conf
Add the following line:
rocommunity public
Comment the line:
#agentAddress udp:127.0.0.1:161
Uncomment the line:
agentAddress udp:161,udp6:[::1]:161
3. Allow SNMP ports in Firewall
Edit the /etc/rc.conf file and add the following lines:
snmpd_enable=”YES”
snmpd_conffile=”/usr/local/etc/snmpd.conf”
Uncomment the line:
agentAddress udp:161,udp6:[::1]:161
4. Start the Service
$ service snmpd start
Edit the /etc/rc.conf file and add the following lines:
Red Hat Enterprise Linux (RHEL)
1. Installation
yum install net-snmp
2. Configuration
Edit the file: /etc/snmp/snmpd.conf
Add the following lines:
rocommunity public
agentAddress udp:161,udp6:[::1]:161
Start the snmpd service:
systemctl enable snmpd && systemctl start snmpd
3. Allow SNMP ports in Firewall
Execute the following commands to allow necessary ports:
firewall-cmd --zone=public --add-port=161/udp --permanent
firewall-cmd --zone=public --add-port=162/udp --permanent
firewall-cmd --reload
Edit the /etc/rc.conf file and add the following lines:
How to enable SNMP on Mac OS
1. Configuration
Edit the file: /etc/snmp/snmpd.conf
Add the following line:
rocommunity public
2. Start the SNMP service
Execute the following commands to allow necessary ports:
sudo launchctl load -w /System/Library/LaunchDaemons/org.net-snmp.snmpd.plist
Monitoring SNMP OiD through Domotz
Once the SNMP daemon has been configured on the Linux machine, and the Community Strings (for V1 and V2 – or Credentials for V3) are matching between the Linux machine and the Domotz Agent, Domotz will automatically browse and report all the possible MIBs available for that specific Linux machine.
In particular, you can search with Domotz for any possible specific OiD available on that specific Linux Machine.
Open the Domotz App or the WebApp. Identify your Linux Machine. Under the tab SNMP/TCP click on Add an SNMP Sensor. You will be proposed with the entire list of SNMP OiD available for that specific device, and the possibility to search among the descriptions (available in the MIB available for that device):
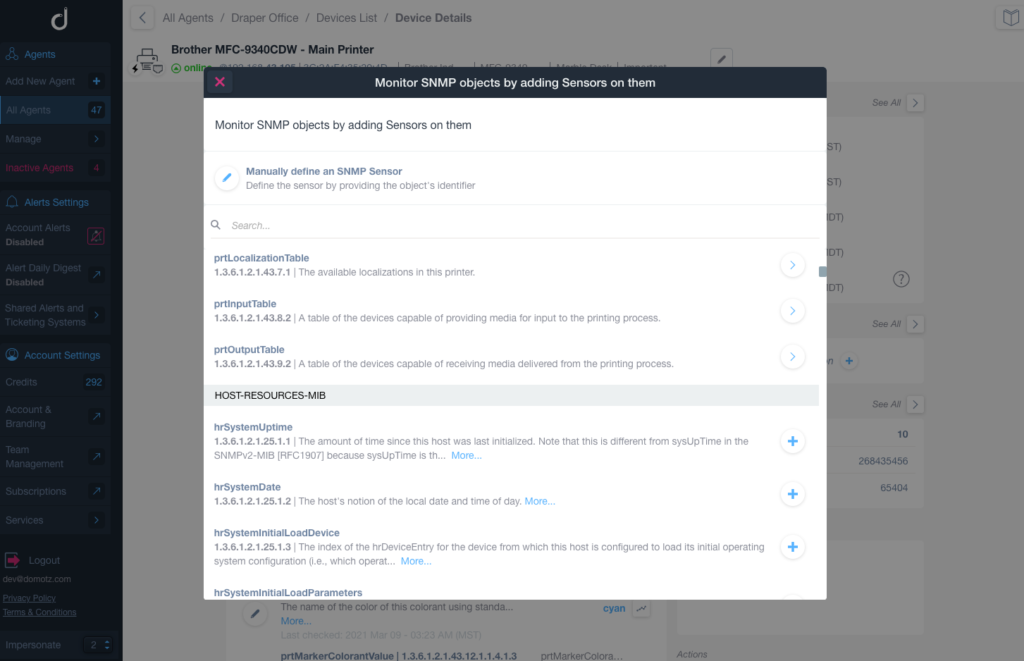
Monitor SNMP Objects by Adding Sensors in a Printer Interface
1. Navigate to the "Monitor SNMP objects by adding Sensors on them" window.
2. Select "Manually define an SNMP Sensor" to input the sensor by providing the object's identifier.
3. Use the search bar to find specific SNMP objects.
4. Select entries such as "prtLocalizationTable," "prtInputTable," and "prtOutputTable" for available localization and device tables for input and output related to the printer.
5. Examine HOST-RESOURCES-MIB entries like "hrSystemUptime" and "hrSystemDate" to monitor the host's operating details.
6. For additional parameters, choose entries like "hrSystemLoadDevice" which details device loading capacities.
7. Use the plus symbols next to each entry to expand and add sensors.
You can for instance search for all the possible OiD which contains the word “CPU” in their description, and then add the relevant ones.
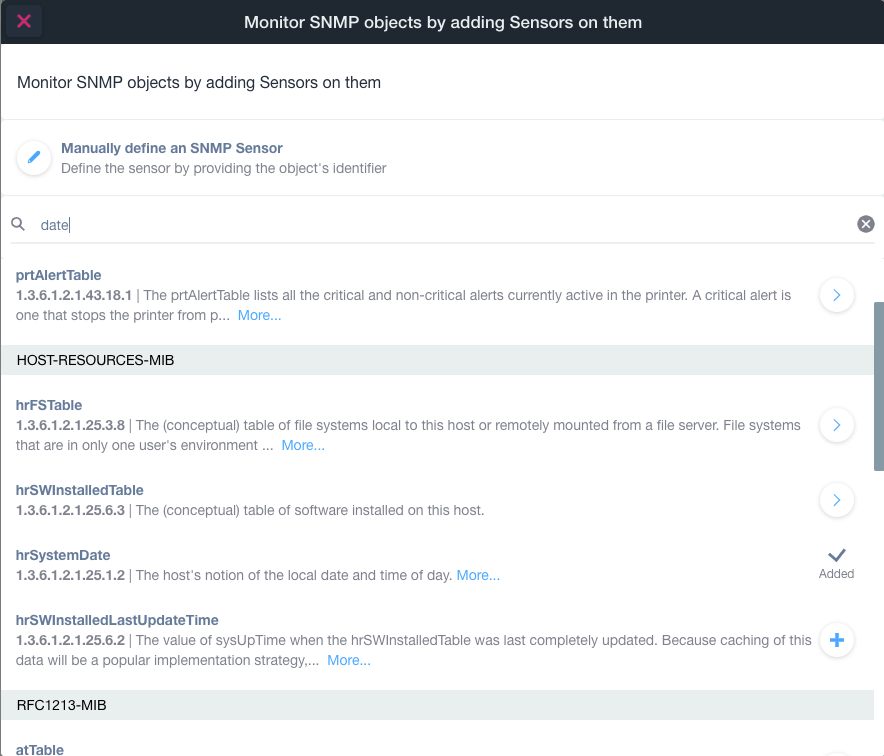
Monitor SNMP Objects by Adding Sensors
1. Select "Manually define an SNMP Sensor" to define the sensor by providing the object's identifier.
2. Use the search bar to locate specific tables or data by typing keywords, such as "date."
3. Review the available tables listed:
- `prtAlertTable`: Contains critical and non-critical printer alerts.
- `hrFSTable`: Describes file systems local to the host.
- `hrSWInstalledTable`: Contains software installed on the host.
- `hrSystemDate`: Provides the host's local date and time; marked as "Added."
- `hrSWInstalledLastUpdateTime`: Shows last update time for installed software.
4. Click "More..." for detailed information about each table.
5. Add sensors to the selected tables by selecting the "+" icon.
By doing this, you can start monitoring the resource consumptions of your Linux machine.
Below in this article a few example of resource usage statistics extracted by Domotz out of a Linux machine using this mechanism.
CPU Usage
Through Domotz you can monitor either the spikes in the CPU usage as recorded by the CPU Load on 1 Min average:
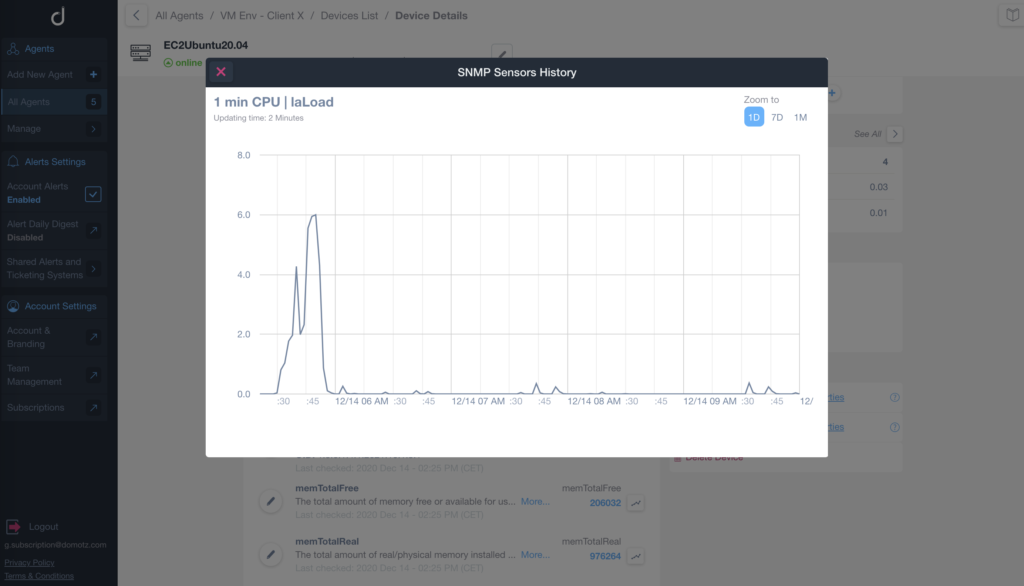
Viewing CPU Load History on SNMP Sensors
1. The title "SNMP Sensors History" indicates the graph's subject.
2. The graph shows "1 min CPU | laLoad" over time, updated every two minutes.
3. The Y-axis represents CPU load, ranging from 0.0 to 8.0.
4. The X-axis displays time, noting significant changes at specific intervals, such as peaks around "12/14 06 AM".
5. The "Zoom to" option allows selection from "1D" (one day), "7D" (seven days), or "1M" (one month) for viewing the data over different time frames.
6. The graph helps track CPU performance trends and potential load issues.
Or the sustained CPU usage as recorded by the CPU Load on 15 Min average:
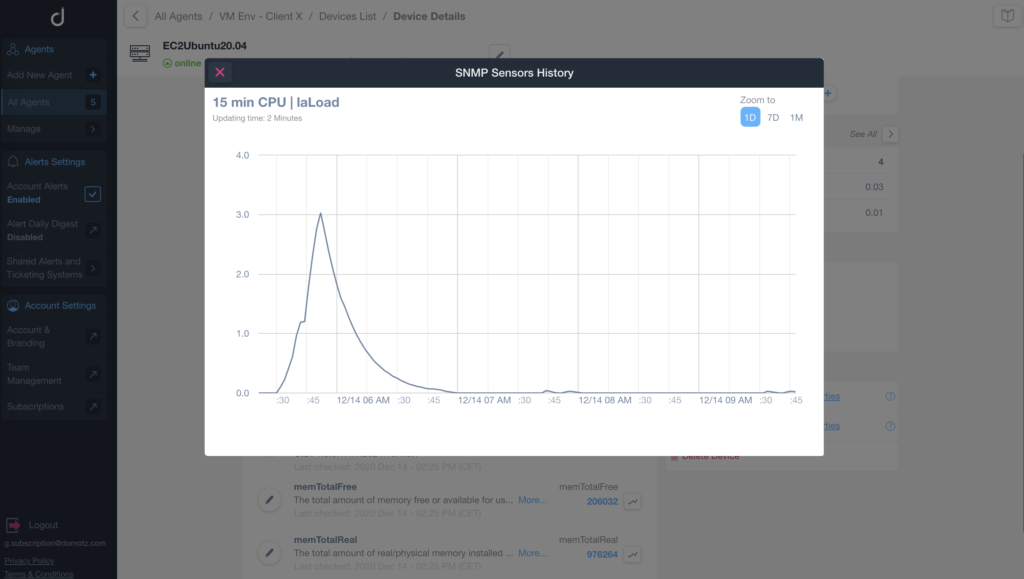
Monitoring CPU Load Over Time
1. The graph shows the 15-minute average CPU load over a selected time frame, with a peak around 12/14 at 00:30 reaching just above 3.0.
2. The X-axis represents the date and time, while the Y-axis measures the CPU load value.
3. Use the 'Zoom to' option on the right to adjust the view to different time spans: 1 Day, 7 Days, or 1 Month.
4. The 'Updating time' indicates the data refresh interval, which is set to 2 minutes.
It is also possible to monitor the residual (idle) CPU available in the server:
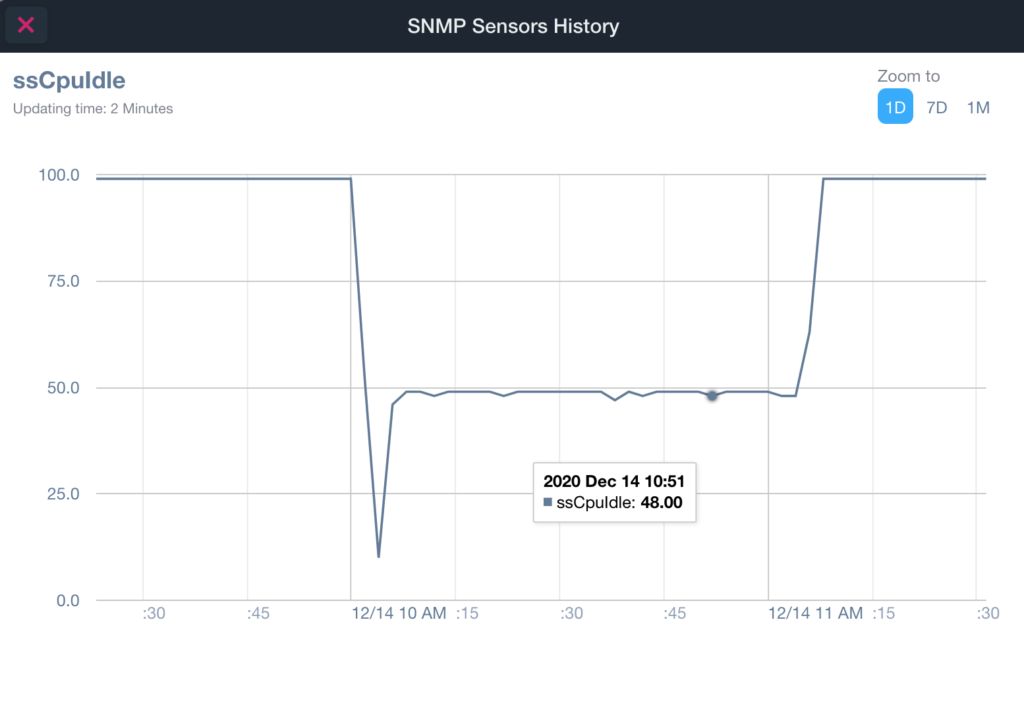
SNMP Sensors History Graph
1. The graph displays the history of the "ssCpudle" sensor reading over time.
2. The vertical axis represents the sensor's value, ranging from 0.0 to 100.0.
3. The horizontal axis shows the date and time, concentrated around December 14th in the morning.
4. A notable drop in the sensor value occurs from 100.0 to below 25.0, followed by fluctuations and a return to 100.0.
5. There is an updating interval of every 2 minutes.
6. A data point is highlighted for December 14th at 10:51 AM, showing the sensor value at 48.00.
7. A zoom option is available in the top right to adjust the view to 1 day, 7 days, or 1 month.
Memory Usage
Through Domotz you can monitor the total available Memory on the Linux machine, or even more importantly the residual memory still free and available on the same:
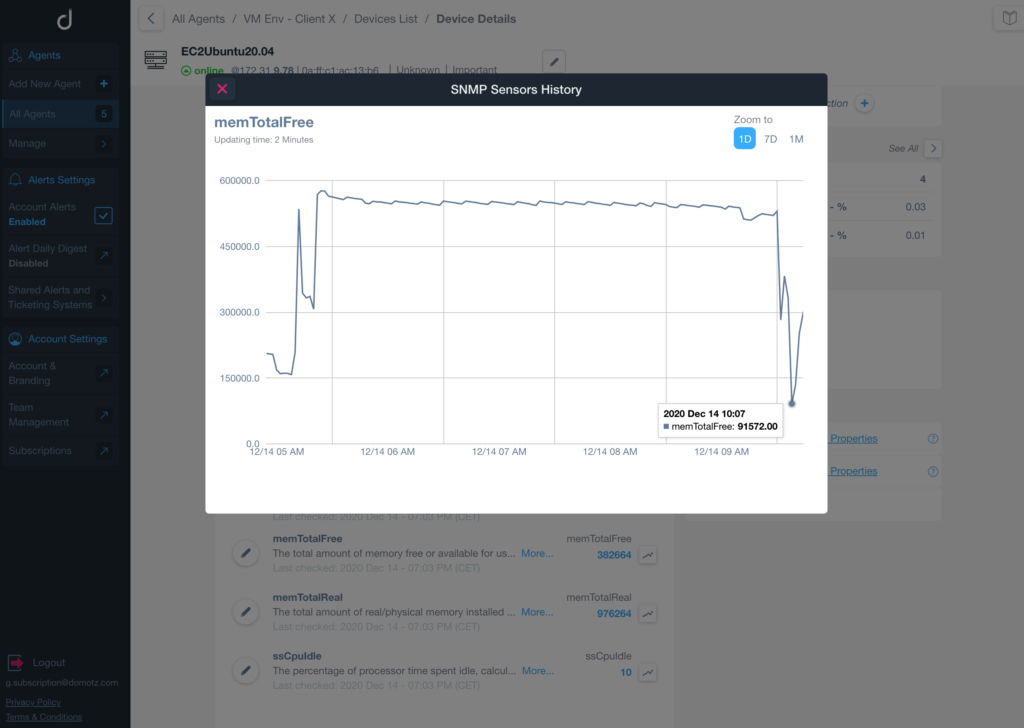
Graph of 'memTotalFree' memory over 1-day period.
1. The graph shows memory usage labeled 'memTotalFree' on the y-axis, ranging from 0 to 600,000, and the timeline on the x-axis covering 12/14 05 AM to 12/14 09 AM.
2. Memory levels peak near 450,000 and drop sharply at two points, around 12/14 05 AM and 12/14 09 AM.
3. A tooltip indicates on December 14 at 10:07 AM, the memory value was 91,527.00.
4. Zoom options are available for 1 day, 7 days, or 1 month.
5. The graph updates every 2 minutes, providing a real-time view of memory availability.
Volume or Storage occupancy
It is also possible to add the monitoring of any volume or storage and their occupancy via the default hrStorageTable:
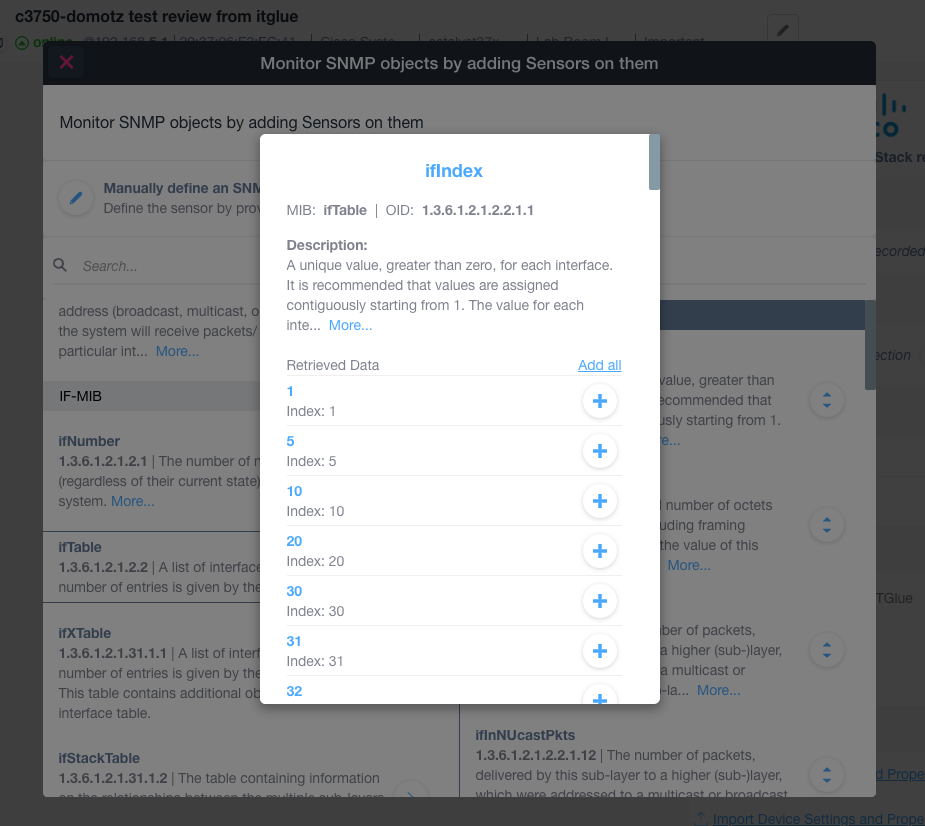
Add Sensors to SNMP Objects by Using ifIndex
1. Open the "Monitor SNMP objects by adding Sensors on them" window.
2. Locate the "ifIndex" section which includes the MIB "ifTable" and OID "1.3.6.1.2.1.2.2.1.1".
3. Read the description explaining that each interface should have a unique value greater than zero, starting from 1.
4. View the "Retrieved Data" list to see available indices (1, 5, 10, 20, 30, 31, 32) with corresponding index values.
5. Use the "Add all" option to add sensors for all the listed indices at once.
For more information about configuring SNMP in Domotz see here.
Alerts on resource usage
Both in the case of the above examples, you can configure alerts so that you are notified if any unexpected load is affecting your server or Linux machine.
For example you can monitor if the CPU Idle at a certain point goes below a certain threshold, or if the residual memory is too low to have a safe environment.
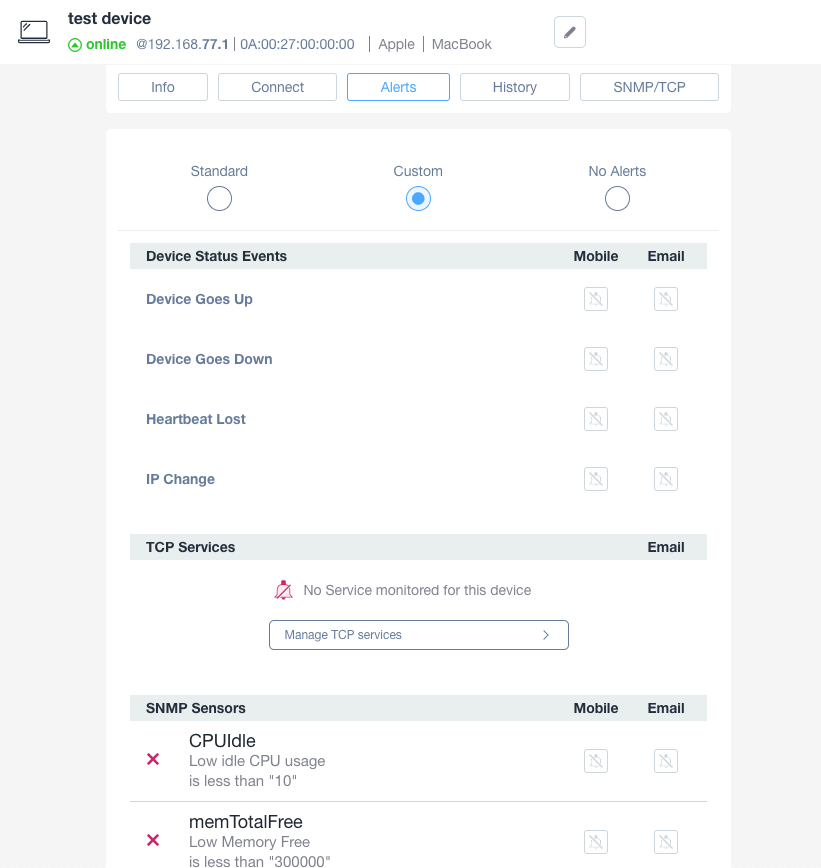
Device Alert Configuration Screen
1. At the top, the device details are displayed, showing "test device" as online with its IP address and MAC address, noted as an Apple MacBook.
2. Below, several tabs are available: Info, Connect, Alerts, History, and SNMP/TCP. The Alerts tab is currently active.
3. The alert preference is set to Custom, with options for Standard and No Alerts also visible.
4. Under Device Status Events, alerts like Device Goes Up, Device Goes Down, Heartbeat Lost, and IP Change are listed. Icons indicate that both mobile and email notifications are disabled for these events.
5. The TCP Services section indicates no service is currently monitored for this device, with an option to Manage TCP Services.
6. In the SNMP Sensors section, two alerts are triggered:
- CPU Idle warning when low idle CPU usage is below "10".
- memTotalFree warning when low memory free is less than "300000".
Both alerts show mobile and email notifications as disabled.
In order to configure alerts, visit the Alert tab, then select the Custom type under the Personal Alerts, and Configure an SNMP Alert.
You will be be provided with the option to select the previously added SNMP OiD as input for the alert.
You can then either decide to receive the notification via Email or Push Notification, as Personal Alerts, or receive the notifications on your preferred channel, via the Shared Alert configuration:
- through shared email addresses
- Your ticketing system or PSA tool integrated with Domotz (e.g. Datto Autotask, ConnectWise Manage, Syncro MSP, Zendesk, Freshservice, etc)
- Your company chat system (e.g. Microsoft Teams or Slack)
- Any Web Server through Web Hooks (or possible third party integrations via Zapier or Node-Red)
Add Resource Usage monitoring via templateing
With Domotz it is possible to configure the monitoring and alerting via SNMP for a specific Linux machine (or generically for any server) and then use that configuration as a template for all the other servers that need to be monitored.
This can be achieved by the Export/Import Device Settings and Properties capability.
Once you have completed the configuration of the SNMP parameters you are willing to monitor for a Linux machine, and the alerts’ thresholds to get notified, click on the Export Device Settings and Properties.
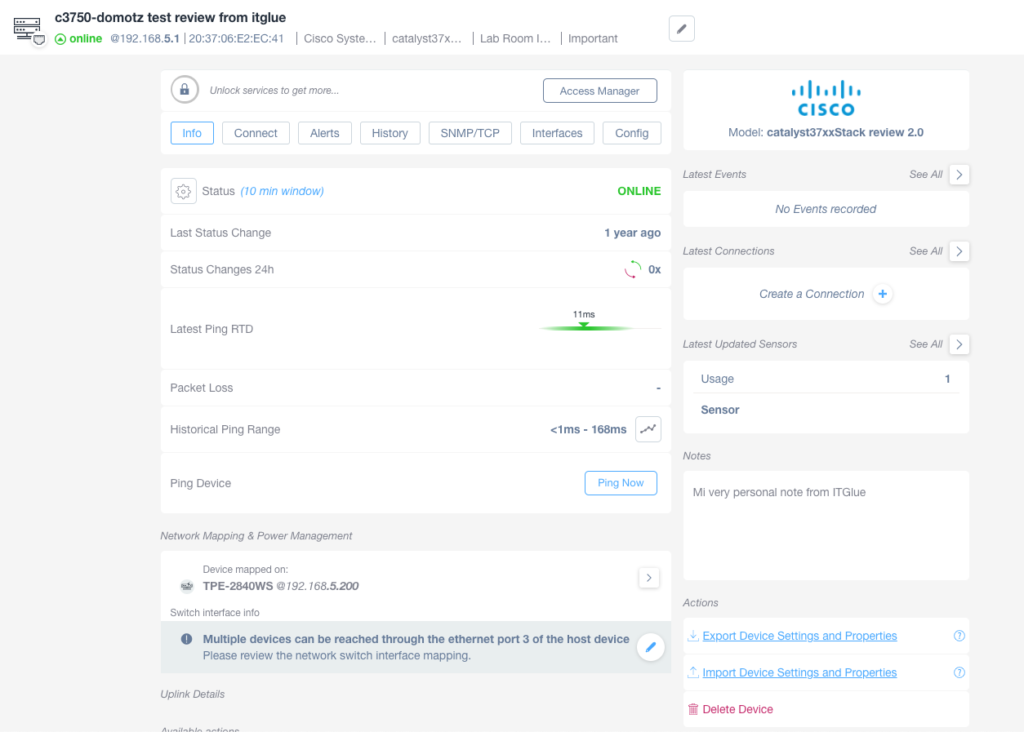
Network Device Monitoring Interface Overview
1. The top left section displays the device name "c3750-domotz test review from itglue" with an online status shown in green, indicating active monitoring. The device IP address is 192.168.5.1, and the MAC address is 20:37:06:E2:EC:41.
2. Below are tabs for various settings: Info, Connect, Alerts, History, SNMP/TCP, Interfaces, and Config, allowing navigation to detailed sections.
3. The main panel shows the current status as "ONLINE" with no status changes in the last 24 hours. A recent ping returned in 11ms, with historical ping range noted as "<1ms - 168ms."
4. A "Ping Now" button is available to initiate a new ping test.
5. The "Network Mapping & Power Management" section indicates the device "TPE-2840WS" is mapped to IP 192.168.5.200. A warning advises that multiple devices are reachable through Ethernet port 3, suggesting a review of the switch interface mapping.
6. The right-hand pane includes sections for Latest Events (none recorded), Latest Connections (option to create a new connection), and Latest Updated Sensors listing usage and sensor count.
7. A Notes field contains a personal note from ITGlue.
8. Actions available at the bottom include options to export or import device settings and properties, and an option to delete the device.
A json file (like a template file) is generated and saved on your client with all the Domotz settings and properties for that specific device.
This same template json file can then be edited (e.g. to replace or remove some areas) and then used to apply the same SNMP settings (e.g. OiD to be monitored and their threshold) to all the other Linux machines that you are monitoring through Domotz.
This can be achieved from the Global Search and Manage functionality. Search for all the Linux machines you want to apply the template, select them with the multi-select check box, and then click on Import Device Settings and Properties:
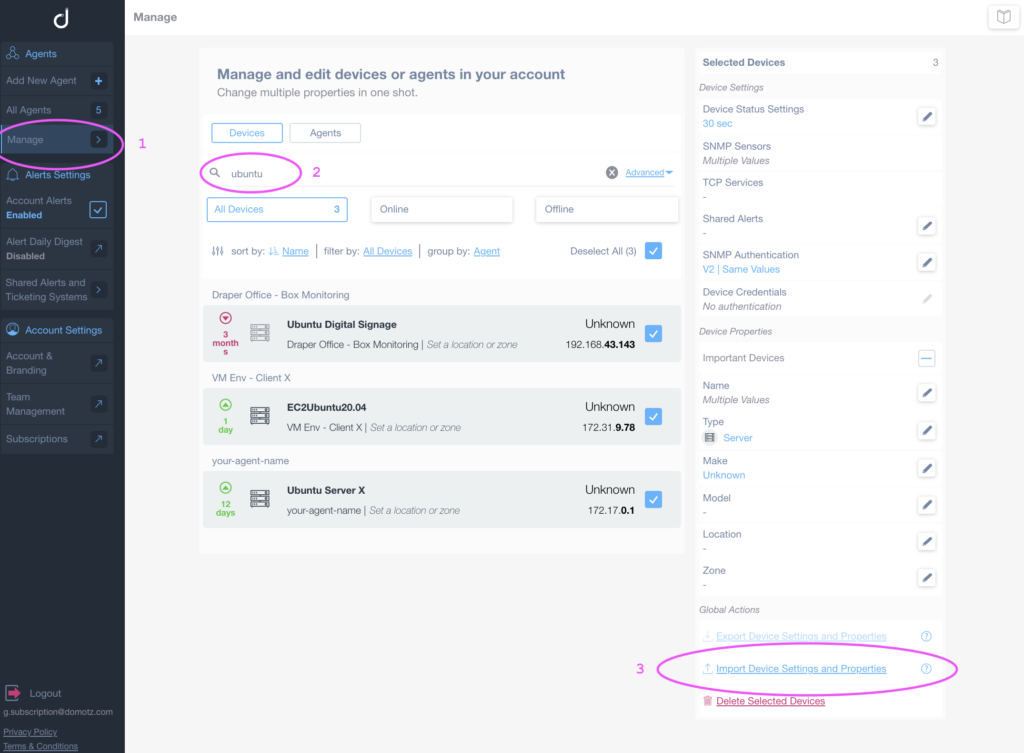
Managing and importing device settings and properties in your account.
1. In the left sidebar, navigate to "Agents" and select "Manage."
2. In the search bar on the main screen, type "ubuntu" to filter devices.
3. In the "Selected Devices" section on the right, click "Import Device Settings and Properties" to import settings for the selected devices.
Preconfigured Template for Linux Machine Resource usage Monitoring
The following file can be used as a baseline to build a template for monitoring resource usage of your Linux Machine:
In particular, once used for the Import Device Settings and Properties functionality, it will create 6 SNMP sensors (on CPU and Memory usage) and two triggers (alerts) on the usage of those resources:
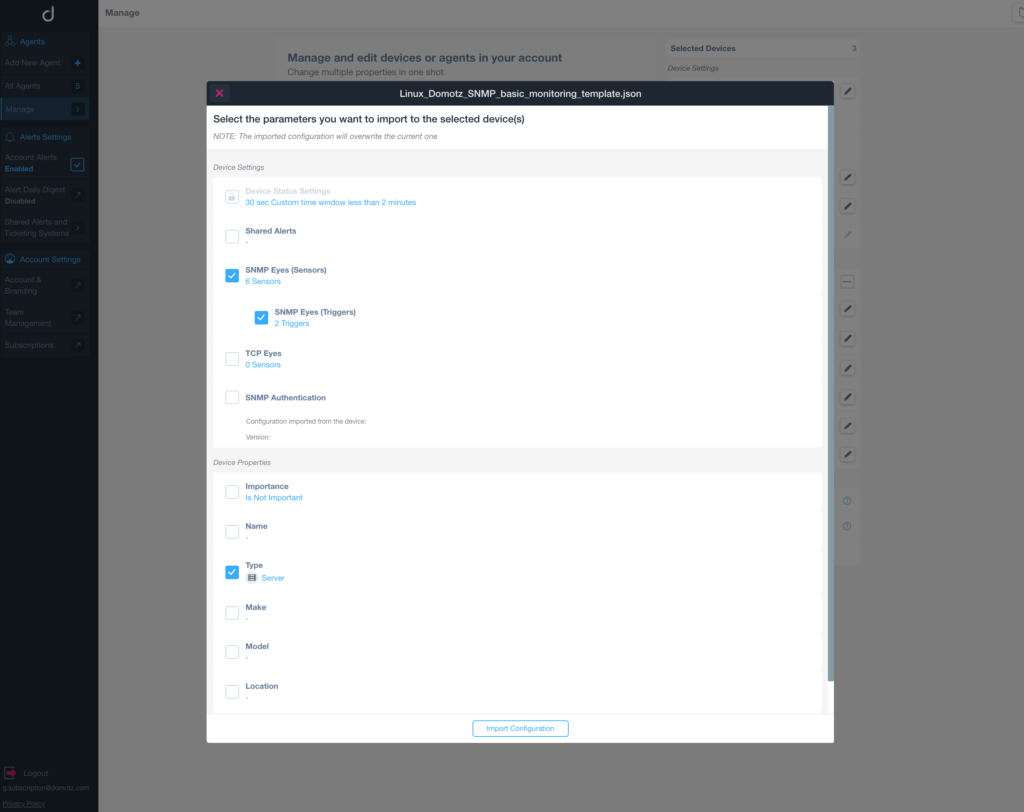
Import Device Configuration Options
1. In the pop-up window titled "Linux_Domotz_SNMP_basic_monitoring_template.json," you can select parameters to import to the device(s).
2. Under "Device Status Settings," notice that "30 sec Custom time window less than 2 minutes" is indicated.
3. For "Device Settings," you can select "Shared Alerts," "SNMP Eyes (Sensors)" with 6 sensors, and "SNMP Eyes (Triggers)" with 2 triggers.
4. Options available also include "TCP Eyes" and "SNMP Authentication," though these are not selected.
5. Under "Device Properties," select options like "Importance," "Name," and "Type," the latter is set to "Server."
6. Additional properties such as "Make," "Model," and "Location" can also be selected, but they are not currently chosen.
7. Click "Import Configuration" to apply the selected settings to the device(s).
Each device will then have the SNMP and TCP configured with the OiDs for monitoring CPU and Memory usage via SNMP:
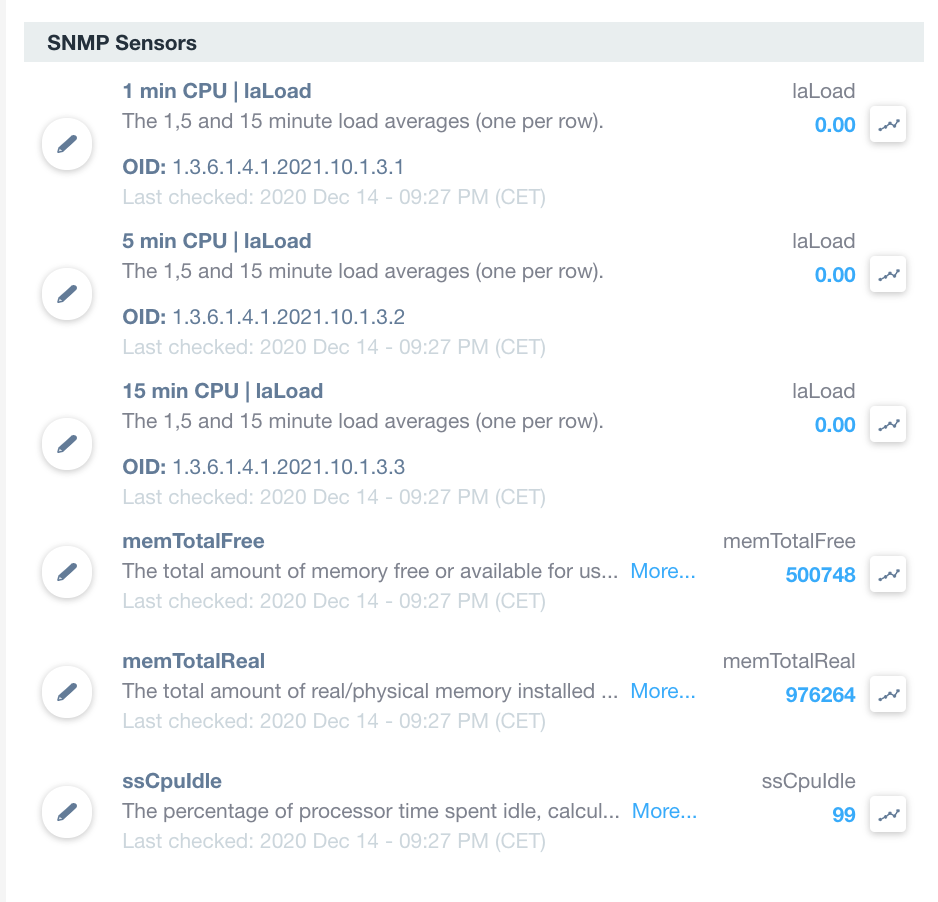
SNMP Sensors Information Panel
1. The "1 min CPU | laLoad" section shows the 1, 5, and 15 minute load averages. The OID is 1.3.6.1.4.1.2021.10.1.3.1, and the last checked time is Dec 14, 2020, at 09:27 PM (CET). The load value is 0.00.
2. The "5 min CPU | laLoad" section also displays load averages for 1, 5, and 15 minutes. The OID is 1.3.6.1.4.1.2021.10.1.3.2, with the same last checked time and a load value of 0.00.
3. The "15 min CPU | laLoad" panel indicates similar load averages with OID 1.3.6.1.4.1.2021.10.1.3.3, last checked at the same time, and a load value of 0.00.
4. The "memTotalFree" section details the total amount of free or available memory. Last checked time is Dec 14, 2020, at 09:27 PM (CET) with a value of 500748.
5. In "memTotalReal," it displays the total physical memory installed. The value recorded is 976264, with a similar last checked timestamp.
6. The "ssCpuIdle" section indicates the percentage of processor time spent idle at 99, with a last checked timestamp matching the other entries.