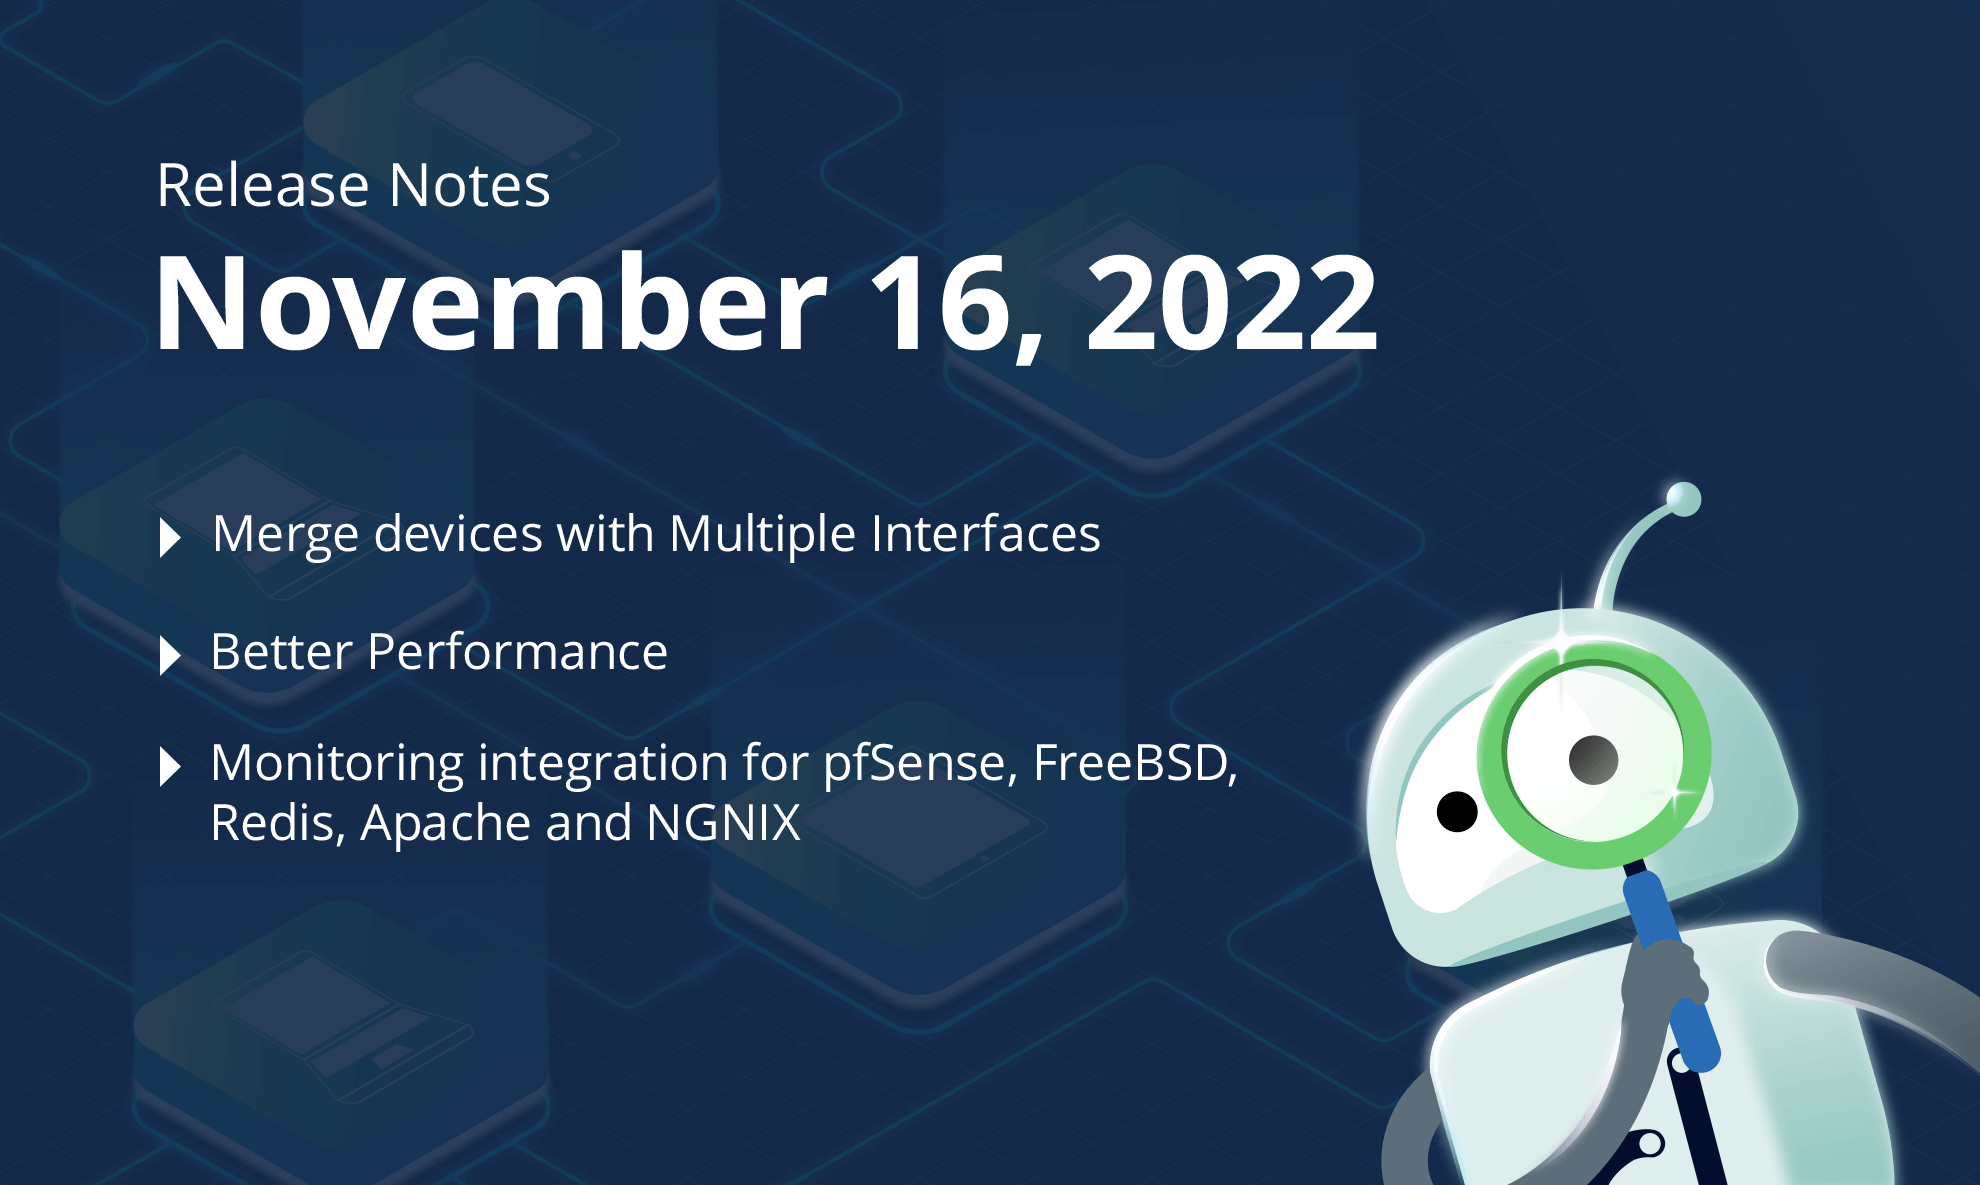
We’ve just released exciting new features on Domotz. This month’s exciting features include support for devices with multiple Network Interfaces (so you can group them into a single item), a New Sites Explorer with improved performance, and a bunch of monitoring integrations for different cloud systems.
In summary, here’s what’s new on Domotz this month.
- Group different entities to support devices with multiple Network Interface Cards
- New Sites-Explorer with better performance
- pfSense Monitoring: Monitor and Analyze the configuration and performance of your pfSense system and the FreeBSD OS hosting it
- Redis performance monitoring
- Apache HTTP Server Monitoring
- NGNIX Web Server monitoring
- Custom Integrations: each device now reports the status of an executing script
- Possibility to select all devices in the integration with Syncro and IT Glue for Asset Management synchronization
- New MIB files
What’s new
Group Network Interface Cards in one single device
You can now select two (or more) entities with different MAC addresses on a network and group them:
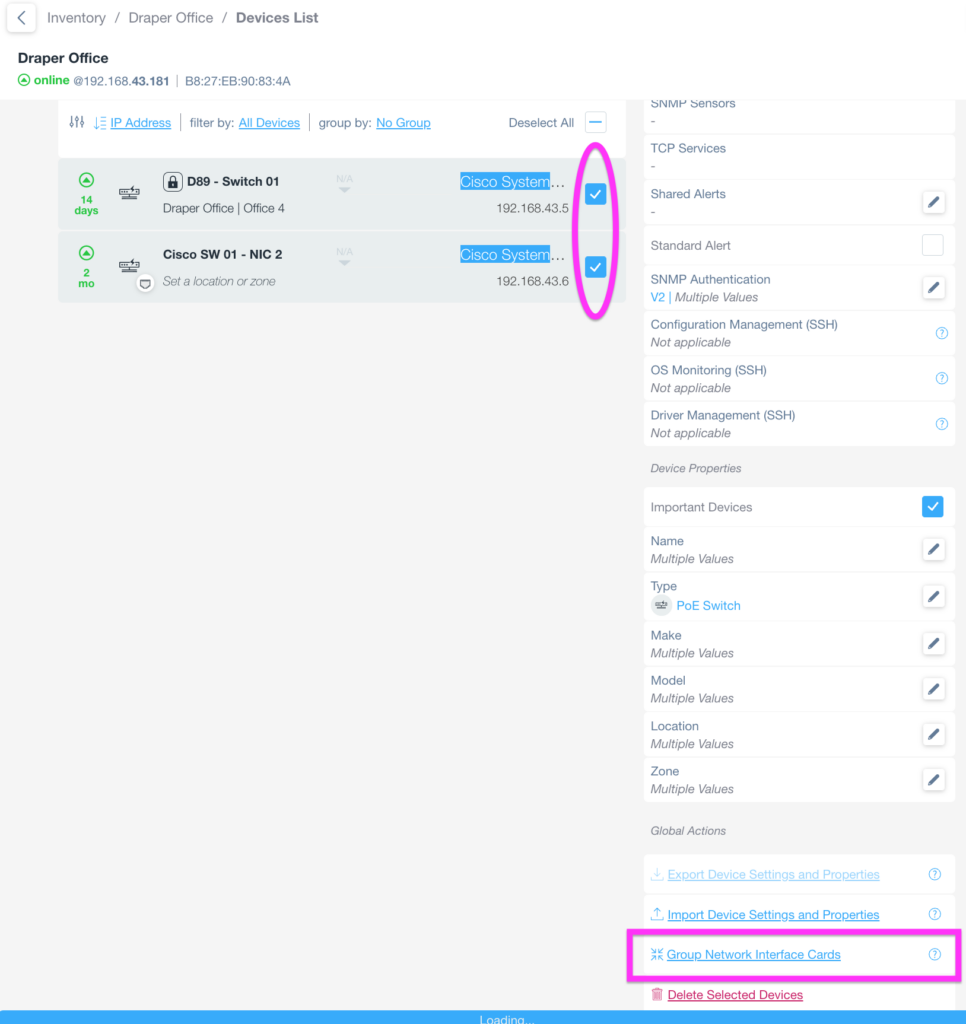
Once grouped, the two (or more) different Network Interface Cards (NIC) will be part of the same entity (Device).
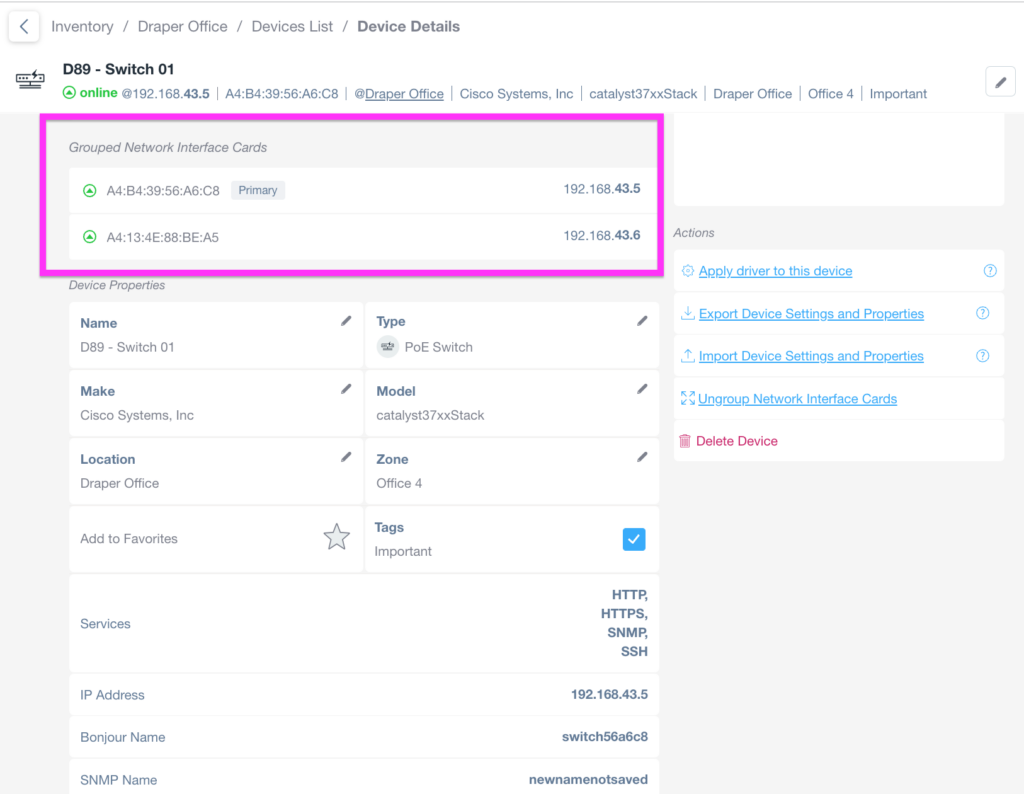
The Domotz Agent will monitor the two (or more) different Network Interface Cards separately. However, being grouped in one single device will allow you to set one rule for status monitoring, alerting, and other advanced monitoring mechanisms (e.g., Configuration Management and backup, SNMP and TCP monitoring, etc.).
For instance, this functionality enables a device with one ethernet card and one WiFi network card to appear as one single device (regardless of its connectivity to the local network). If the device switches from the ethernet NIC to the WiFi, it will continue to appear online.
You can also set advanced monitoring on the device (SNMP, TCP, etc.). However, this monitoring will be applied to the primary NIC selected (e.g., in the case of a Managed Switch with multiple NICs, the primary NIC very likely is the one on the management network, which allows monitoring via SNMP).
New Monitoring Dashboard – simplified UX.
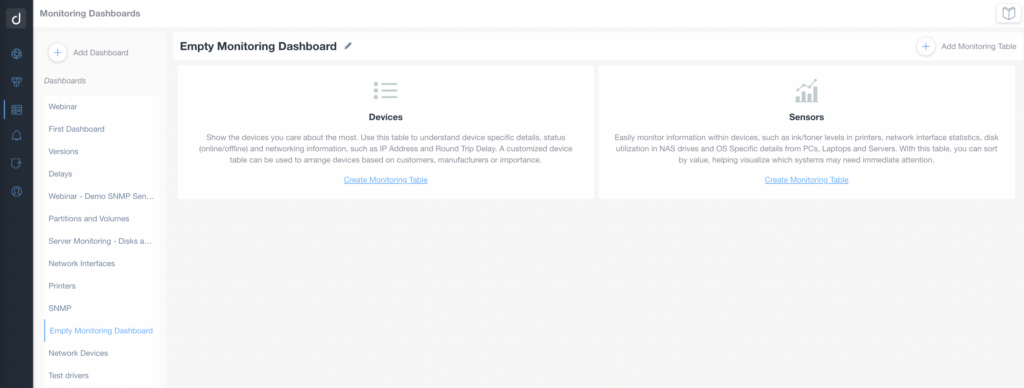
When creating a new Monitoring Dashboard, now we’ll guide you through the types of tables you can create:
Our new menu shows the available SNMP Pre-Configured sensors, the Operating System sensors, and other possible sensors that you can add, allowing you to quickly choose which to create:
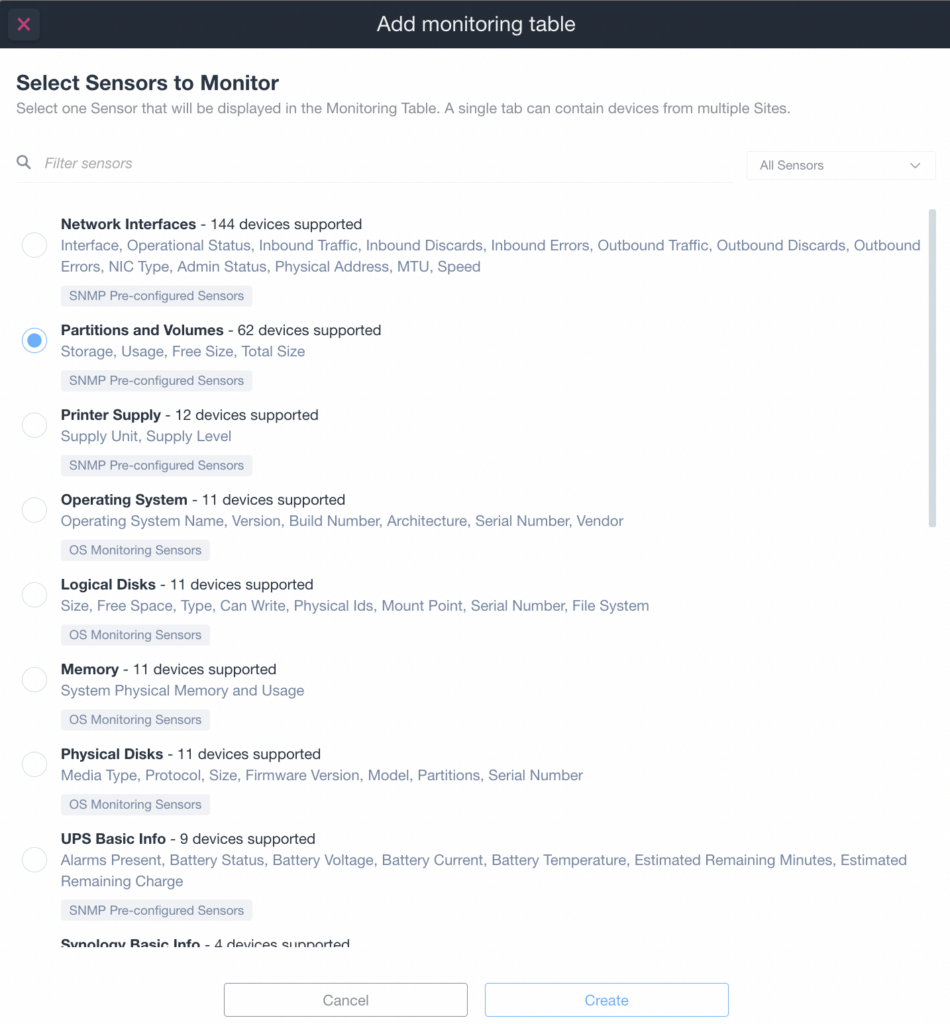
We’ll then guide you to select the list of devices you want to add to the monitoring table.
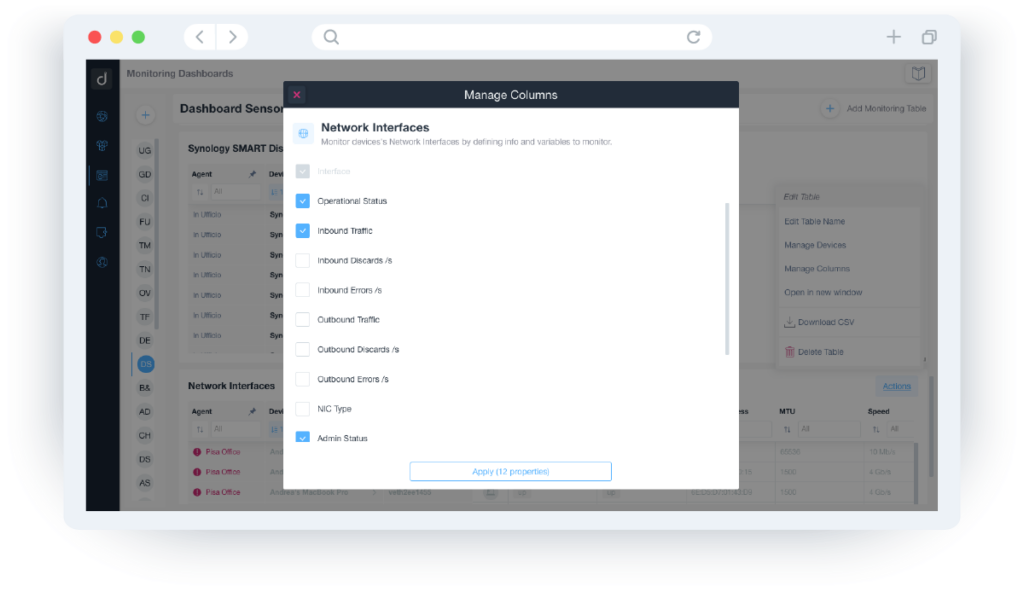
Moreover, it is now possible also to manage columns for your device tables, and we’ve now extended this to sensors tables such as pre-configured SNMP sensors. Now you can create a monitoring table for your SNMP sensors and select the columns you want to see.
Monitor pfSense with Domotz
We’ve got a new monitoring integration for pfSense. You can now monitor a pfSense instance directly through Domotz. Leveraging our Custom Integration Drivers framework, you can proactively monitor the configuration and performance of your pfSense server.
The new monitoring integration allows you to identify and monitor the configuration of your system automatically, as well as proactively monitor the gateway status, the ingress/egress statistics, and more.
For detailed guides on getting started, visit the pfSense Monitoring web page.
FreeBSD monitoring with Domotz
We’ve got a new monitoring integration for FreeBSD too. Alongside monitoring a pfSense system, you can also use new Custom Integration scripts for monitoring a FreeBSD server.
The new integration allows you to automatically identify and monitor the FreeBSD OS in terms of rule configurations, daemon status, interface status, process performance, and more:
For detailed guides on getting started, visit the FreeBSD Monitoring web page.
Redis monitoring with Domotz
We’ve also got a new monitoring integration for Redis. You can now allow Domotz to perform a Redis system monitoring. Leveraging our Custom Integration Drivers framework, you can proactively monitor the configuration and performance of your Redis server.
The new integration allows you to automatically identify and monitor the Redis system in terms of configurations, resource consumption (memory, CPU, etc.), cluster definition, replication statistics, connected client information, and more:
Please visit the Redis Monitoring web page for detailed guides on getting started.
Apache HTTP Server monitoring with Domotz
You can now allow Domotz to monitor and analyze the performance of an Apache HTTP Server. Leveraging our Custom Integration Drivers framework, you can proactively monitor the configuration and performance of your Apache2 server.
The new integration allows you to automatically identify and monitor the Apache HTTP Server in terms of configurations, processes, child servers, clients, mod_status parameters, and more:
For detailed guides on getting started, visit the Apache Monitoring web page.
Ngnix monitoring with Domotz
We’ve got a new monitoring integration for Nginx. You can now use Domotz for monitoring your Ngnix servers. Leveraging our Custom Integration Drivers framework, you can proactively monitor the configuration and performance of your Ngnix server.
The new integration allows you to automatically identify and monitor the Ngnix Server in terms of configurations and statistics about ActiveState processes, connections, tasks, and more:
For detailed guides on getting started, visit the NGINX Monitoring web page.
Improvements
New Sites Explorer with better performance
Our Engineering team has always invested resources in improving your user experience as much as possible.
This time, the team has built an entirely new Sites Explorer view. The User Interface is similar to the previous one:
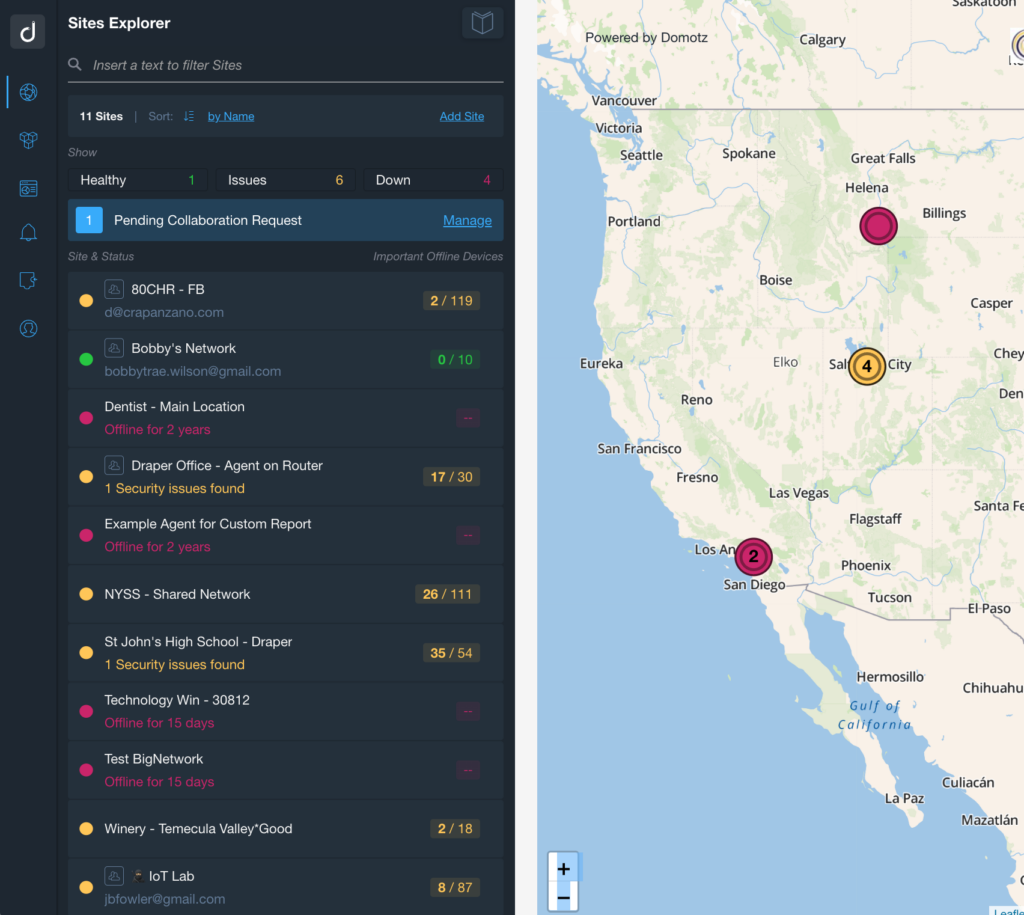
However, we’ve significantly improved the background API requests to the Domotz cloud infrastructure.
These performance increases are significant for Domotz accounts with tens, hundreds, or thousands of Domotz Agents under the same account.
When comparing the performance on the same account between the “old” Sites Explorer and the “new” sites explorer, the results are staggering! We now see roughly a 75% performance improvement. The loading time of the Domotz WebApp and Desktop App also now sees substantial performance enhancements too.
The following video shows a comparison in loading the “old” Sites Explorer vs. the “new” Sites Explorer on the same type of account with 3000 different Domotz Agents:
In particular, we can see that the running time for loading the “new” Sites Explorer (with 3000 different Domotz Agents) takes around 33 seconds. In comparison, loading the same amount of Domotz Agents with the “old” Sites Explorer takes approximately 50 seconds.
Moreover, the “new” Sites Explorer also significantly lowers the amount of memory used by the WebApp page and the Desktop App. Using the same account with 3000 Domotz Agents, the following is the “Activity Monitor” window (on Apple macOS) that shows the difference between the new view and the old view:

As we can see from the above screenshot, an Account with 3000 different Domotz Agents using the Sites explore sees a >100% reduction in memory use:
- 578 MB used by the “new” Sites Explorer
- 1.34 GB used by the “old” Sites Explorer
Private Subnet renamed into Routed Networks
For those monitoring via Layer-3 connections, other subnets will now find this functionality under the new name “Routed Networks.”
For more information, please refer to “Configure an External Routed Subnet Scan.”
Custom Integration – notification of failure
You now get a notification via email as soon as a specific Custom Integration on a device reports multiple failures.
Getting this notification means you can check if an integration is failing due to a change of status or configuration change on the device itself. Or you can check whether the Custom Integration script has changed and is no longer working on the devices using that script.
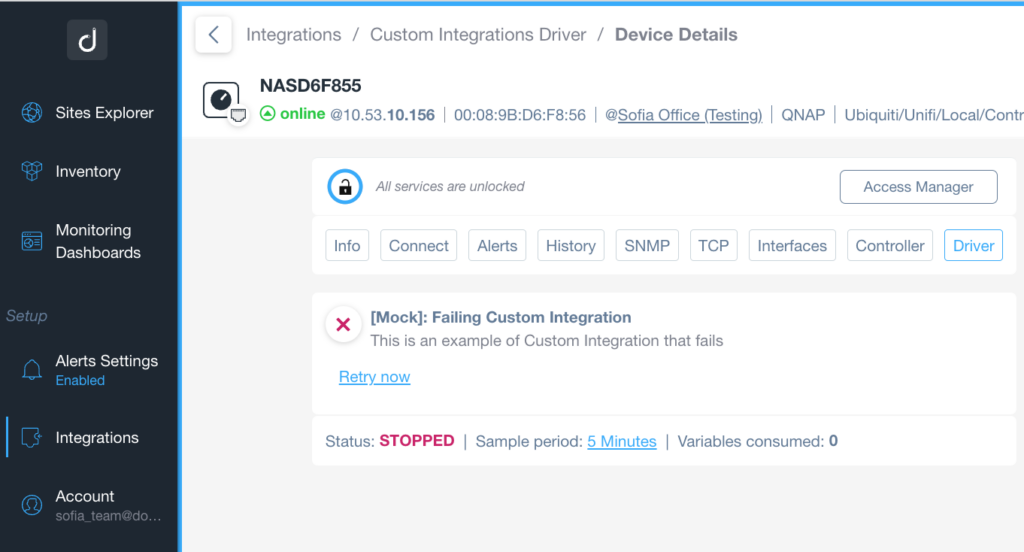
Moreover, each device reports the Custom Integration status. Finally, you can re-enable the failed Custom Integration on that specific device.
Syncro and IT Glue Integration – Asset Management
It is now possible to select all the available devices for each Agent to map them in Syncro and IT Glue for the Asset Management integration.
You can still filter devices based on the “Importance” tag.
Datto / Autotask PSA Integration – new APIs
We have migrated the integration to the Datto / Autotask PSA system (for the ticketing system part) from the old SOAP protocol to the new REST API protocol supported by Autotask.
Additional MIBs available in the Domotz Database
Additional MIB files are available for the following devices. Additionally, you can search for their OIDs from Domotz:
- DLINK-DGS-1210-Fx-SERIES
- FS Switches – s5810
- Peplink
- ZEEVEE
- Hikvision
- CPQIDA-MIB
Fix
We’ve fixed the following issues:
- The integration with FreshService (Ticketing System) has been fixed when “default_field” is required for agent support.
- There’s a fix for The integration with ConnectWise Manage (Ticketing System) to manage the closed statuses not updated on the connection update.
- There’s a fix for the Syncro Asset Management Integration: the issue in retrieving the Public IP address instead of the Private IP address.
- HaloPSA Ticketing System Integration: the issue of wrongly paginating the list of customers/locations retrieved from the HaloPSA platform has been fixed.
- When retrieving some SNMP variables as strings, it did not provide access to the history of the same.
- There’s a fix for an issue causing a misalignment in the number of Important Devices Offline reported in the Inventory tab.
- Local Recovery Network Interface on Domotz Box (192.168.112.112) was created in some cases, even if there was network connectivity to the cloud. This issue has now been fixed. Moreover, this interface (artificial) has been removed from the list of devices discovered by the Domotz Agent.
- Information about the Agent’s owner and name now displays when accepting an external collaboration with a Domotz Agent.
- There’s a fix for the issue preventing the correct identification and retrieval of Configuration Files for Dell OS 6 devices.
- When multiple new devices were discovered by a specific Domotz Agent simultaneously, only the first one in the list was analyzed correctly in the first minutes (leaving the rest of the devices to be further identified in subsequent iterations).
Known limitations
- Firstly, Monitoring Dashboards are currently limited to Monitoring Tables as Widgets. Furthermore, they do not report some variables (e.g., the ones created by the Custom Drivers, Pre-Configured SNMP Sensors, and OS Monitoring) within the Monitoring Tables.
- Luxul Router-based Agents do not support VPN on demand. To elaborate, we’ll add this capability as soon as Luxul’s team provides us with the required API resources.
- You can’t configure the static IP address on the Domotz Box before configuring the Agent.
- Lastly, you can’t leverage DHCP on additional VLANs on the Domotz Box.
To conclude, these release notes cover the changes in the Domotz Pro service since the previous one. Furthermore, these changes include Domotz Pro cloud, Domotz Agent, and Domotz Pro App.
Lastly, to learn more about our network monitoring software or our Know Your Networks Blog.
