
We’ve just released exciting new features on Domotz. Our new features include website performance monitoring, docker container monitoring, Sony AV integration, pre-configured SNMP sensors for Synology NAS. Keep reading to find out more!
In summary, here’s what’s new on Domotz this month.
- Website Performance Monitoring: Monitor Website content and performance
- Docker Container Monitoring: Monitor and Analyze Docker and Container statistics and information
- Advanced SONY integration for Displays and AVRs
- Pre-configured SNMP templates for Synology NAS
- New MIB files
Additionally, October is Cyber Security Awareness Month so we’ve added some tips on how Domotz features can help you meet the Center for Internet Security (CIS) Controls. Learn more.
What’s new
Website Content and Performance Monitoring
We now have Website Content and Performance Monitoring available through Domotz. Leveraging our Custom Integration Drivers framework you can proactively monitor the generic content of any HTTP/HTTPs based pages on the website you manage.
Our website performance monitoring allows generic HTTP based monitoring for the content of your pages in PHP, HTML, JSON and other formats.
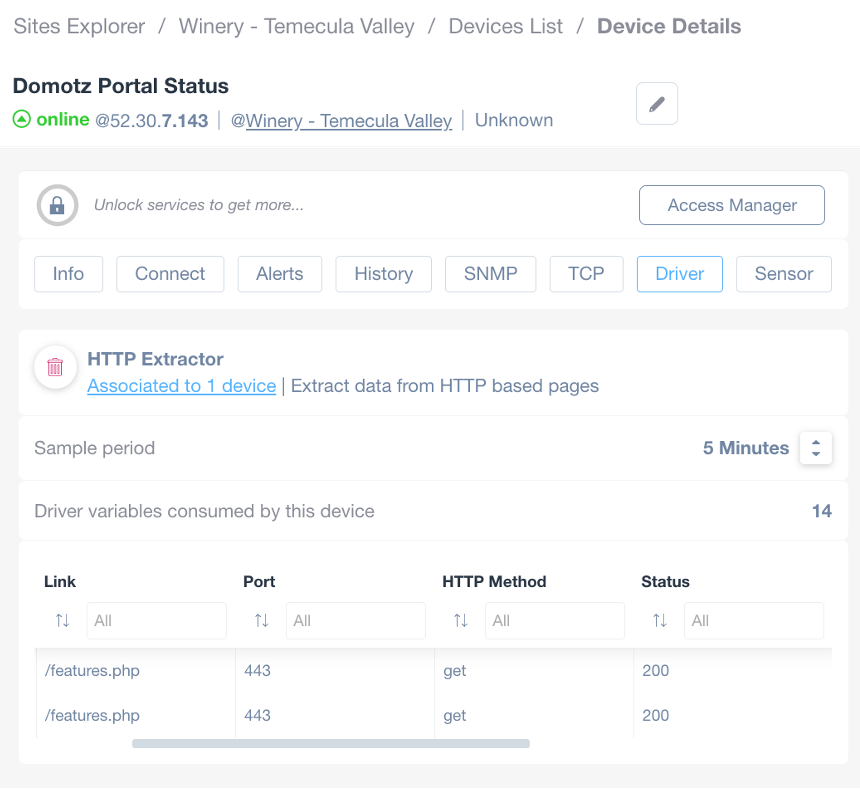
Device Details with HTTP Extractor Configuration
1. The header indicates the device is online with an IP address of 52.30.7.143 at "Winery - Temecula Valley."
2. Access Manager is available for managing access services.
3. Tabs below include options like Info, Connect, Alerts, History, SNMP, TCP, Driver, and Sensor, with the Driver tab currently selected.
4. The HTTP Extractor section is associated with one device, used for extracting data from HTTP-based pages.
5. Sample period is set to 5 minutes, with a total of 14 driver variables consumed by the device.
6. The table lists HTTP extractor details: link paths ("/features.php"), port number (443), HTTP method ("get"), and status (200).
In summary, here’s what you can do with this new integration:
- Extract the content of any HTTP/HTTPS based page
- Check whether a specific content can be extracted from the page
- Verify the return status code (HTTP/HTTPS call)
- Measure the elapsed time for the execution of each call (response time)
For more information, please visit Website Performance Monitoring on the Domotz website.
Docker Container Monitoring
You can now monitor Docker Containers, Images and Daemon/Engine configuration directly through Domotz. Leveraging our Custom Integration Drivers framework you can proactively monitor the performance of each Docker Container running on your platform, as well as the images available or the configuration of the Docker Daemon/Engine.
The new integration allow you to automatically identify and monitor the performance of all the containers running within the Docker instance. Moreover, it lists and monitor the information about the images available at the Docker engine level. Finally, it allows to review the configuration of the Docker engine itself.
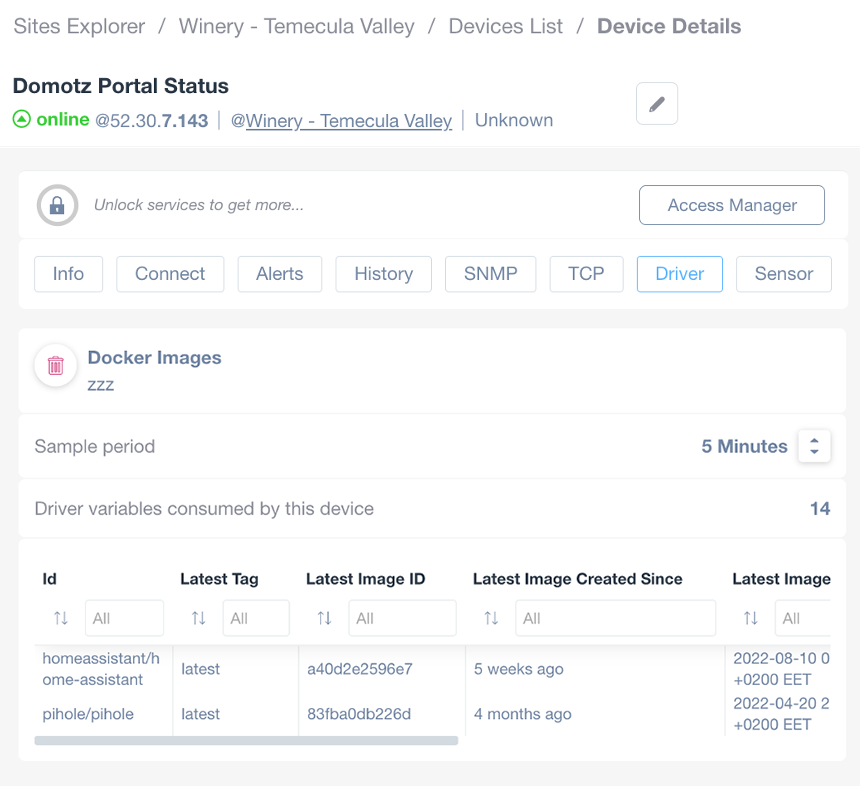
Accessing Docker Images in Domotz Device Details
1. At the top, the status indicates the device is online with an IP address of 52.30.7.143.
2. Below the status, a navigation path shows the location: Sites Explorer > Winery - Temecula Valley > Devices List > Device Details.
3. Several tab options are available, including Info, Connect, Alerts, History, SNMP, TCP, Driver, and Sensor. The Driver tab is selected.
4. In the Docker Images section, a repository labeled "zzz" is displayed with details for two Docker images.
5. For each image, details include:
- Id: Identifies the repository, such as "homeassistant/home-assistant" and "pihole/pihole".
- Latest Tag: Indicates the latest version tag, both labeled as "latest".
- Latest Image ID: Displays unique identifiers "a40d2e596e7" and "83fba0db226d".
- Latest Image Created Since: Shows relative creation times, "5 weeks ago" and "4 months ago".
- Latest Image: Provides specific creation timestamps.
6. A sample period is set to "5 Minutes", and the number of driver variables consumed by the device is 14.
Accessing Docker Images in Domotz Device Details
1. At the top, the status indicates the device is online with an IP address of 52.30.7.143.
2. Below the status, a navigation path shows the location: Sites Explorer > Winery - Temecula Valley > Devices List > Device Details.
3. Several tab options are available, including Info, Connect, Alerts, History, SNMP, TCP, Driver, and Sensor. The Driver tab is selected.
4. In the Docker Images section, a repository labeled "zzz" is displayed with details for two Docker images.
5. For each image, details include:
- Id: Identifies the repository, such as "homeassistant/home-assistant" and "pihole/pihole".
- Latest Tag: Indicates the latest version tag, both labeled as "latest".
- Latest Image ID: Displays unique identifiers "a40d2e596e7" and "83fba0db226d".
- Latest Image Created Since: Shows relative creation times, "5 weeks ago" and "4 months ago".
- Latest Image: Provides specific creation timestamps.
6. A sample period is set to "5 Minutes", and the number of driver variables consumed by the device is 14.
For more information, please visit Docker Container Monitoring on the Domotz website.
Advanced SONY Integrations and Features
In partnership with SONY, we’ve released new integrations for the following devices:
- Displays/TV
- Audio-Video Receivers (AVR)
- Sound Bars
- Projectors
Additionally, we’ve got new drivers for Sony AV systems that enable you to have fast and efficient remote access to them.
In summary, the new integration with Sony devices enables you to:
- Perform better device recognition
- Remotely control displays and TV
- Grab the status of Sony projectors by leveraging the SONY SNMP MIB
- Monitor the status of the network connected sound bars (e.g. used in Conference Rooms)
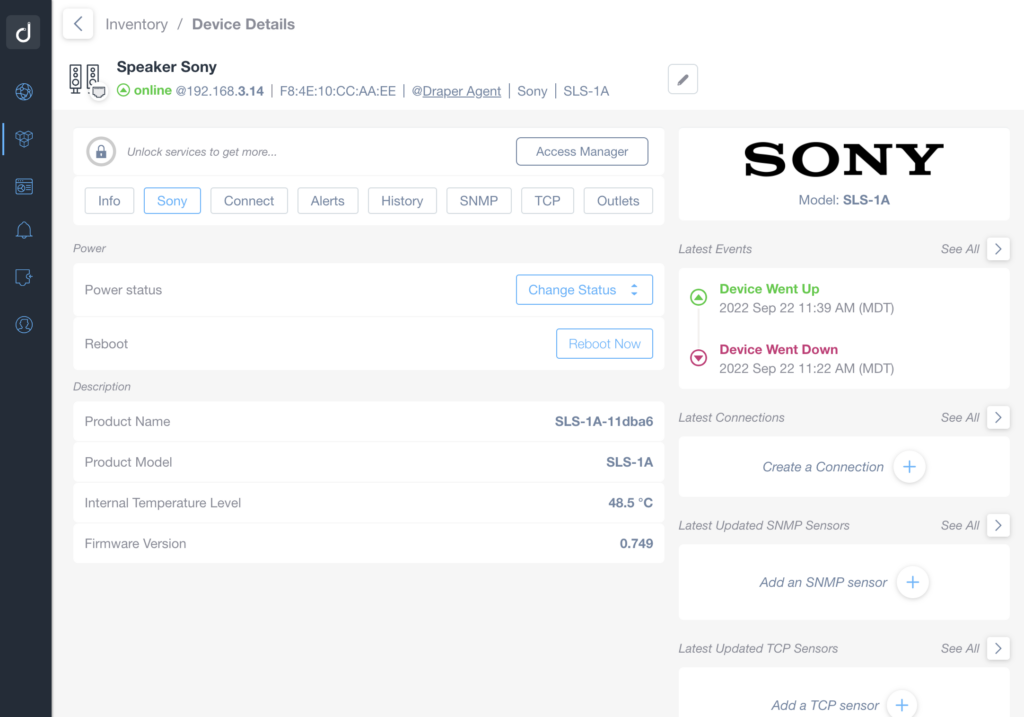
Device Details for Sony Speaker.
1. The device, labeled "Speaker Sony," is currently online with IP address 192.168.3.14 and MAC address F8:4E:10:CC:AA:EE. It is connected via the Draper Agent.
2. Use the buttons at the top to access the Access Manager or navigate through tabs like Info, Sony, Connect, Alerts, History, SNMP, TCP, and Outlets.
3. Power section includes adjusting Power Status through the "Change Status" button and rebooting the device with "Reboot Now."
4. Description section lists details: Product Name (SLS-1A-11dba6), Product Model (SLS-1A), Internal Temperature Level (48.5°C), and Firmware Version (0.749).
5. Latest Events highlight recent activities, with "Device Went Up" and "Device Went Down" timestamps.
6. Latest Connections offers "Create a Connection" option.
7. Options to add sensors under "Latest Updated SNMP Sensors" and "Latest Updated TCP Sensors."
For more information, visit the Sony AV integration with Domotz.
Improvements
Pre-configured SNMP templates for Synology RAID and Disk SMART
We’ve added two new set of pre-configured SNMP sensors for Synology NAS drives:
- RAID Volumes: for each RAID configured on the Synology NAS, Domotz will monitor the status, the usage and how much Free storage is still available
- Disk SMART information: for each disk and variable of the Disk configured on the Synology NAS, Domotz will monitor the status of the variable and the value (for instance Airflow Temperature, Command Timeout, Pending Sector, E2E Errors, Power Cycle Counts, etc)
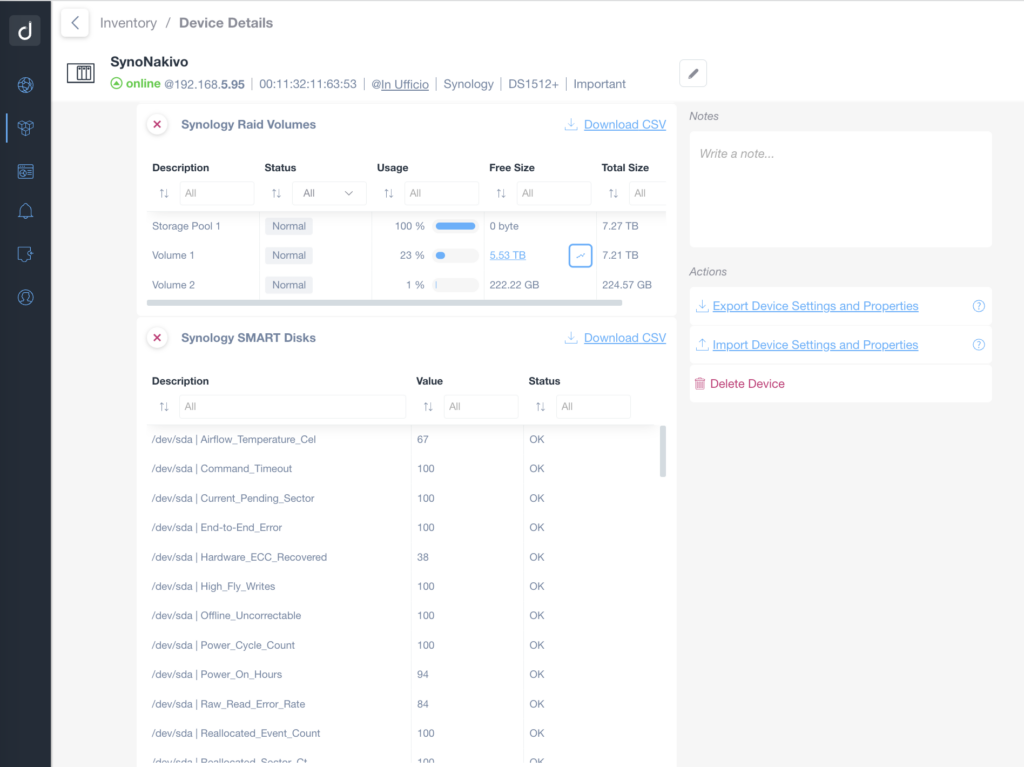
Device Details Overview for Synology System
1. The page shows details for a device named "SynoNakivo," including its IP address (192.168.5.95), model (DS1512+), and status (online).
2. Synology RAID Volumes section lists:
- Storage Pool 1 with normal status, 100% usage, and 7.27 TB total size.
- Volume 1 with normal status, 23% usage, and 7.21 TB total size.
- Volume 2 with normal status, 1% usage, and 224.57 GB total size.
3. Synology SMART Disks section presents a table of various parameters:
- Includes descriptions like Airflow Temperature and Power On Hours with respective values and status labeled as OK.
4. On the right, an Actions menu includes options to:
- Export device settings and properties.
- Import device settings and properties.
- Delete device.
5. A notes section is available for adding comments.
Additionally, for each sensor retrieved through the Pre-Configured SNMP template, Domotz enables you to get a graphical representation of the historical values:
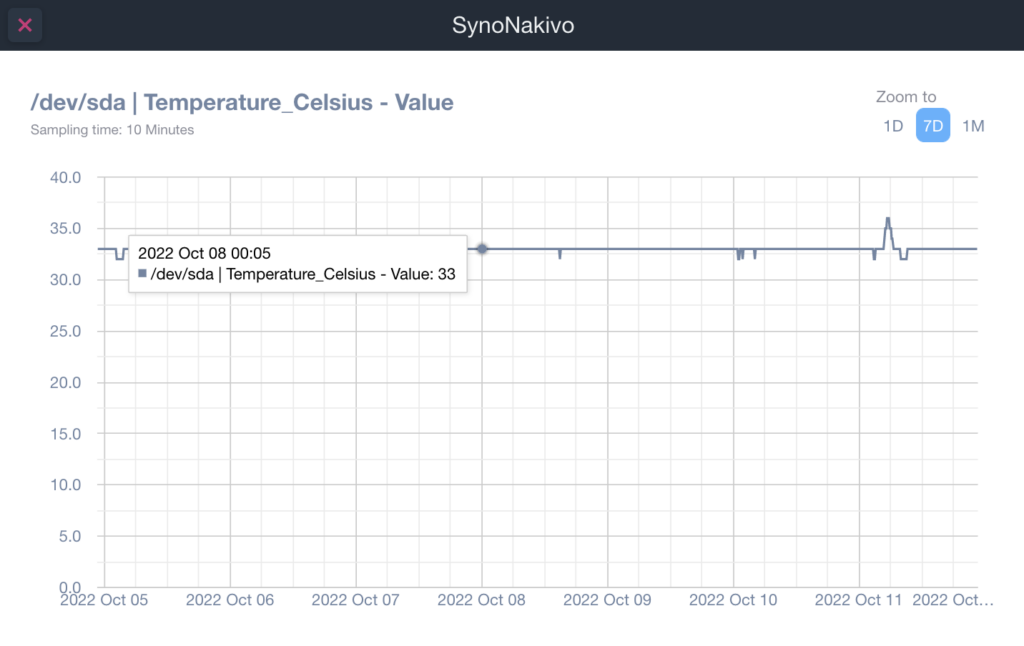
Graph of Temperature in Celsius over Time for /dev/sda.
1. The graph tracks temperature data for the device labeled /dev/sda over several days.
2. The Y-axis represents temperature in Celsius, ranging from 0 to 40 degrees.
3. The X-axis shows dates from October 5 to October 12, 2022.
4. A data point on October 8, 2022, indicates a temperature of 33 degrees Celsius.
5. The zoom controls allow viewing data over 1 day, 7 days (selected), or 1 month.
6. Sampling time is set to every 10 minutes.
Lastly, for more information, please visit Pre-configured SNMP Sensors.
Additional MIBs available in the Domotz Database
Additional MIB files are available for the following devices. Additionally, you can search for their OIDs from Domotz:
- SONY Projectors
- ATEN MIB
- AirSpan MIBs
- SonicWall suite
Fix
We’ve fixed the following issues:
- There’s a fix for typing search queries in the Inventory dashboard occasionally resulting in overlapping results.
- Cisco IOS unlock was missing scp setting checks.
- Highlighting text in pop-up caused the pop-up window to close.
- Missing space in the list of IP addresses in the device history page (for IP changes).
- Some entities were not in sync between the Inventory Dashboard and Site Explorer.
- An issue in retrieving the Network Interface of the device hosting the Agent has been fixed (requires Agent Version 4.5.2).
- Control4 driver was wrongly parsing ZMAN results.
- SAML Assertion did not accept Japanese chars (Azure).
- An issue was preventing the possibility to select some TCP ports in TCP Service monitoring.
- Fortigate Configuration Management was wrongly highlighting “timestamp” fields as differences.
- Pre-Configured SNMP template for Network Interface is now extracting only physical interface data (reducing the number of variables)
Known limitations
- Firstly, Monitoring Dashboards are currently limited to Monitoring Tables as Widgets. Furthermore, they do not report some variables (e.g. the ones created by the Custom Drivers, Pre-Configured SNMP Sensors and OS Monitoring) within the Monitoring Tables.
- Luxul Router-based Agents do not support VPN on demand. To elaborate, we’ll add this capability as soon as Luxul’s team provides us with the required API resources.
- Devices with multiple network interfaces (multiple MAC addresses) can’t be merged into a single device. This affects some types of switches that appear as multiple instances on Domotz when VLANs are configured.
- The static IP address on the Domotz Box cannot be configured before configuring the Agent.
- Lastly, DHCP cannot be leveraged on additional VLANs on the Domotz Box.
To conclude, these release notes cover the changes in the Domotz Pro service since the previous one. Furthermore, these changes include Domotz Pro cloud, Domotz Agent, and Domotz Pro App.
Lastly, to learn more about check out our network monitoring software or check out our Know Your Networks Blog.