
Here are the latest features we’ve added to Domotz:
- Brand new Pre-Configured SNMP Sensors that will help speed-up monitoring.
- New Search & Manage functionality on the WebApp.
- The Custom Drivers feature has been drastically improved.
- Monitoring Dashboards have been optimized and can now be better customized to your needs.
- Physical and logical disk data within the OS Monitoring tables.
- Agent Activation with Network Scanning Disabled.
- Simple Reporting Scripts: The Secure Equipment Act of 2021.
What’s new
Pre-Configured SNMP Sensors
Domotz has added the capability to identify devices supporting SNMP and has created a mechanism to automatically apply a Pre-Configured SNMP template with sensors for the following categories:
- NAS drive – Basic Info:
- CPU
- Memory
- Temperature
- NAS drive – Hard Disks:
- Description
- Status
- Capacity
- Model
- Tempterature
- NAS drive – Volumes:
- Description
- Free Size
- Total Size
- Filesystem type
- Status
- Printers
- Toner / Cartridge leve
- Drum Unit level
- Supply levels
- UPS:
- Batter Status
- Alarms status
- Battery Temperature
- Estimated Remaining Minutes and Charge
We will continue to add more and more Pre-Configured SNMP templates. Our support team is keen to receive suggestions for additional templates. So please write to us on support@domotz.com with your suggestions.
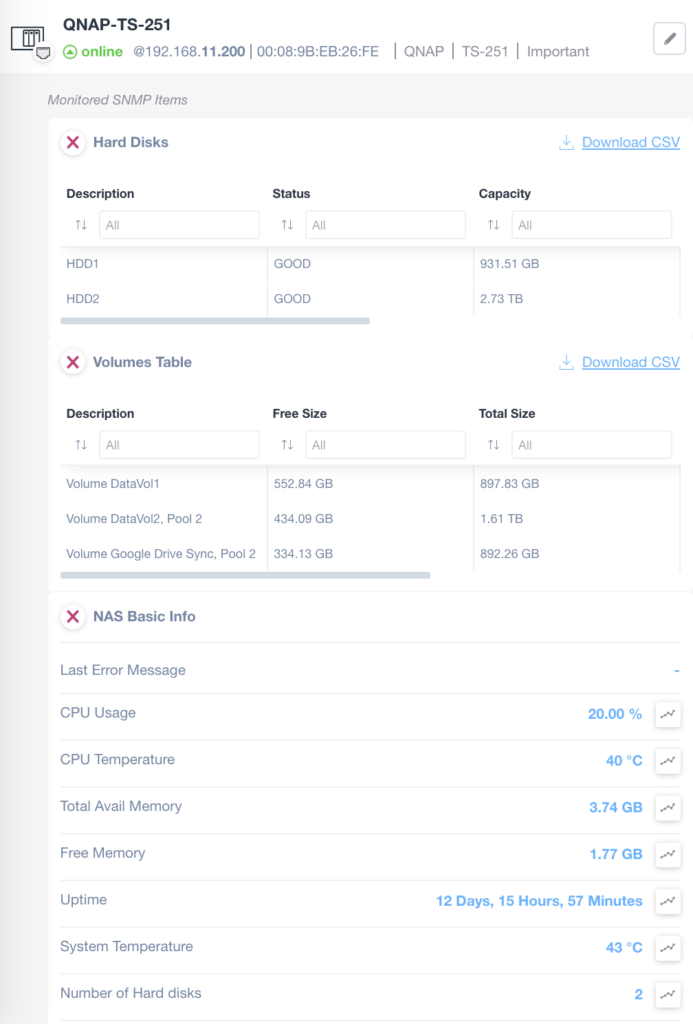
QNAP Monitoring Overview
1. The device is labeled QNAP-TS-251 and is online. The IP address is 192.168.11.200.
2. Under "Hard Disks," two disks are listed:
- HDD1 has a status of "GOOD" and a capacity of 931.51 GB.
- HDD2 has a status of "GOOD" and a capacity of 2.73 TB.
3. In the "Volumes Table," several volumes are shown:
- Volume DataVol1 has 552.84 GB free out of a total of 897.83 GB.
- Volume DataVol2, Pool 2 has 434.09 GB free out of 1.61 TB.
- Volume Google Drive Sync, Pool 2 has 334.13 GB free out of 892.26 GB.
4. The "NAS Basic Info" section includes:
- CPU Usage: 20%
- CPU Temperature: 40°C
- Total Available Memory: 3.74 GB
- Free Memory: 1.77 GB
- Uptime: 12 Days, 15 Hours, 57 Minutes
- System Temperature: 43°C
- Number of Hard Disks: 2
5. The page offers options to download the information as a CSV file.
Domotz automatically identifies all devices that have the possibility for you to apply an SNMP sensor to. All you need to do is simply open your device and Domotz will tell you whether there are pre-configured SNMP sensors that can be applied for it or not.
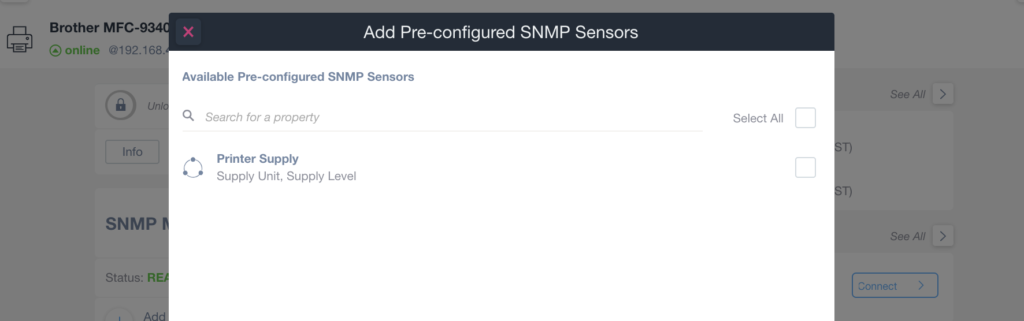
Add Pre-configured SNMP Sensors Dialog Box
1. At the top, the dialog box title reads "Add Pre-configured SNMP Sensors."
2. Below the title, there is a section labeled "Available Pre-configured SNMP Sensors."
3. A search bar allows you to search for specific properties.
4. The list under the search bar includes an option labeled "Printer Supply" with details "Supply Unit, Supply Level."
5. There are checkboxes next to each sensor option, including one labeled "Select All" to choose all options simultaneously.
In other words, all you need to do is click and decide to apply the sensor to the device to start extracting more detailed information from it.
For more information, please refer to our blog post about our Pre-configured SNMP Sensors that put the Simple in SNMP Monitoring.
New Search & Manage functionality
The Search&Manage section within the WebApp has been completely restructured so that you have more space to search devices across all Agents, or Agents across all your customers:
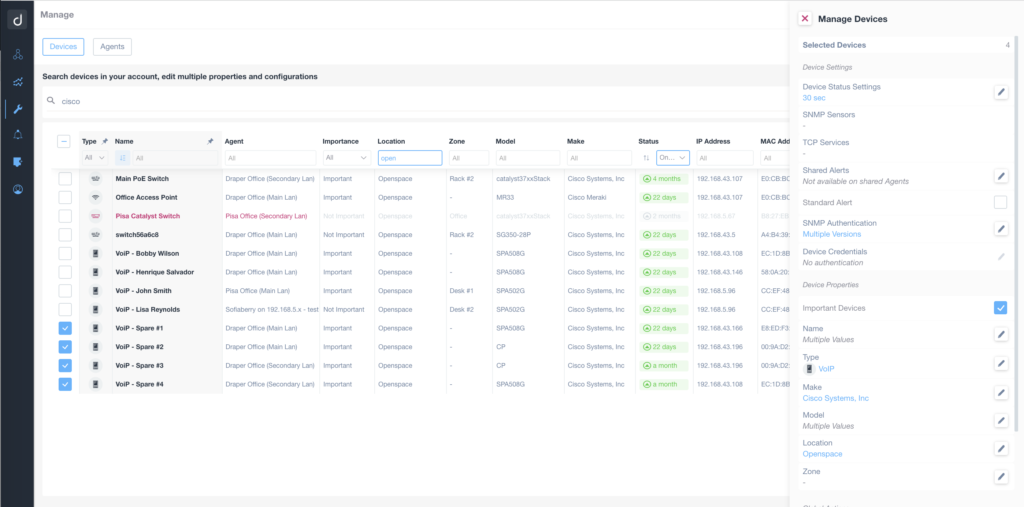
Managing Devices in the Software Interface
1. Navigate to the "Manage" tab, where you can switch between viewing "Devices" and "Agents."
2. Use the search bar to filter devices by name, such as entering "cisco" to refine results.
3. The device list displays columns with details like "Type," "Name," "Agent," "Importance," "Location," "Make," "Status," "IP Address," and "MAC Address."
4. Select devices by checking the boxes next to them on the left. Selected devices will have a blue checkmark.
5. On the right, the "Manage Devices" panel shows options for selected devices including settings like "Device Status Settings," "SNMP Sensors," and "TCP Services."
6. Edit device properties like "Name," "Type," and "Location" by clicking the pencil icon next to each entry.
7. The "Important Devices" option can be toggled on or off using the checkbox under "Device Properties."
This new functionality allows you to quickly access all devices and all agents and then apply a number of actions to them:
- Search across all agents and devices under your a specific account.
- Assign customer details or alerts to multiple agents.
- Search for a specific device (across all the Agents) and then jump into it.
- Quickly filter for devices and agents and select the ones you want, apply multiple properties and configurations in bulk and assign a common property or setting on all your selected devices.
- Use known good settings on devices and agents as a template for newly deployed systems.
For more information, please refer to our blog post about our freshly revamped Search & Manage.
Simple Reporting Script: The Secure Equipment Act of 2021
The US Senate has recently unanimously passed The Secure Equipment Act of 2021 (s.1790).
Domotz has recently developed a simple Python script that relies on the Domotz Public API which is capable of identifying devices on networks that are managed through Domotz that are included in this act.
For more information, please refer to our blog post about how to Identify any devices on your networks included in The Secure Equipment Act of 2021.
The script referenced in this blog post can be easily changed to any need to leverage the Domotz Public API to list all the devices discovered on all networks being monitored.
Improvements
Custom Driver – additional support
The Custom Driver functionality has been improved and it will soon be out of the beta program. A new documentation section has been created so that you can now learn how to build your own Custom Drivers.
The Documentation section for customer drivers is now available online here:
https://portal.domotz.com/custom-driver/index.html
We have also provided a few examples of Custom Drivers that can be used for the following devices:
- This Driver Extracts the DHCP Lease information for Ubiquiti EdgeOS Routers.
- Communication protocol is HTTPS.
- Creates a dynamic number of custom driver variables based on the number of DHCP IP addresses.
- esxi_get_users.js
- This Driver extracts the users in the ESXi system and store them as custom driver variables.
- Communication protocol is SSH.
- This Driver dxtracts the Last Login line for an ESXi system.
- Communication protocol is SSH.
- This Driver Extracts the NTP configuration for an ESXI system.
- Communication protocol is SSH.
- This Driver Extracts temperature readings for the ports of a Niveo Switch.
- Communication protocol is Telnet with negotiation.
- Creates multiple custom driver variables for each of the switch’s ports.
For more information, please visit the list of all examples available on GitHub. Domotz will continue to add more and more examples in this section. Feel free to reach out to support@domotz.com if you have any suggestions.
Domotz has added an inline “helper” that facilitates writing Javascript code compliant with the Domotz Custom Drivers capabilities.
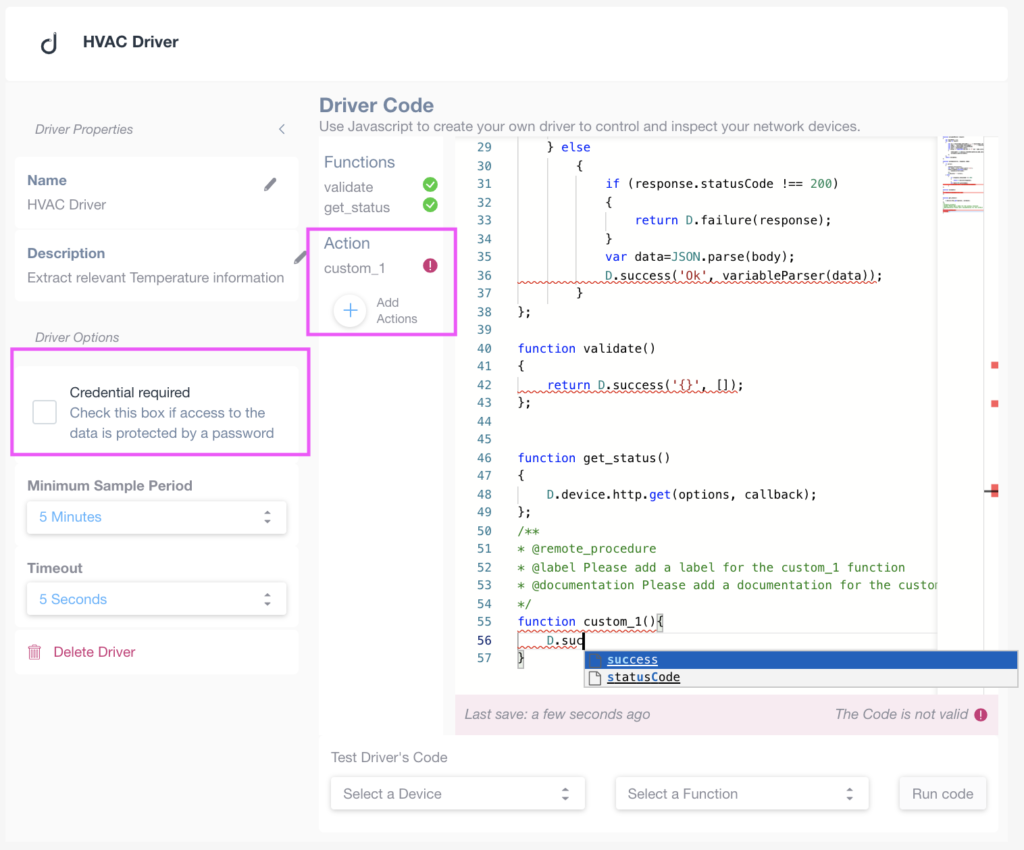
Creating a Driver in the HVAC System Interface
1. **Driver Properties:**
- Name: Displays the name "HVAC Driver".
- Description: States "Extract relevant Temperature information".
2. **Driver Options:**
- Credential required: Check the box if access to the data is protected by a password.
- Minimum Sample Period: Set the sample period to "5 Minutes".
- Timeout: Set the timeout to "5 Seconds".
- Delete Driver: Option to delete the current driver.
3. **Action Setup:**
- Functions: Lists "validate" and "get_status" as available functions.
- Action: Indicates "custom_1" function with a warning sign next to it. There's an option to add more actions.
4. **Driver Code Section:**
- Code editor with sample JavaScript functions such as `validate()`, `get_status()`, and `custom_1`.
- Highlights a line for defining a function called `custom_1`.
- Shows an autocomplete suggestion for "success" and "statusCode" while editing.
5. **Testing Code:**
- Drop-down menus to select a device and a function before running the code with a "Run code" button.
6. **Status Indicators:**
- Message at the bottom: “Last save: a few seconds ago” and “The Code is not valid!” indicating the current code status.
Support for additional protocols (such as HTTPS, Telnet, SSH) has been added.
You can now specify a set of credentials to use to login to remote devices.
It is also possible to define custom functions that can be executed against selected devices (for example to perform actions or commands directly via http/s, telnet or ssh. Custom functions will be available as custom buttons on the Device Details specific tab (Drivers).
Each manual execution of the Custom Driver function is now traced in the Report & Logging section for the Agent.
OS Monitoring – Physical and Logical disks data
It is now possible to use Domotz to export and monitor the usage of physical and logical disks across different operating systems (supported on Windows, Linux, and macOS):
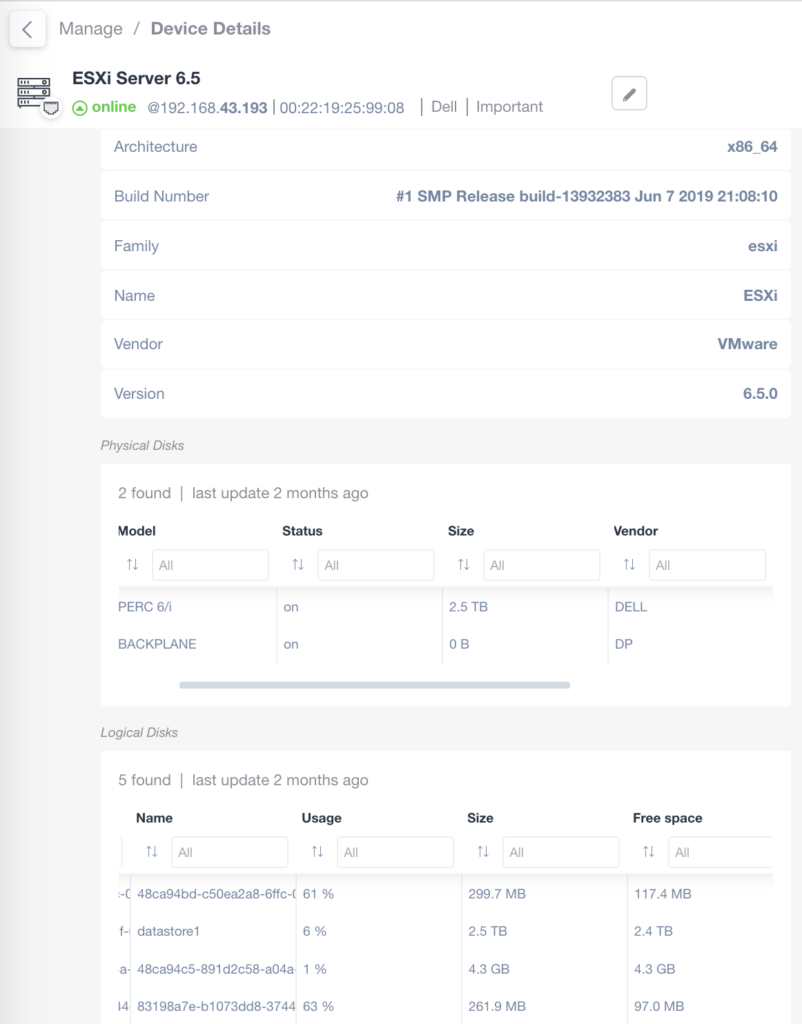
Device Details Overview for ESXi Server 6.5
1. The ESXi Server 6.5 is currently online with IP address 192.168.43.193 and has a Dell classification marked as important.
2. Architecture is noted as x86_64, and the build number is #1 SMP Release build-13932383 from Jun 7, 2019.
3. The server belongs to the "esxi" family with the name "ESXi", vendor "VMware", and version "6.5.0".
Physical Disks Information
4. Two physical disks were found, last updated two months ago. The PERC 6/i model is on with 2.5 TB size from vendor DELL. The BACKPLANE model is on with 0 B size from vendor DP.
Logical Disks Information
5. Five logical disks were found, last updated two months ago. The disks are listed with names, usage percentages, sizes, and free space. For example, one disk labeled "48ca94bd-c50ea2a8-6ffc-" has 61% usage with 299.7 MB size and 117.4 MB free space. Another disk "datastore1" shows 6% usage, with a size of 2.5 TB and 2.4 TB free space.
Use this detailed information for monitoring and managing the server's physical and logical disk resources.
When available, Domotz will report on the following information:
- Status of the physical disk
- Total Size
- Vendor and Model of the disk
- Serial Number
- Removable status
- Usage and Free Space
- Mount point
- Filesystem type
- Bitlocker configuration
Monitoring Dashboard improvements
It is now possible to further customize your Monitoring Dashboards. The following capabilities have been added:
- resize tables
- rename tables
- move tables within the Dashboard
- reduce left side column size to create more space for the dashboards
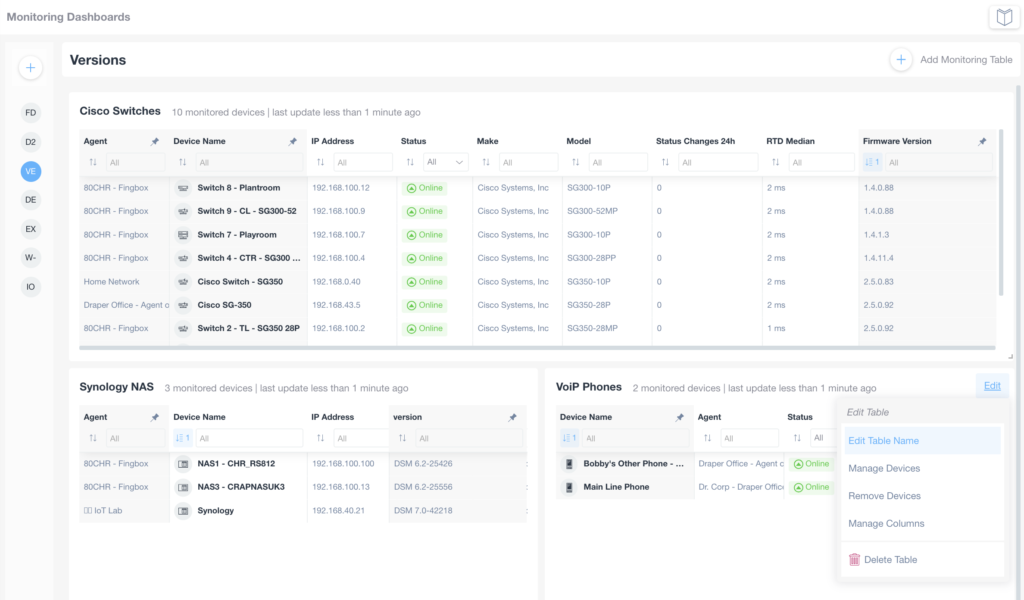
Device Monitoring Dashboard Overview
1. The "Cisco Switches" section lists monitored devices, showing details such as agent, device name, IP address, status, make, model, status changes over 24 hours, round-trip delay median, and firmware version. Use this information to monitor and troubleshoot switch performance and connectivity.
2. The "Synology NAS" section includes agent, device name, IP address, and version for each monitored NAS device. Check these details to manage network-attached storage systems effectively.
3. The "VoIP Phones" section shows device names, agents, and statuses. You can edit the table name, manage devices, remove devices, manage columns, or delete the table using the menu on the right. These functions help keep your VoIP phone list updated and organized.
To sum up, you can now further personalize your Monitoring Dashboards.
Agent Activation without scan
It is now possible to activate a new Domotz agent without scanning for devices across all the available network interfaces.
With this mechanism, Domotz will only report the available interfaces. It will be up to you to configure which interfaces need to be scanned and monitored.
For more information about this capability, refer to AgentActivation Via Command Line.
Configuration Management: Aruba Access Points
Always stay on top of changes happening on your network infrastructure devices.
With Domotz, you can now automatically backup the running configuration files of your Aruba Access Points.
Domotz will keep track of the configuration changes over time and notify you if any change occurs. Network configuration issues are easily identified. Stored backup files or new configuration files can be pushed to the Network device directly from Domotz.
For more information, visit Network Configuration Management.
Configuration Management: Fortigate with Read Only mode
It is now possible to configure Domotz to access the FortiGate devices, for the Configuration Management in a Read-Only mode.
Additional MIBs
The following MIBs have been added to the list of available MIIBs in Domotz so that you can search about specific OiD to be added as sensors:
- FreeNAS
- Eaton
- Room Alert 3E
- Sony Projectors
Fix
- Configuration Management for Fortigate failing due to timeout session has been fixed.
- Crestron PDU PC-350 – Commands for Power Cycle have been fixed.
- Filter offline devices on Monitoring Tables has been fixed.
- Ticketing System: Datto/Autotask integration did not display the first PSA account (id == 0).
- The issue when using multi-select function on IP Cameras has been resolved .
- SNMP values on Mobile App wrongly aligned.
- The issue with SAML/SSO when using mobile app (stuck on “Login Completed”) has been resolved.
- iOS Mobile App – Issue with white background on search field has been resolved.
- Sorting SNMP “number” within the Monitoring Tables has been fixed.
Known limitations
- Monitoring Dashboards are currently limited to Monitoring Tables as Widgets. It is not possible to report some variables (e.g. the ones created by the Custom Drivers) within the Monitoring Tables.
- VPN on demand is currently not supported on Luxul Router based Agents. As soon as Luxul’s team provides Domotz with the API resources to make this available, Domotz will add this capability.
- Devices with multiple network interfaces (multiple MAC addresses) can’t be merged into a single device. This affect also some type of switches which appear as multiple instances on Domotz when VLANs are configured.
- The static IP address on the Domotz Box cannot be configured before configuring the Agent.
- DHCP cannot be leveraged on additional VLANs on the Domotz Box.
This changelog covers what’s changed in the Domotz Pro service since previous Release Notes. These changes include Domotz Pro cloud, Domotz Agent and Domotz Pro App.