
Domotz discovers and monitors all IP connected devices regardless of brand or manufacturer. Multiple VLANs are supported with specific configuration. Layer 3 Routed subnets (max /24 subnet mask) and external Public IP/Hostname are allowed.
Devices List (Inventory)
The devices list is the typical entry point you access from the Agent Dashboard, when clicking on “Devices” or “Important Devices”.
Each device in the devices list has a more detailed page associated to it. In order to access its page, you simply need to tap on the device you wish to be redirected to.
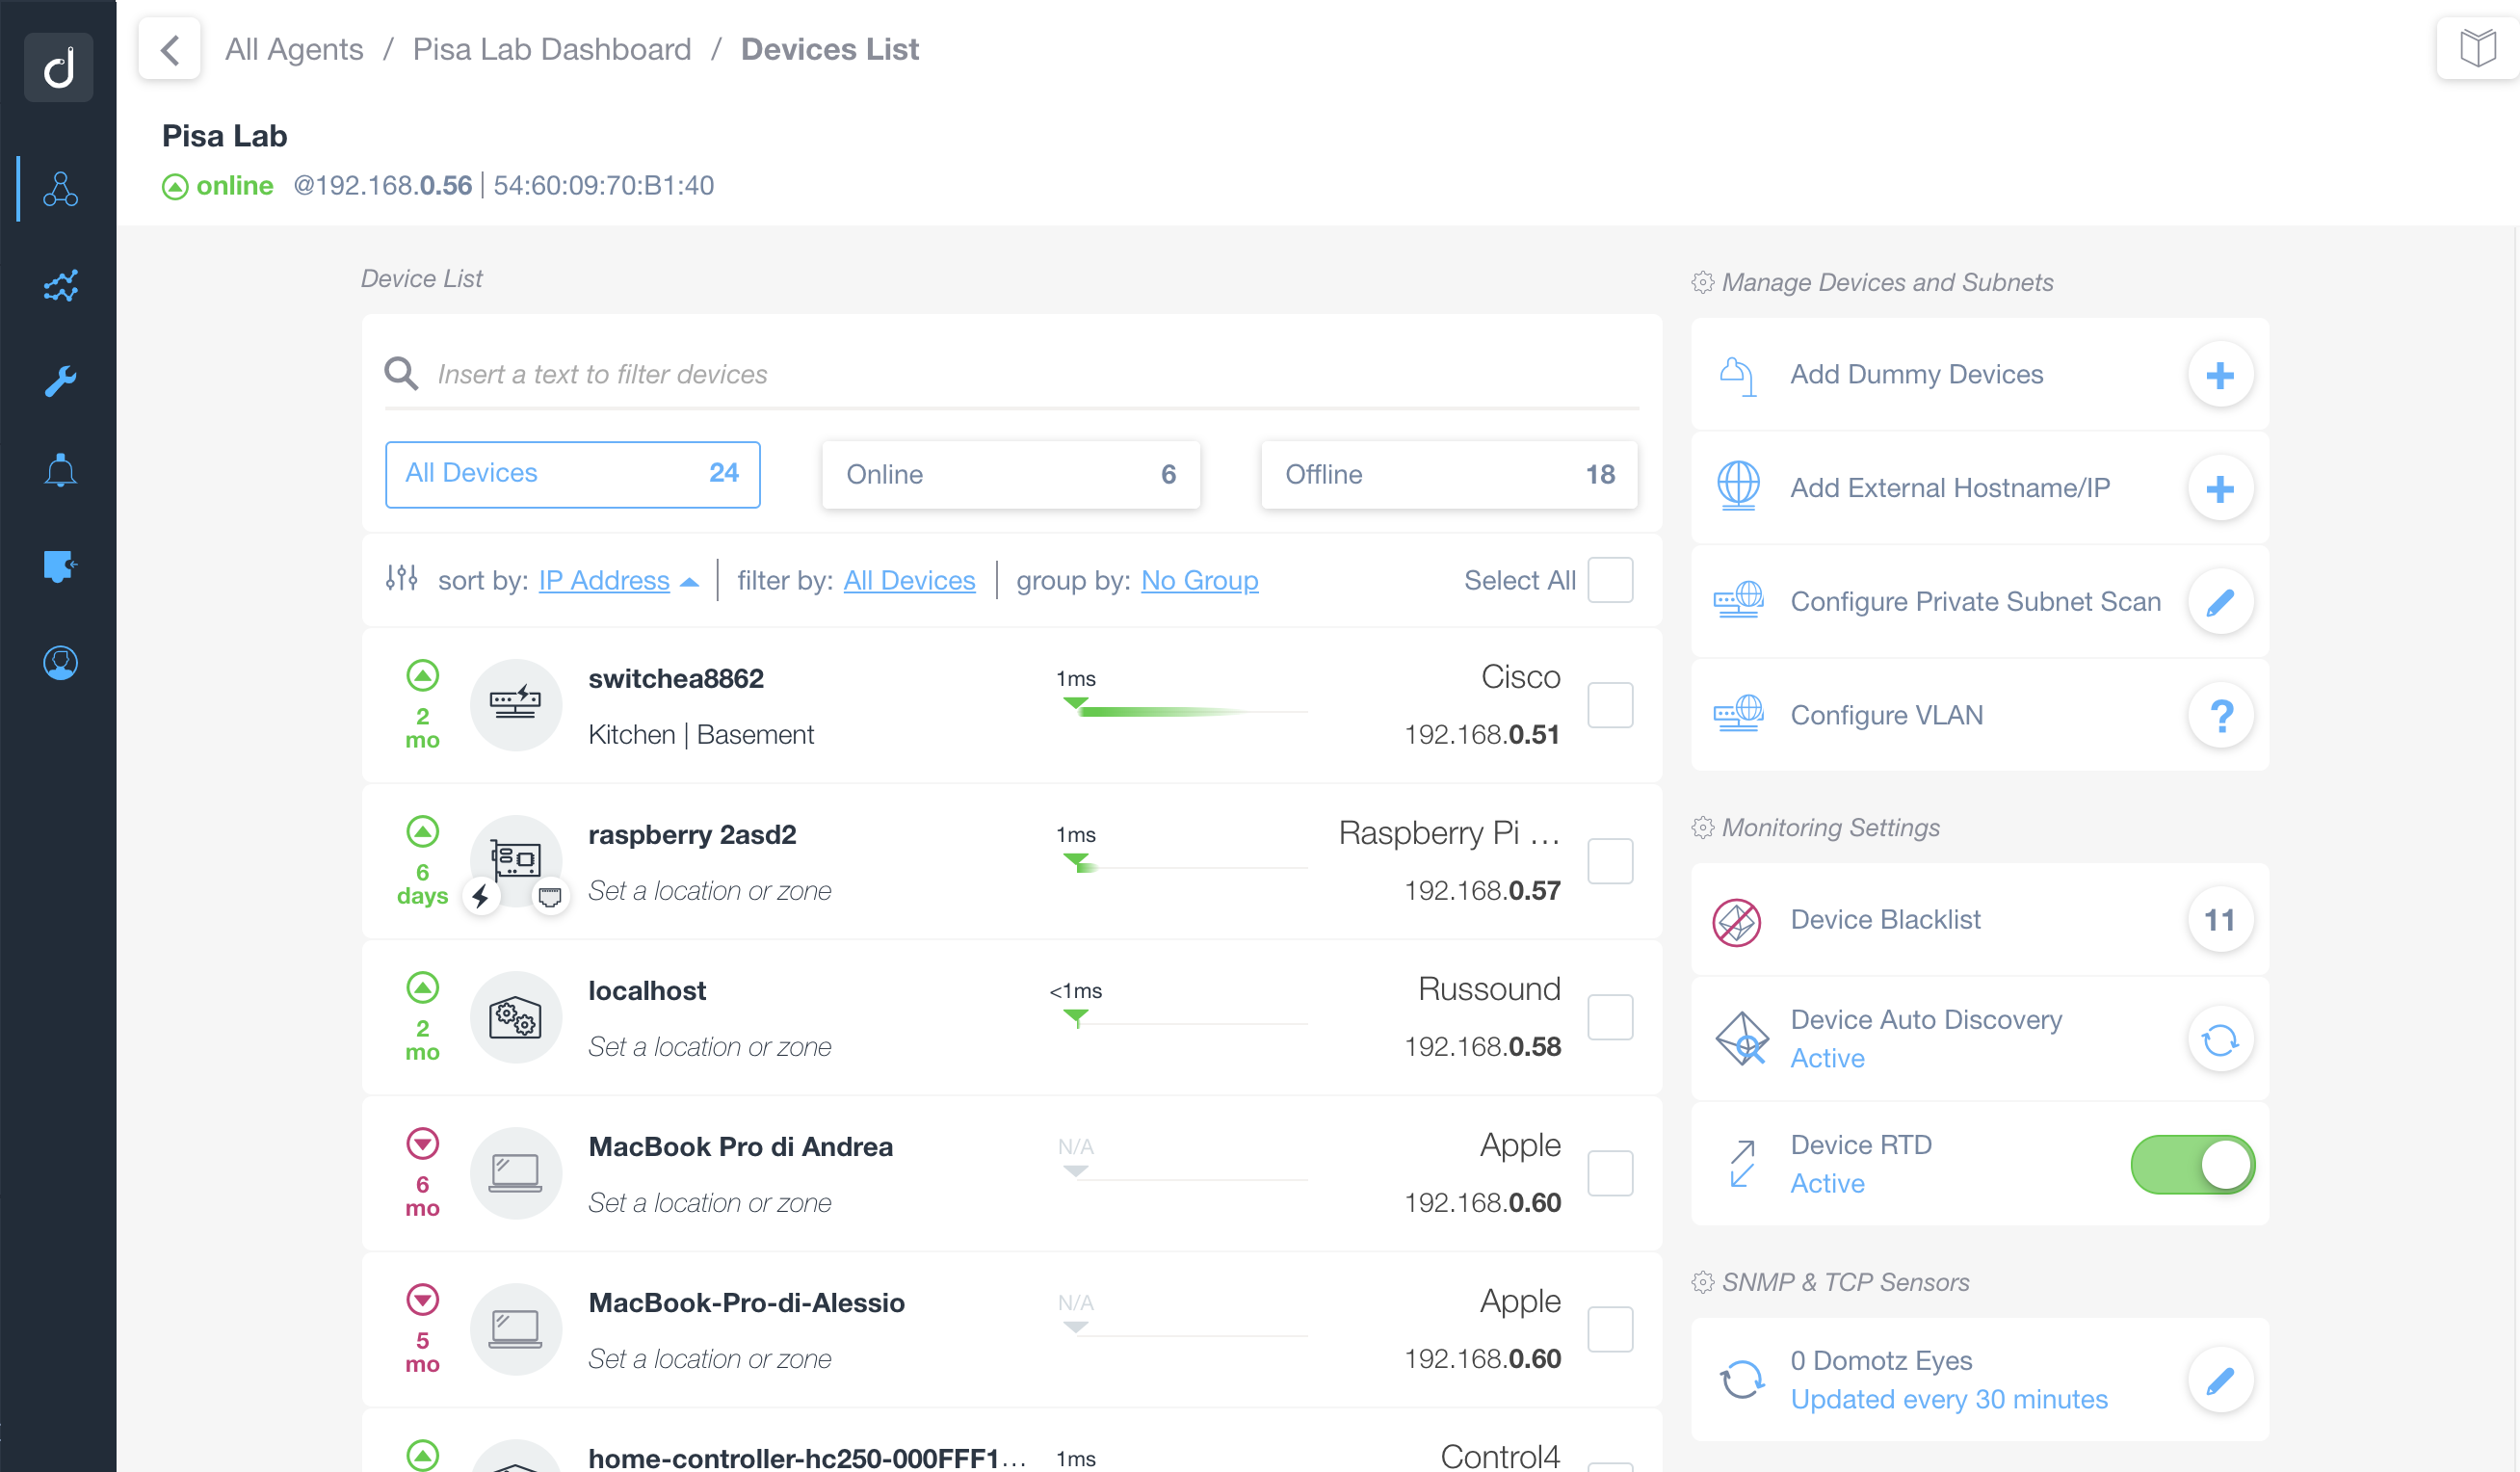
Device Management Dashboard Overview
1. The webpage headline displays "Pisa Lab Dashboard / Devices List," indicating the current section.
2. The main section shows a list of devices, each labeled with a name, location, and status. Devices include "switchcha8862," "raspberry 2asd2," and others, each with availability shown in green, and a label for the time online, e.g., "2 mo" or "6 days."
3. Filters and sorting options are present at the top, allowing sorting by IP Address and filtering by device type. The page can display "All Devices" or filter to show only "Online" or "Offline" devices.
4. On the right, there's a menu with management options:
- "Add Dummy Devices" and "Add External Hostname/IP" allow users to add new entries.
- "Configure Private Subnet Scan" and "Configure VLAN" are available for network configurations.
5. The "Monitoring Settings" section includes options like "Device Blacklist," "Device Auto Discovery," and "Device RTD," showing the current status.
6. Under "SNMP & TCP Sensors," the "0 Domotz Eyes" entry indicates updates every 30 minutes.
Use these features to manage and monitor devices efficiently, applying filters or configuration tools as needed.
Device List Elements
The Device List provides basic information, such as:
- The friendly name (if set) or default names, or MAC address (automatically discovered on Layer 2 subnets)
- The location and zone (if set)
- The type Icon (either automatically or manually assigned)
- The manufacturer
- The IP address
- The green up arrow or the red down arrow, on the left of the device icon, indicates when the device joined or left the network most recently.
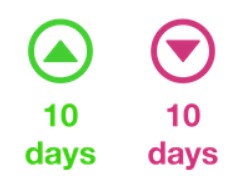
Comparison of two status icons indicating time.
1. The left icon is green with an upward-facing triangle, accompanied by the text "10 days." This likely suggests a positive status or progress that is increasing or improving over 10 days.
2. The right icon is pink with a downward-facing triangle, also stating "10 days." This likely indicates a negative status or a decrease happening over 10 days.
- The green and red “circle” arrows with a number between them shows how many times the device has connected and disconnected to/from the network in the past 24h. This number is refreshed once per hour.

Rotating sequence with icons.
1. The icon features a curved green arrow pointing clockwise, highlighting a forward or repeat action.
2. A curved red arrow points counterclockwise, indicating a reverse or undo action.
3. Both arrows form a circular cycle around the number 4, suggesting sequential steps in a repeated process.
- The plug symbol, indicates that the device has been configured as plugged-in into a PDU or smart plug.
Plugin icon depicting a plug and socket connection. Use this icon to access plugin settings or manage integrations within the software. It typically indicates options related to adding or configuring extensions and connectivity features.
- The “bolt” symbol indicates that the device has been automatically recognised to be connected to a PoE capable switch port.
Icon of a lightning bolt representing power or an energy-related feature.
- The “star symbol” indicates that the device is on the “favourites” list.

Star Icon in Software Interface
This star icon is typically used to mark items as favorites or to highlight important features. To use it, click the star to toggle the item’s favorited status, often changing its appearance to indicate selection.
- The “port” symbol indicates that the device is connected to the network via LAN cable (if this detail is available).
Icon Representing Network Port
This icon symbolizes a network port, commonly used to depict network or connectivity settings in software interfaces. It is typically used to access network configurations or to indicate where network-related options can be managed. Look for this icon when setting up or troubleshooting network connections in the software.
- The “Wi-Fi” symbol indicates that the device is connected to the network through a supported Wi-Fi access point and provides a visual indication of the Wi-Fi signal level (Green-Yellow-Red color code).
Wi-Fi Signal Icon
This image shows a green Wi-Fi signal icon, indicating that a Wi-Fi connection is active or available. Use this icon to check the status of your internet connection in the software.
- The “Lock” symbol might indicates that the device offer additional capabilities through Domotz but credentials are required to unblock these capabilities.
Lock Icon for Security Features
The image shows a lock icon, often used to represent security features or settings in software applications. This icon typically indicates that a section is secure or requires authentication. Click this icon to view or change security-related settings, such as passwords or privacy options.
- Where available the Manufacturer’s symbol will be displayed next to the device name.
- The Round Trip Delay is displayed like below. The value represents the last round trip delay from the device to the Domotz Agent.

Device and Network Status Overview
1. The device is named "Az Berry Reloaded" and is categorized under "Set a location or zone."
2. The device has been online for 2 months.
3. Latest Ping RTD (Round Trip Delay) is less than 1 millisecond, indicating it is within the acceptable range.
4. Historical Ping Range shows a minimum of less than 1 millisecond and a maximum of 2 milliseconds.
5. The device is identified as "Raspberry" on the network.
6. Its IP address is 192.168.5.55.
Quick Filters
The top menu bar, highlighted in red below, shows a number of filtering options allowing you to quickly access lists of devices sharing some characteristics.
Filter By
Tapping on the Filter By option allows you to view different sets of devices:
- All = All devices are displayed
- Favorites = Only favorite devices will be displayed.
- Important or Indifferent = These are devices that may or may not have an impact if one of them would go offline.
- Plugged-in = These are devices that are connected to a supported power switch and can, as such, be turned on or off remotely.
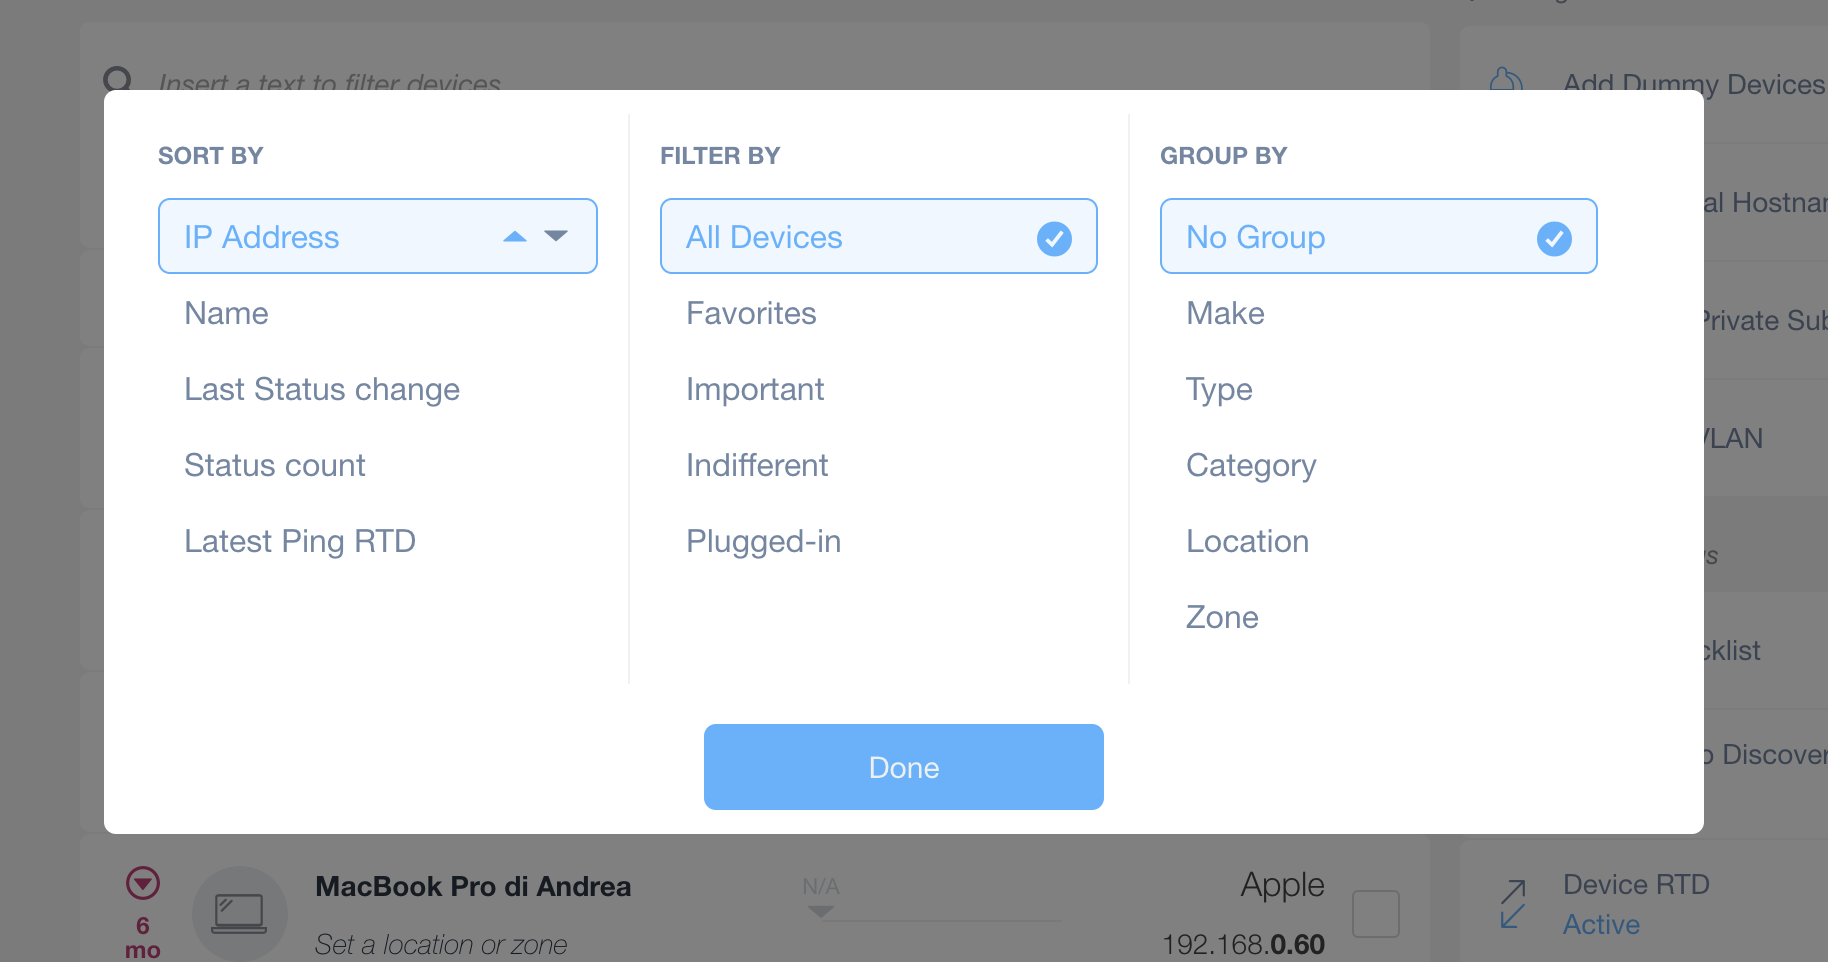
Sorting, Filtering, and Grouping Devices in a Software Interface
1. **Sort Devices**: In the "Sort By" section, select an option to organize the device list. Available options include "IP Address," "Name," "Last Status Change," "Status Count," and "Latest Ping RTD."
2. **Filter Devices**: In the "Filter By" section, choose a category to display specific devices. Options are "All Devices," "Favorites," "Important," "Indifferent," and "Plugged-in."
3. **Group Devices**: In the "Group By" section, select how to group devices. Options include "No Group," "Make," "Type," "Category," "Location," and "Zone."
4. **Finalizing Selection**: After making your selections, click the "Done" button to apply the sorting, filtering, and grouping preferences.
Sorting and Grouping
Sort by allows you to sort your devices by IP Address, Name, Status change and Status count. You can select to sort from lowest to highest value, or highest to lowest.
Group by allows you to group your device by Make, Type, Category, Location, Zone or you can select No Group if you don’t want to group your devices.
Online/Offline
Tapping on Online (or Offline) allows you to show only those devices which are currently Online (or Offline) within the selected Category
Searching
Type in a device name, location, vendor, etc. to find the device you are looking for.

Device List Search Bar
1. Locate the "Device List" section at the top of the interface.
2. Find the search bar below labeled "Insert a text to filter devices".
3. Enter your search term in the search bar to filter the list of devices accordingly.
Multiple Select
You can select multiple devices and edit the properties by choosing an action from the right menu. The following properties may then be edited for all selected devices:
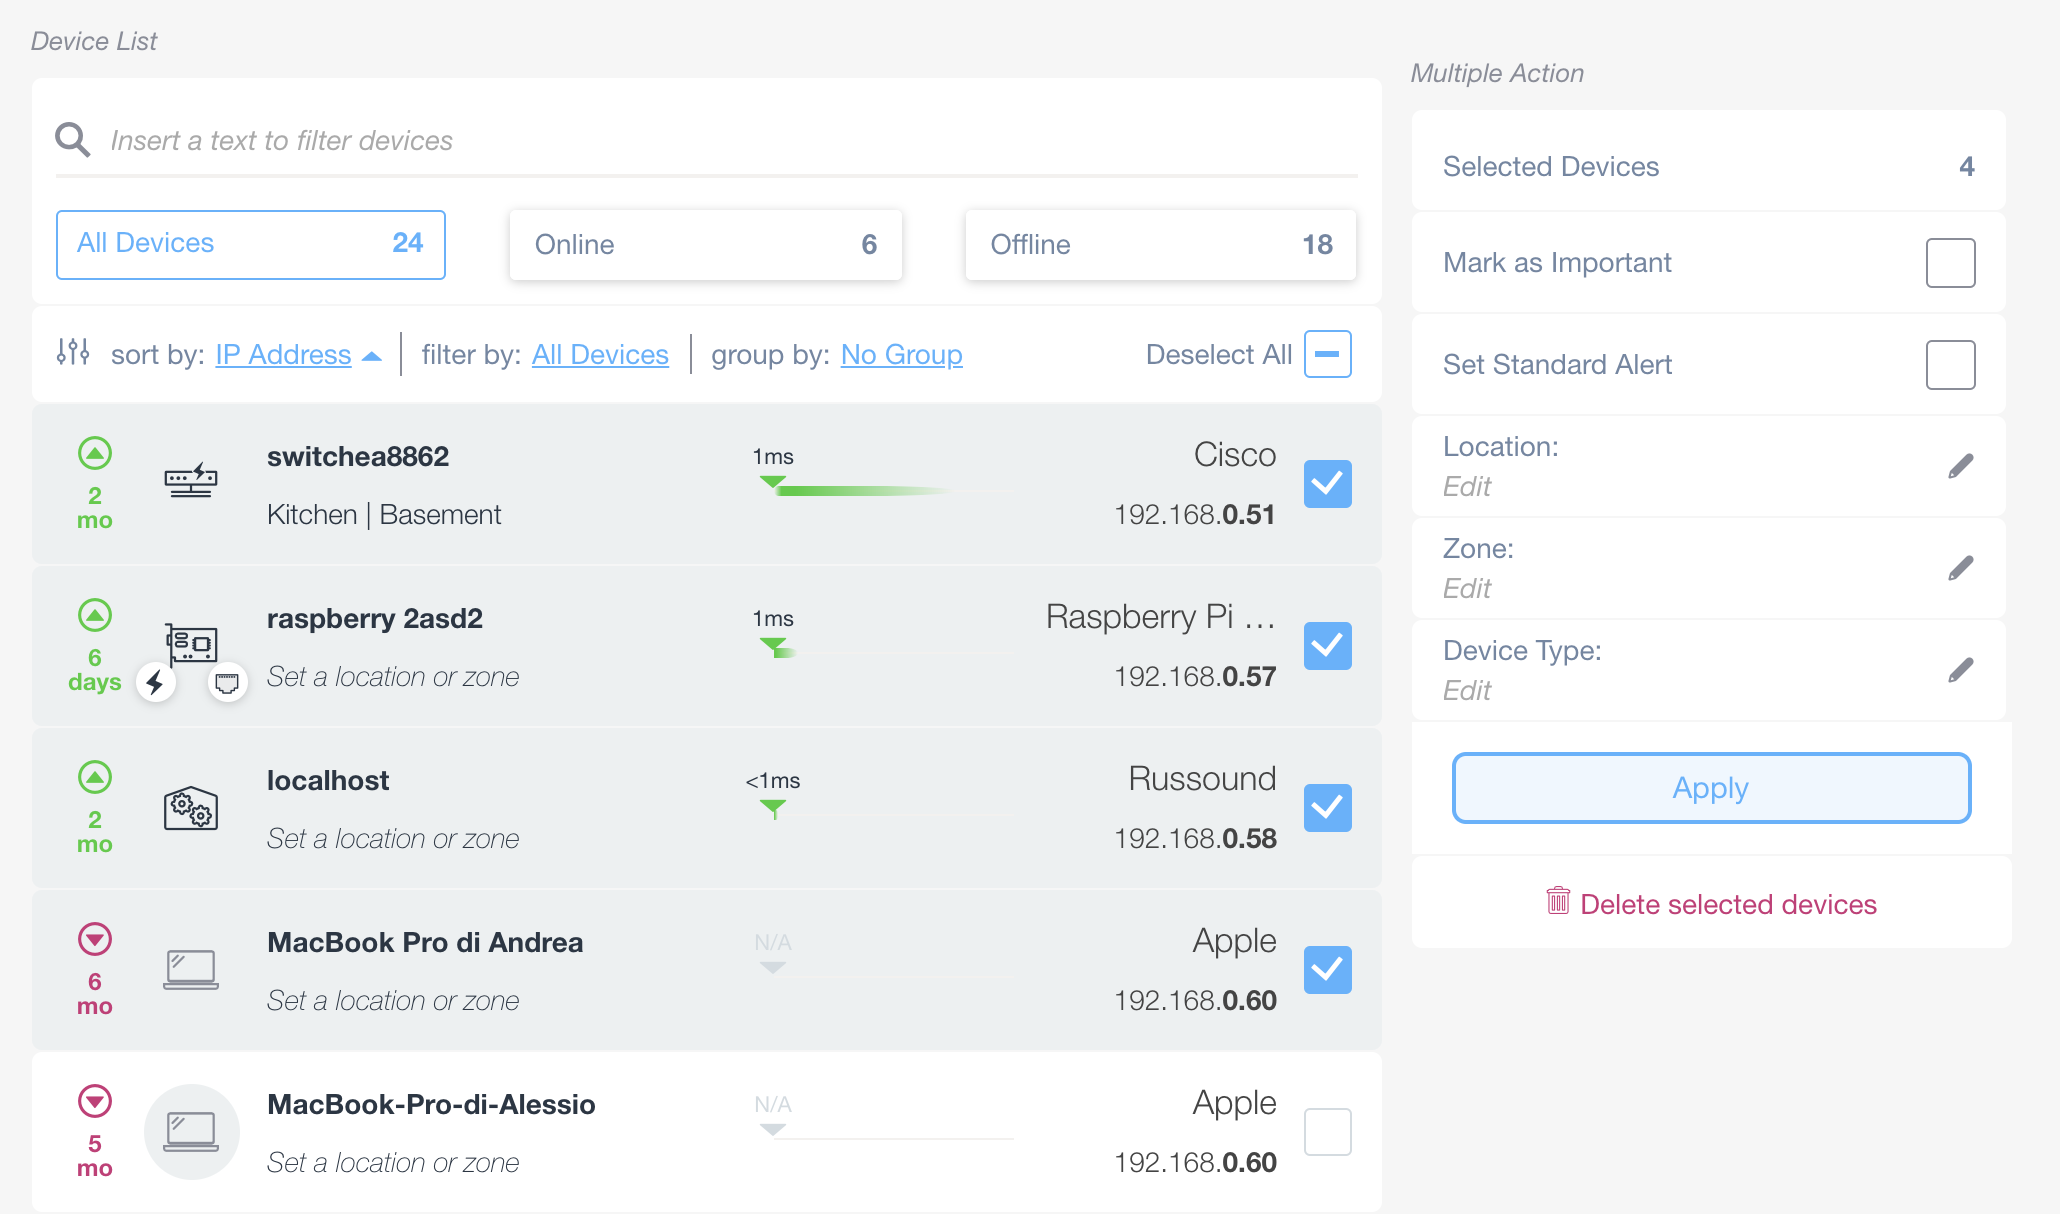
Device Management Interface
1. Use the search bar at the top to filter devices by name.
2. View device status: 24 total devices, 6 online, and 18 offline.
3. Sort devices by 'IP Address' or other criteria using the drop-down options.
4. Filter and group devices; options include 'All Devices' and 'No Group.'
5. Check or uncheck devices in the list to select them.
6. Device details include name, type, location, uptime, IP address, and response time.
7. On the right, view selected device count and choose actions like marking as important or setting alerts.
8. Edit device information such as Location, Zone, and Device Type by clicking 'Edit.'
9. Apply changes using the 'Apply' button, or delete selected devices with the 'Delete selected devices' button.
- Network Scan customization
On startup, Domotz performs a first scan and lists all devices in the Device List.
The panel on the right side of the Device List allows you to customize the scan and adapt to your needs.
- The following options are available:
- Device External Services
- Add an external hostname/IP
- Configure an External Routed Subnet Scan
- Configure a VLAN
- Exclude Devices From Active Monitroing
- Device Auto Discovery
- Device Ping RTD Settings
- Add a Logical device (non-IP connected device)
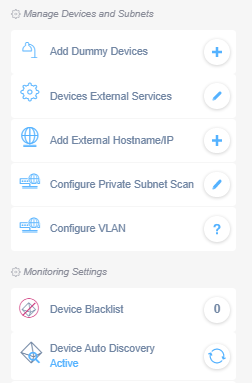
Manage Devices and Monitoring Settings in Network Software
1. **Add Dummy Devices:** Click to simulate devices within your network setup.
2. **Devices External Services:** Use this to configure connections to external services.
3. **Add External Hostname/IP:** Add hostnames or IP addresses for external devices.
4. **Configure Private Subnet Scan:** Set up scanning for private subnets to detect devices.
5. **Configure VLAN:** Access VLAN configuration settings for network segmentation.
Monitoring Settings:
6. **Device Blacklist:** Access the list where you can add or manage blacklisted devices.
7. **Device Auto Discovery:** Displays the status of automatic device discovery, with the current state being "Active."
Device Types
For a comprehensive list of the current device types present in Domotz, you might download this excel file:
Add an external hostname/IP
External Hostname/IP monitoring allows monitoring virtual devices anywhere on the web, such as:
- A website
- An off-site server
- A remote device on a vpn in order to monitor the vpn health
- An external TCP service such as VoIP, FTP, etc.
A maximum of 20 External IP devices can be added.
A valid IP or Hostname must be assigned to the device (mandatory), while Type and Name are optional.
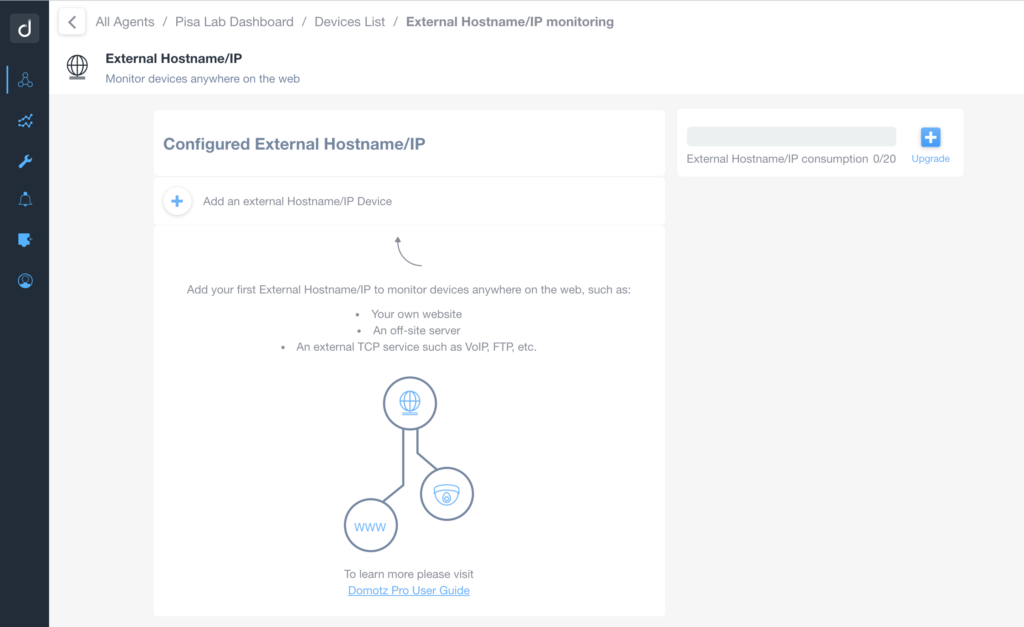
Adding an External Hostname/IP Device
1. Navigate to the "External Hostname/IP" section in your dashboard.
2. Click on "Add an external Hostname/IP Device" to begin monitoring devices on the web.
3. You can add various types of devices such as your own website, an off-site server, or an external TCP service like VoIP or FTP.
4. View your External Hostname/IP consumption on the right side of the screen, where limits are displayed. Use the "Upgrade" link if you need more capacity.
Once added, the external Hostname/IP is monitored like any other device (ping every 30 seconds, reading SNMP, Remote Connections, etc). Being a Layer-3 type of connection, on the other hand, limits the possibility to identifying MAC addresses of the remote host.
Routed Subnet Scan (Routed Network)
With Routed Subnet Scan it is possible to monitor up to 8 different Layer 3 subnets of a VPN-connected LAN or other connected/routed subnets.
With Routed Subnet Scan, you can monitor:
- Modems and/or routers on different subnets
- Networks and network devices routed on different subnets
- Multiple sites or buildings connected via VPN
For more information, please refer to how to Configure an External Routed Subnet Scan (Routed Network).
For a few examples of configuration on the usage of Routed Subnets (Routed Networks) vs the usage of VLANs (Attached Networks), please refer to Monitoring networks with subnets and VLANs blog post.
Configure VLAN or Network Interfaces (Attached Networks)
When clicking this button, the user is provided with information on how to configure a VLAN (or in general a scan on Attached Networks through Network InterfaceS).
The instructions provided within the Domotz App and WebApp are applicable to the Domotz Agent hosted on the Domotz Box, where the Domotz Agent Web Interface can control the low-level stack of network interfaces.
However, configuring VLANs or additional Network Interfaces to be scanned on different hardware is still possible and recommended against “Configuring Routed Subnet Scan / Routed Networks”, since it provides additional information and benefits. Every hardware/operating system has its own way of configuring VLANs as proper Network Interfaces. Please, contact support@domotz.com for your specific Hardware.
For more information on how to configure VLANs on different hardware, please refer to VLAN and Network Interface Configuration.
Exclude Devices From Active Monitoring
You can exclude any device that you don’t want Domotz Pro to monitor. To do so, navigate to the Device List menu of the Collector, scroll down in the left-side menu, and click on Monitoring Settings. Then select Devices Excluded from Discovery. This will open a list of all devices discovered on the selected site.
You can search for the device using its name, MAC address, or IP address. Once the device is located, select it and click the Exclude from Discovery button.
After completing this process, the selected device(s) will no longer be scanned or monitored by Domotz.
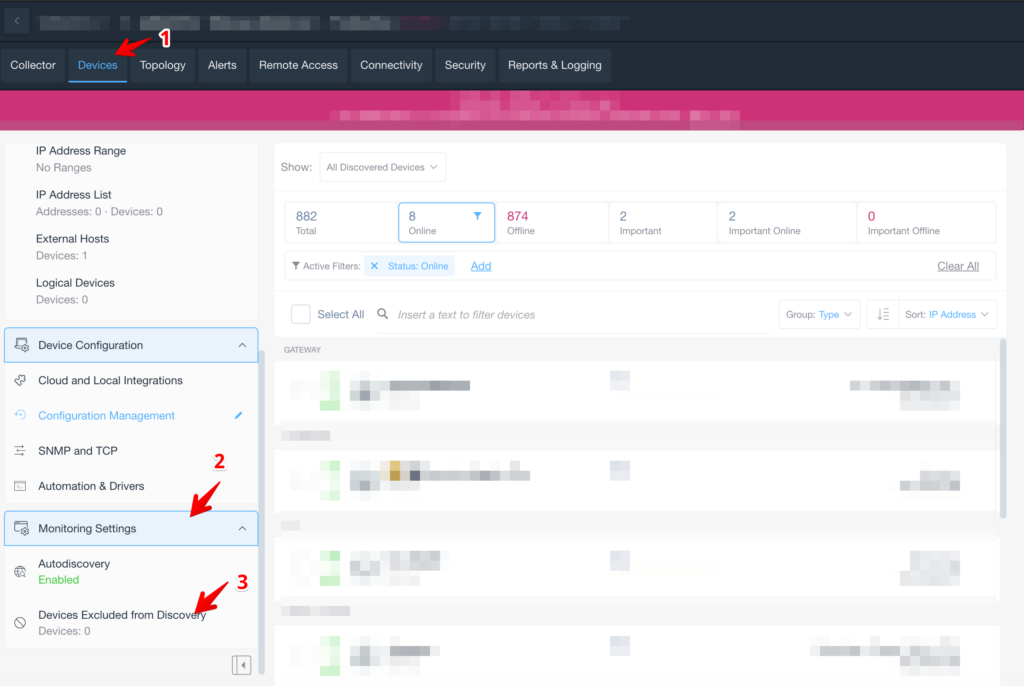
Managing Device Discovery in the Software Portal
1. Navigate to the “Devices” tab at the top of the software's main navigation bar.
2. In the left sidebar, go to the “Device Configuration” section. Select "Monitoring Settings."
3. Within “Monitoring Settings,” review the “Autodiscovery” option to ensure it is enabled. Also, check the "Devices Excluded from Discovery" section to see if any devices are excluded.
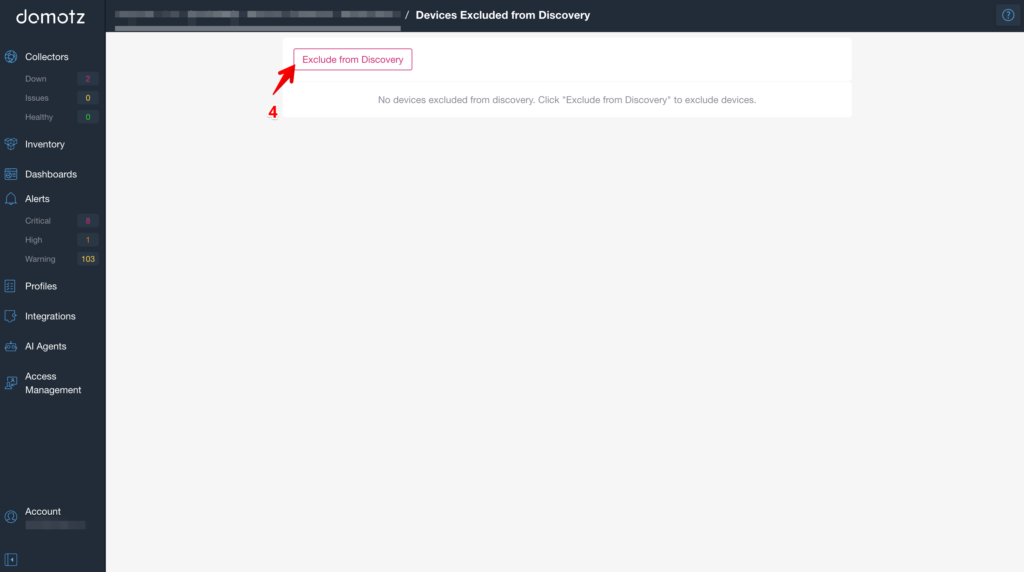
Excluding Devices from Discovery
1. Navigate to the "Devices Excluded from Discovery" page in the software interface.
2. Locate the button labeled "Exclude from Discovery" near the top of the page.
3. Click "Exclude from Discovery" to exclude devices from the discovery process. The page indicates that no devices are currently excluded and provides a prompt to perform the action.
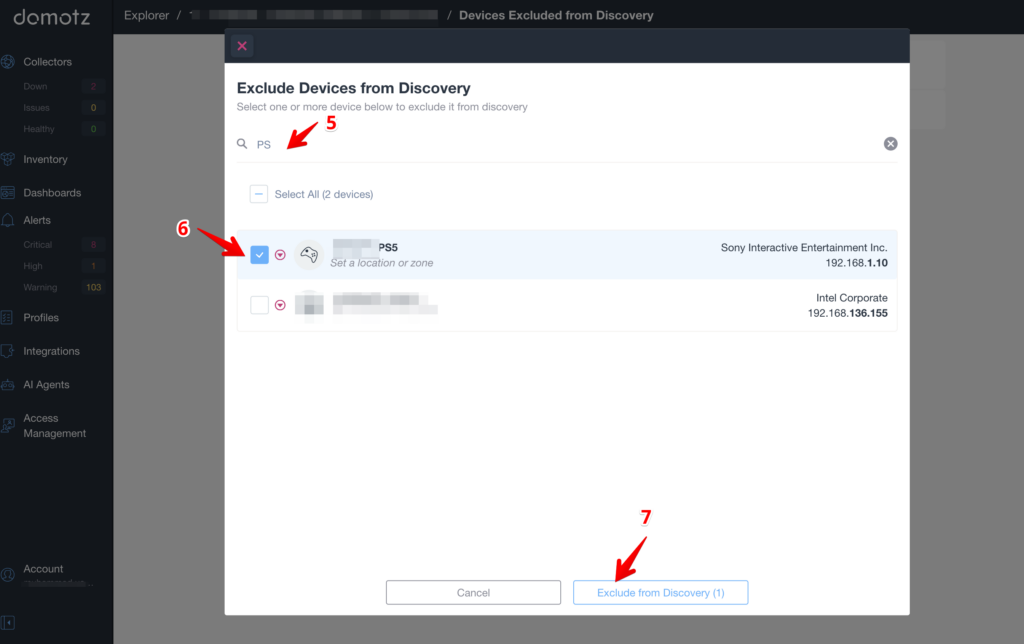
Exclude Devices from Discovery
1. In the "Exclude Devices from Discovery" window, type "PS" in the search bar to filter the device list.
2. Check the box next to "PS5" to select the device you want to exclude. Ensure the device's information, such as name and IP address, is correctly displayed.
3. Click the "Exclude from Discovery (1)" button at the bottom to confirm the exclusion of the selected device.
Device Auto Discovery
By suspending Auto Discovery, only previously discovered IPs will be monitored. Domotz Pro will not be able to detect any IP changes or new devices.
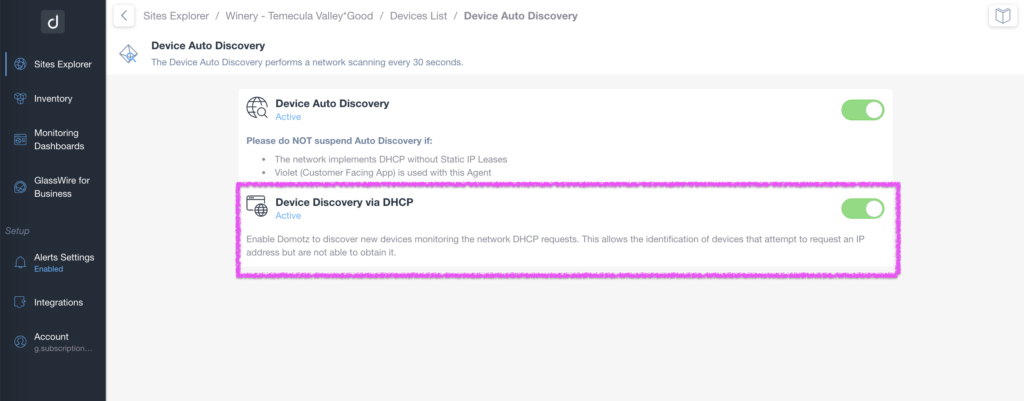
Enable Device Discovery via DHCP in Domotz
1. Navigate to the Device Auto Discovery section in Domotz.
2. Find the "Device Discovery via DHCP" option.
3. Ensure the toggle switch next to "Device Discovery via DHCP" is set to active (green) to enable the feature.
4. This setting allows Domotz to discover new devices by monitoring network DHCP requests, identifying devices attempting to request an IP address but unable to obtain it.
From this same view, the user can now enable/disable the DHCP Discovery mechanism, which allows Domotz to identify devices (by MAC address) on the network, trying to receive an IP Address, but failing to receive or use the IP address provided by the DHCP Server.
Device Ping RTD Settings
Here you can disable the automatic RTD pings from the devices to the Domotz Agent.
For more details about this feature, please refer to the Device Discovery and management section.
Add a Logical device (non-IP connected device)
This feature allows adding a non-IP-connected device to a PDU or smart outlet to enable easy power management.
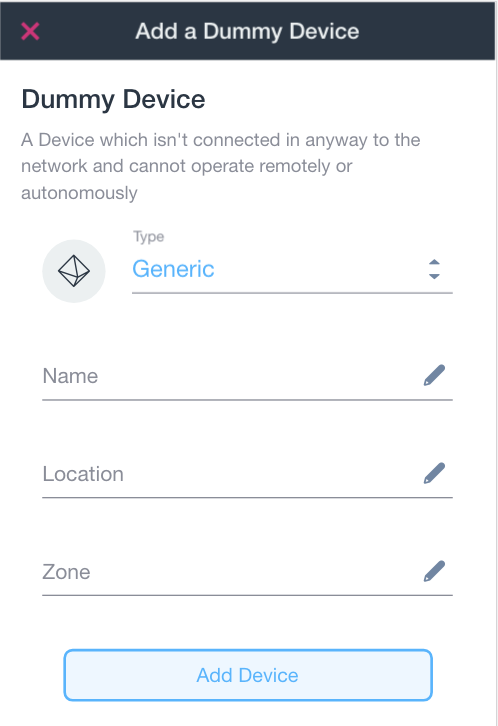
Adding a Dummy Device
1. At the top, the section is titled "Add a Dummy Device."
2. A brief description notes that a dummy device is not connected to the network and cannot operate independently.
3. Under "Type," you can select the device type from a dropdown menu, currently set to "Generic."
4. There are fields to enter information for "Name," "Location," and "Zone." Each field has an editable icon to the right, indicating they can be modified.
5. At the bottom, there's a button labeled "Add Device" to finalize the addition of the dummy device.
Some information is required to be added to the device:
- Name (mandatory)
- Type (mandatory, defaults to Generic)
- Location (optional)
- Zone (optional)
The device won’t be monitored and the device detail view will only show the Info tab.
Device External Services
Enable enhanced features and capabilities for available systems on the network via external services (e.g. Cloud-to-cloud controllers).