
Introduction
The Device Detail screen is the control panel of each device. From here you can reach the full set of data and capabilities related to a device:
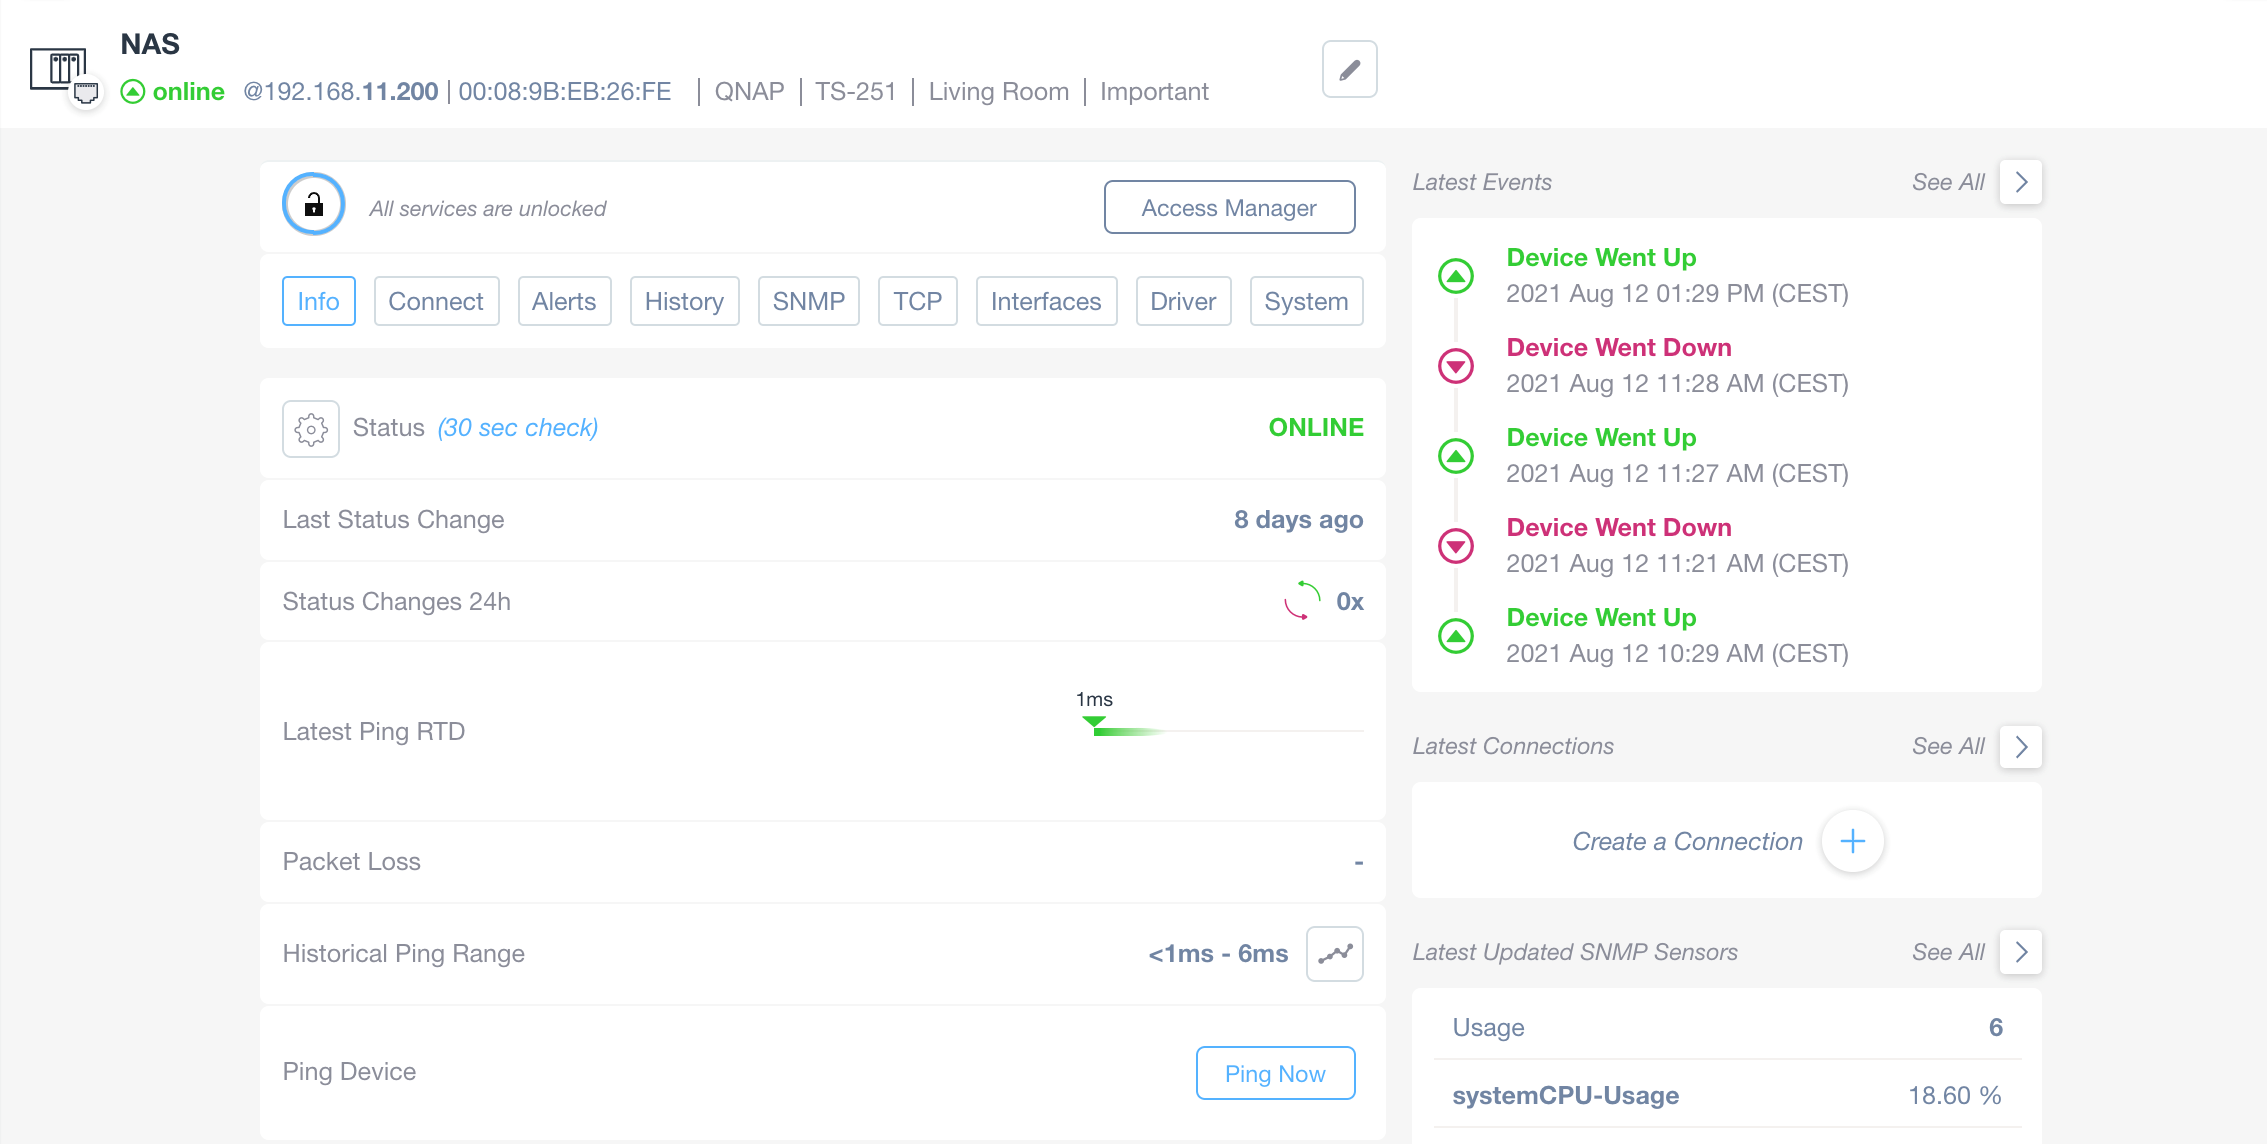
NAS Status and Event Overview
1. The screen shows a NAS device online with an IP address of 192.168.11.200 and a MAC address of 00:08:9B:EB:26:FE. The model is TS-251, located in the Living Room, and marked as Important.
2. The device status is displayed as "ONLINE," with a check interval of 30 seconds. The last status change occurred 8 days ago, with no status changes in the last 24 hours.
3. Ping details show a latest round-trip delay of 1ms, with historical ping range between less than 1ms to 6ms. Packet loss data is not provided. A "Ping Now" button is available to initiate a new ping.
4. Recent events are listed on the right: Device went up at 1:29 PM, went down at 11:28 AM, went up again at 11:27 AM, went down at 11:21 AM, and went up at 10:29 AM, all on August 12, 2021.
5. Options to view more details include "Access Manager," tabs for "Info," "Connect," "Alerts," and system configurations like "SNMP" and "Driver."
6. The option to "Create a Connection" is available under Latest Connections. Sensor usage shows system CPU usage at 18.60%.
Key elements of the Device Details screen are:
- The Access Manager
- The “standard” tabs. They are available for every device and include:
- Context-dependent tabs. Available for specific types of devices and enabling specific features.
- Some Quick views, showing the most recent events and actions for the device.
- Device Settings and Properties actions. Very useful for exporting the settings you have made to a device and importing into other devices.
Access Manager

Unlocking additional services through the Access Manager.
1. There is a padlock icon, indicating restricted services.
2. A message reads, "Unlock services to get more...," suggesting that additional features are available.
3. Click the "Access Manager" button to manage and unlock these services.
Most of the data and services shown are automatically detected by Domotz. Domotz uses powerful scans and algorithms to automatically extract as much information as possible from the protocols used by the devices. Some of the protocols, though, require authentication, which can be handled from the Access Manager.
Typical use of Access Manager is to insert SNMP credentials. But, for some types of devices also displays additional authentication possibilities. In the example below Domotz has discovered that the device is a managed switch with some Configuration Management capabilities. Entering SSH credentials here will make available a full set of additional features.
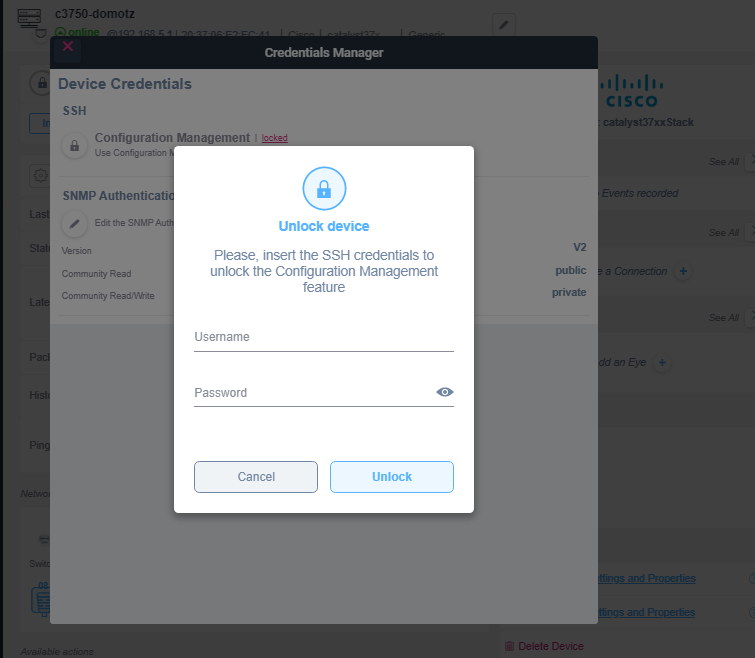
Unlocking Configuration Management with SSH Credentials
1. Open the Credentials Manager and go to "Device Credentials."
2. Under "SSH," the Configuration Management feature is labeled as locked.
3. To unlock it, click on the section.
4. A modal labeled "Unlock device" appears.
5. Enter your SSH credentials in the "Username" and "Password" fields provided.
6. Click "Unlock" to enable Configuration Management.
7. If needed, use the "Cancel" button to exit without making changes.
Info tab
The info view of a device allows you to do a lot of different things, from getting basic details about the device, to editing the device name and location, adding a note, selecting the type of device it is, etc. We’re going to cover most of the options in detail in this section and explain the functionality of every option.
Type
The Type of a device is usually assigned by default by Domotz. In case you want to change the Domotz automated classification, you can change the device type, simply click on the Edit icon next to the device name.
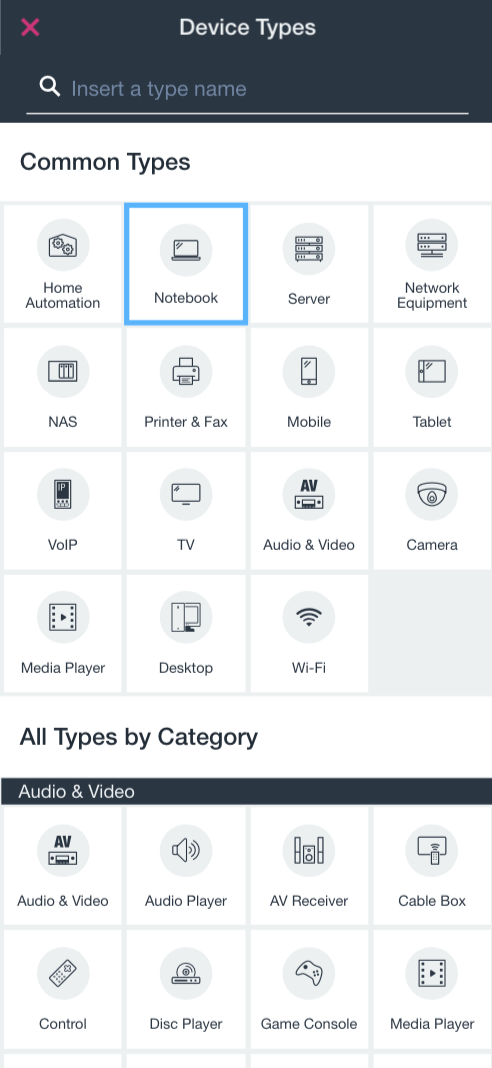
Device Types Selection Interface
1. At the top, there is a search bar labeled "Insert a type name" for typing and searching specific device types.
2. Below the search bar, there is a section titled "Common Types" containing icons to select various device categories such as Home Automation, Notebook, Server, Network Equipment, NAS, Printer & Fax, Mobile, Tablet, VoIP, TV, Audio & Video, Camera, Media Player, Desktop, and Wi-Fi.
3. The 'Notebook' option is highlighted, indicating selection or emphasis.
4. Further down, a section labeled "All Types by Category" starts with "Audio & Video," listing options like Audio & Video, Audio Player, AV Receiver, Cable Box, Control, Disc Player, Game Console, and Media Player.
Use these options to categorize devices as needed within the application or system.
At the top most Common Types will be presented, scrolling down all types are shown grouped by Category (Audio&Video, Home&Office, Network, Smart Home, Mobile, Server, Engineering).
To select the type you want to assign to your device, simply click on the preferred type.
Name, Location, Zone
To change the name of your device, simply click on the Edit icon and you’ll jump to the Device Properties section. The procedure is the same for entering the Location or Zone information.
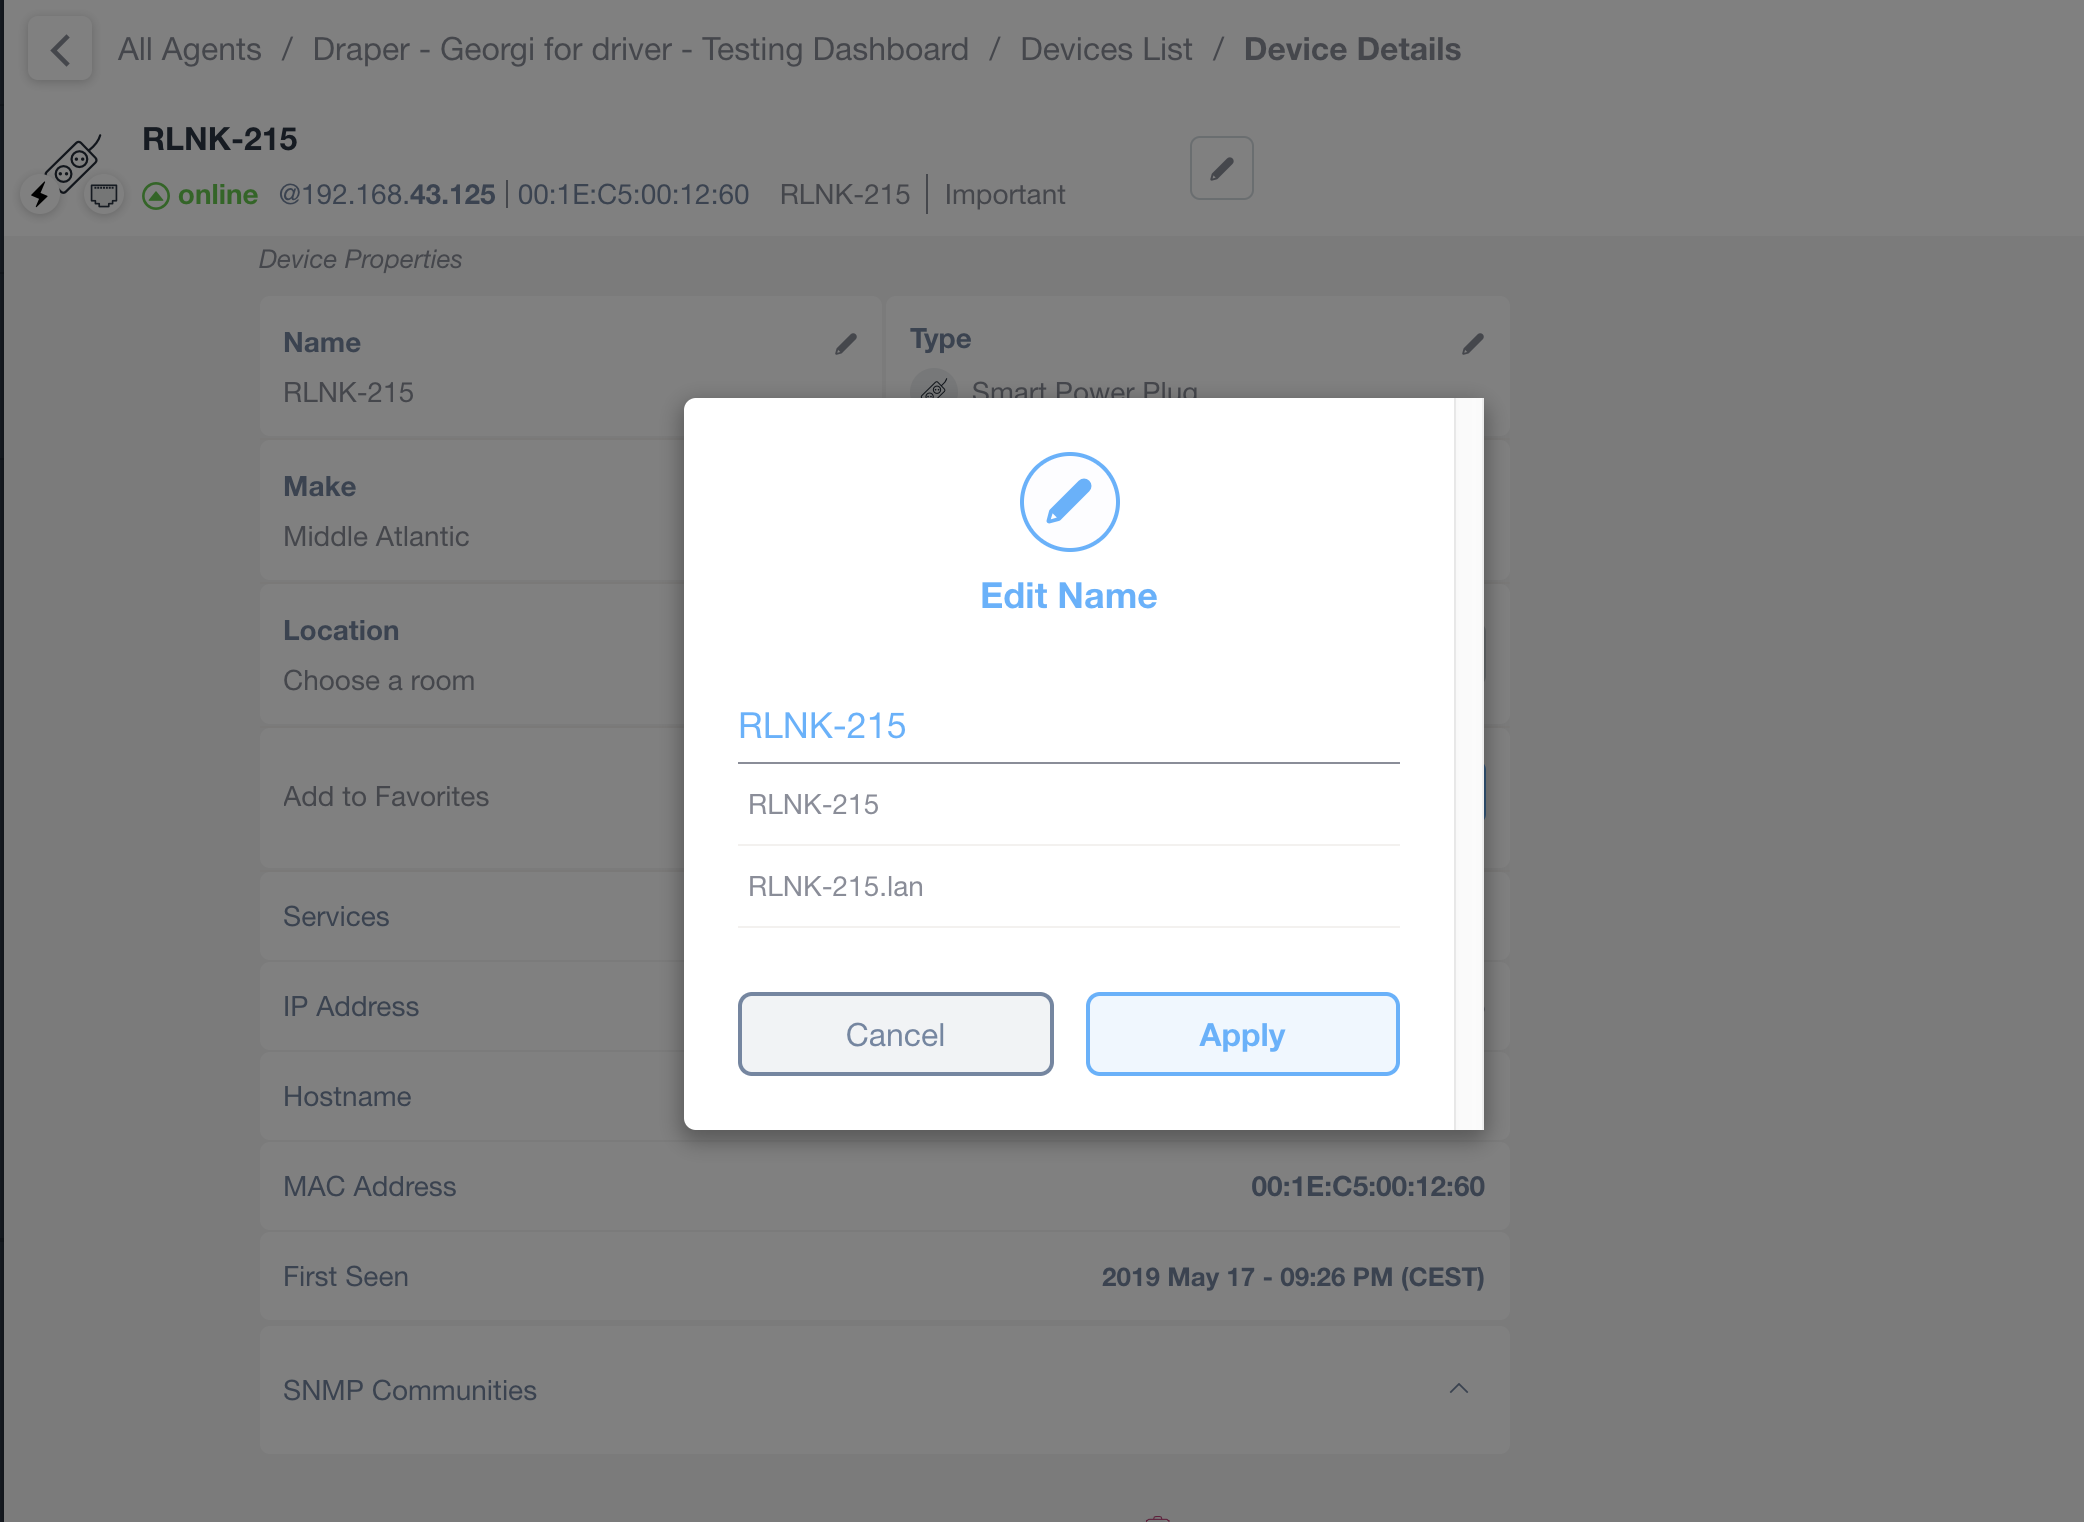
Renaming a Device in the Dashboard
1. Navigate to the "Device Details" section of the dashboard for the specific device, named RLNK-215.
2. Click the pencil icon next to the device name to edit it.
3. In the "Edit Name" dialog box, enter the new name for the device in the text field provided.
4. Choose from suggestions if they appear, or enter a custom name.
5. Click "Apply" to save the changes or "Cancel" to exit without saving.
Location is the room/site where the device is located and Zone is the area within the location (Rack, Floor #, etc.). These are all free text fields that also maintain a list of possible values so you don’t have to insert the same information multiple times.
Important/Indifferent
The Important/Indifferent option allows you to filter devices based on if they’re important or not for your company.
For example, your NAS would potentially be a device that you would like to be sure is always online and therefore you could mark it to be Important, then by tapping on the categories button in the main menu in the Domotz app, you can easily filter for important devices only.
Important/Indifferent this is a key concept within Domotz. Since all features of Domotz are available for each devices in a network, this is a way for professional installers and service providers can filter and identify devices they want to monitor.

Favorites and Device Status Options
1. "Add to Favorites" option with a star icon allows you to mark items for easy access.
2. "Important Device" label with a blue checkmark indicates this device has a priority status or is crucial in your settings.
It’s very easy to configure the Important/Indifferent status of a device. Simply click on either word to change the device from important to indifferent. In this example, the device is set to Important.
Some device types (e.g. Network Equipment) the device is marked as Important by default. This capability and its behaviour can be controlled and configured from the Portal.
Add To Favorites
You can add devices to your favorites list in order to have quick access if you want to be able to check in on them more often than the rest of your devices. To add a favorite, simply tap on the star in the Add to Favorites box and it’ll change from grey to yellow to indicate you made this device a favorite.

Favorite and Mark an Important Device
1. To add an item to your favorites, click on the star icon next to "Add to Favorites."
2. To mark a device as important, select the checkbox next to "Important Device."
Favorite is an information local to the user app. You may set different Favorites for the web app and others for the mobile app.
IP Addresses
Domotz allows you to choose your main IP address in case your devices have more than one. You can select which one of the detected IP addresses is the main one, so all your remote connections, as well as data connections such as SNMP or device integrations, would be performed against the main IP address you manually select.
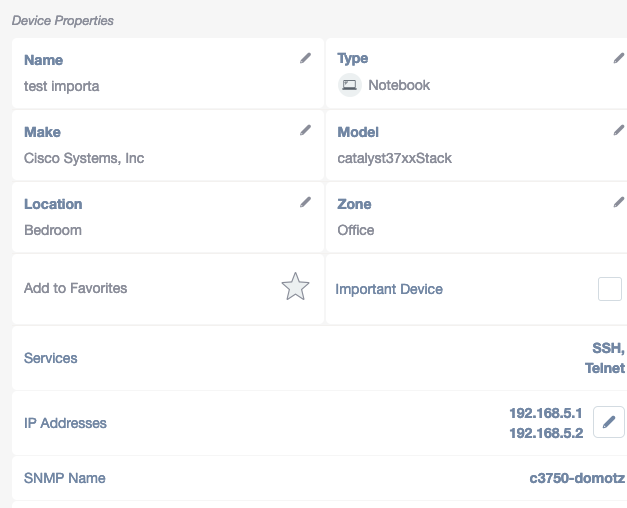
Device Properties Overview
1. The name of the device is "test importa."
2. The device type is identified as a "Notebook."
3. The make is listed as "Cisco Systems, Inc."
4. The model is specified as "catalyst37xxStack."
5. The device is located in the "Bedroom."
6. The zone is categorized under "Office."
7. There is an option to "Add to Favorites" or mark as an "Important Device."
8. The "Services" section is present but not detailed.
9. Under "IP Addresses," two IPs are listed: "192.168.5.1" and "192.168.5.2."
10. The "SNMP Name" is set to "c3750-domotz."
Choose among your IP addresses your main IP address for a selected device and apply:
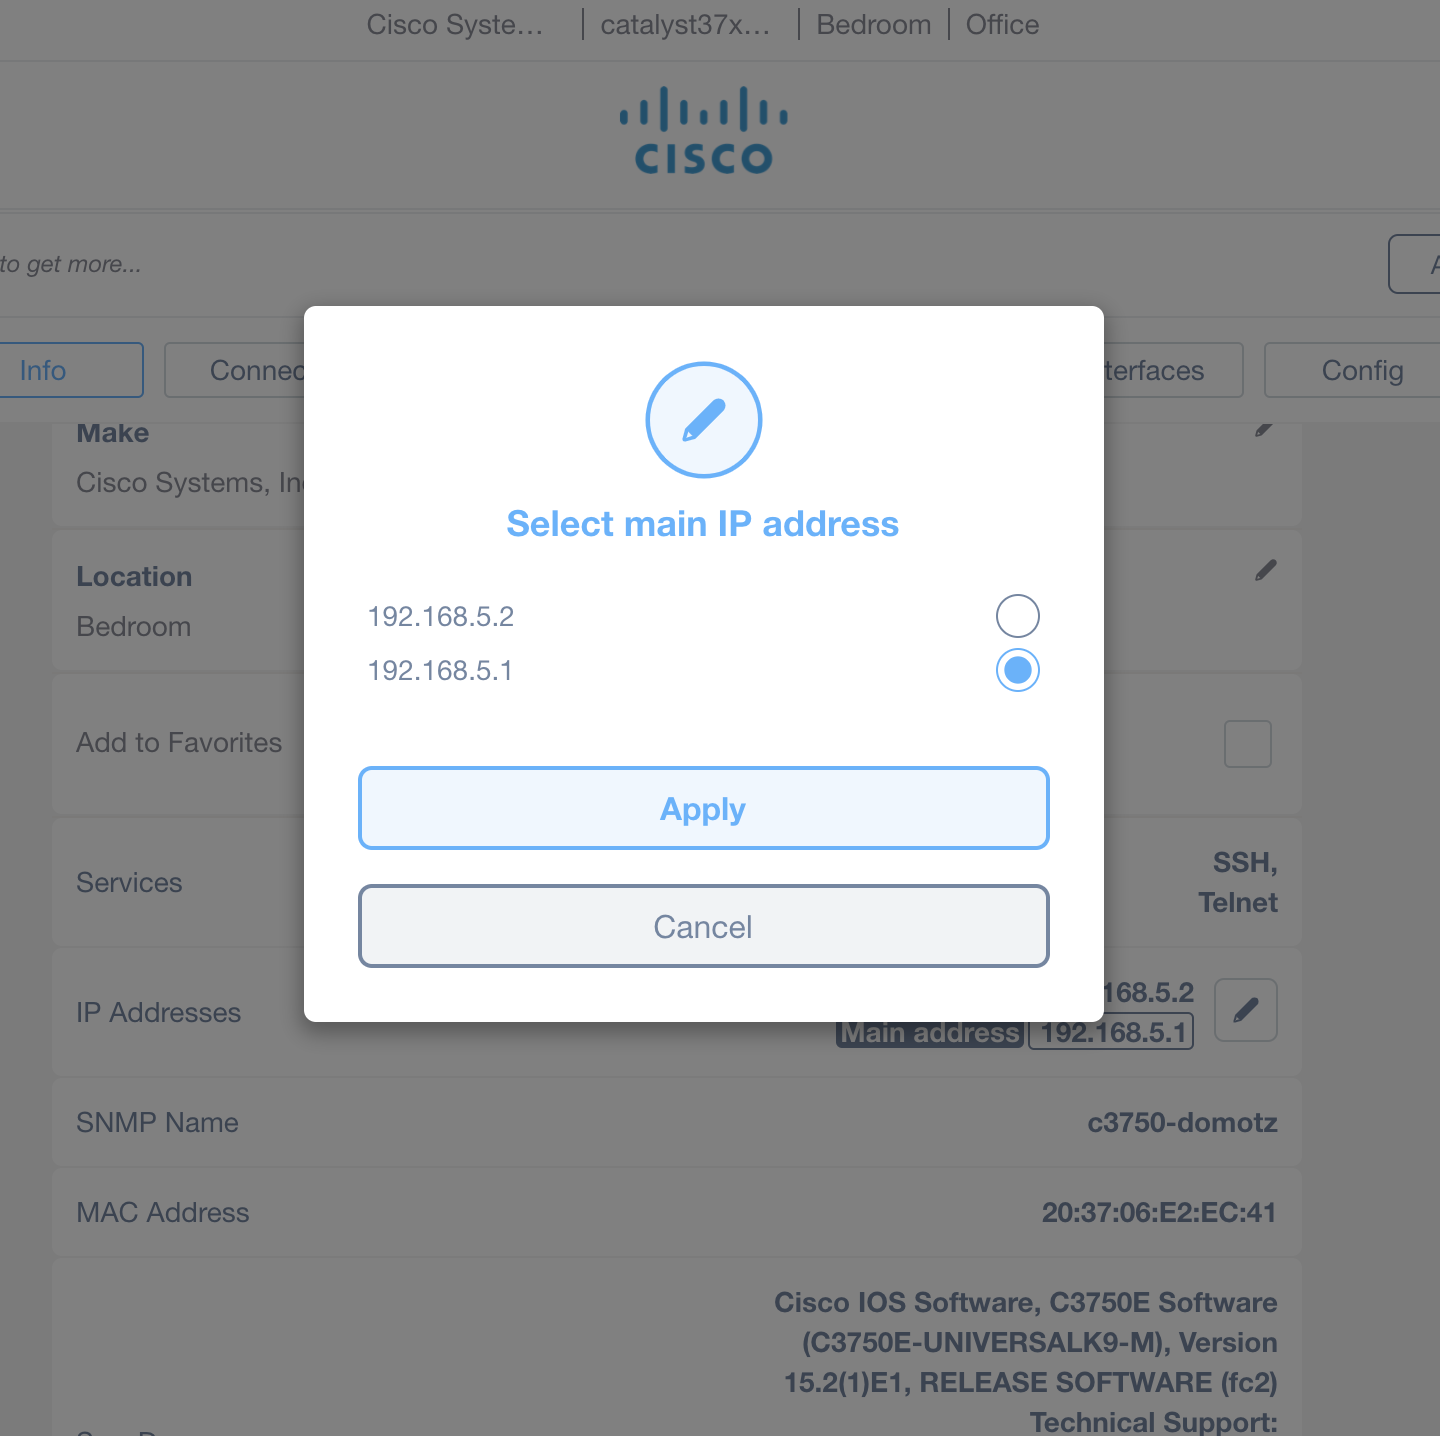
Selecting the Main IP Address in Cisco Software
1. A dialog box titled "Select main IP address" appears.
2. Two IP addresses are listed: 192.168.5.2 and 192.168.5.1. One address can be selected as the main IP.
3. Use the radio button next to the desired IP address to make your selection.
4. Once the preferred IP address is selected, click "Apply" to confirm the choice.
5. If you decide not to make a change, click "Cancel" to close the dialog without saving.
Note that the main IP address selection is available only if there is more than one IP address detected.
Delete Device
This option allows you to delete a device as the name suggests. You would use this option to remove a device that isn’t likely to re-appear on the network for whatever reason. In the screenshot below, we have a device that went offline 1 month ago and it should potentially be a prime candidate to be removed from your list of devices.
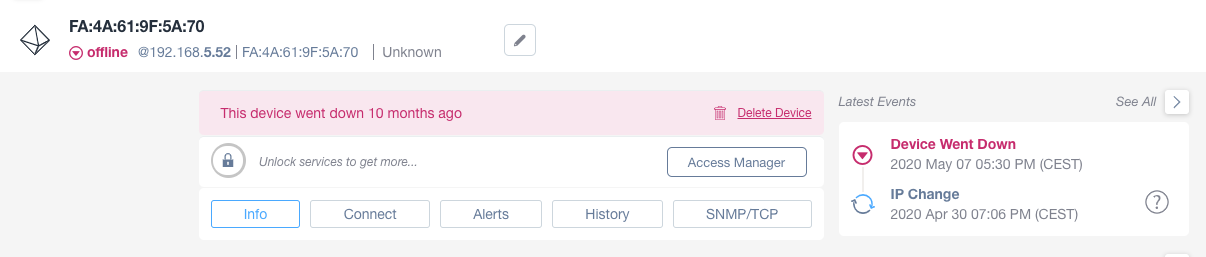
Device Status and Management Interface
1. The device with MAC address FA:4A:61:9F:5A:70 is currently offline. Its IP address is 192.168.5.52.
2. A notification indicates that "This device went down 10 months ago" with the option to "Delete Device" if necessary.
3. Available management actions include "Access Manager" and buttons for "Info," "Connect," "Alerts," "History," and "SNMP/TCP."
4. The sidebar shows the latest events, including "Device Went Down" on May 7, 2020, at 5:30 PM CEST, and an "IP Change" on April 30, 2020, at 7:06 PM CEST.
5. An option to "See All" past events is available on the right side.
The delete of an offline device is a logical remove of the device from the view. If it reconnects to the network, it’ll appear again in the list of devices. This allows the user to be always fully informed of the real status of the network and any connected device. It is possible to remove ALL the offline devices in once, from the Offline tab “Remove all offline devices” button.
You can also remove an online device. In this case all device data will be deleted and the device will reappear as new at the next scan.
Logical devices (also known as dummy devices) and external Hostnames/IPs can be deleted in the same way.
Please note that the “Delete Device” is available only in the Device List and not in the Inventory View. To go into the device list, please go to the Collectors tab in the inventory view, select the Collector you are interested in:
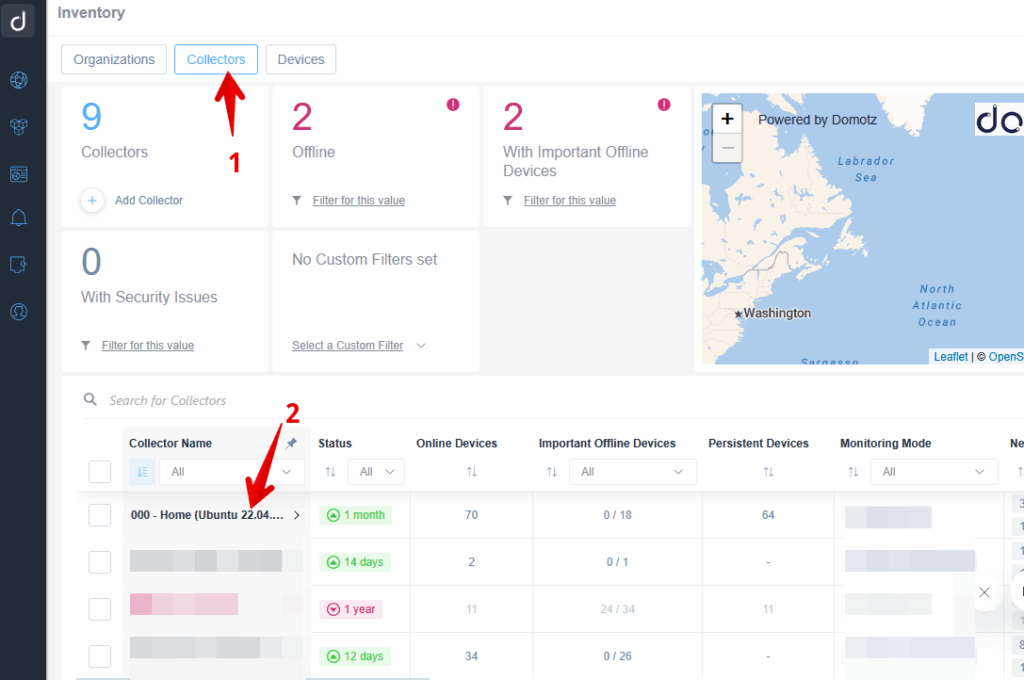
Accessing and selecting a collector in the inventory.
1. Click on the "Collectors" tab at the top to navigate to the Collectors section.
2. In the list of collectors, find and select the collector named "000 - Home (Ubuntu 22.04...)" to view its details or perform further actions.
Customizable Offline
This allows you to determine how long a device must be unresponsive before being considered offline. Domotz checks for the status of all devices every 30 seconds and by default reports the device as offline if it has not responded for 2 minutes (10 minutes for mobile devices). For some devices, this may be too frequent. If you would like to change this behaviour you can increase this up to a maximum of 24 hours. Details on how to do this are in the screenshots below:
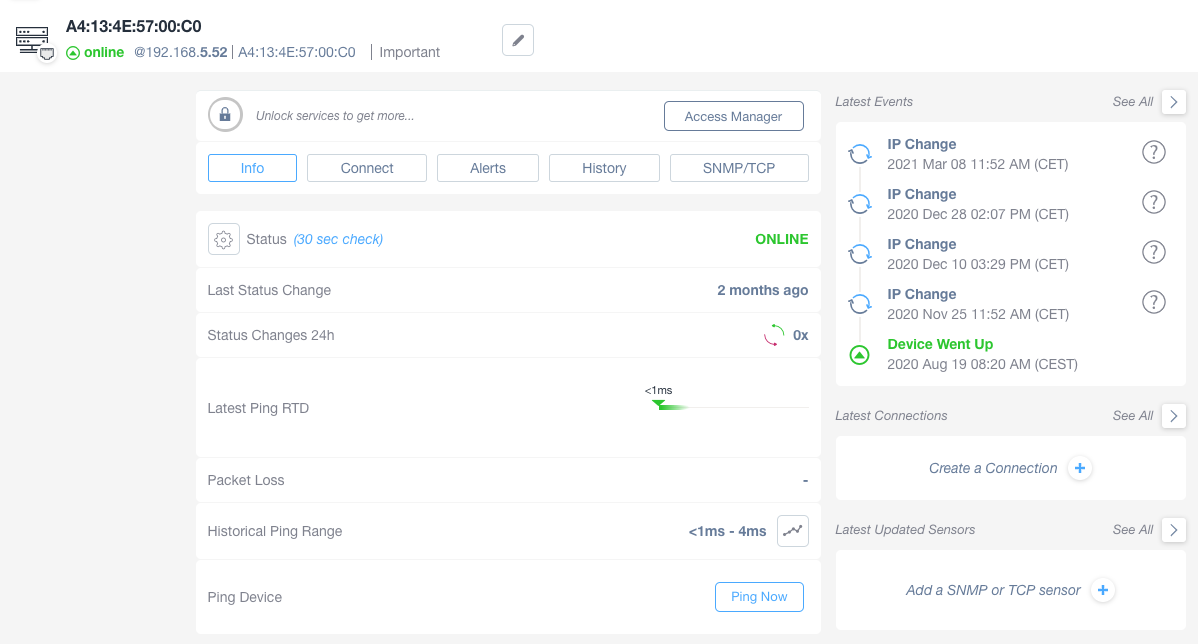
Device Monitoring Interface Overview
1. The device with MAC address A4:13:4E:57:00:C0 is currently online at IP address 192.168.5.52.
2. Key actions available: Access Manager, Info, Connect, Alerts, History, and SNMP/TCP.
3. The device status is checked every 30 seconds and currently displayed as "ONLINE."
4. The last status change occurred two months ago, with zero changes in the past 24 hours.
5. The latest ping round-trip delay is less than 1 millisecond, with zero packet loss.
6. Historical ping range is between less than 1 millisecond and 4 milliseconds. Click "Ping Now" for an immediate ping test.
7. Latest events are listed on the right-hand side, including multiple IP changes and a "Device Went Up" event on 2020 Aug 19.
8. For connections, there is an option to create a new connection.
9. To update sensors, add an SNMP or TCP sensor.
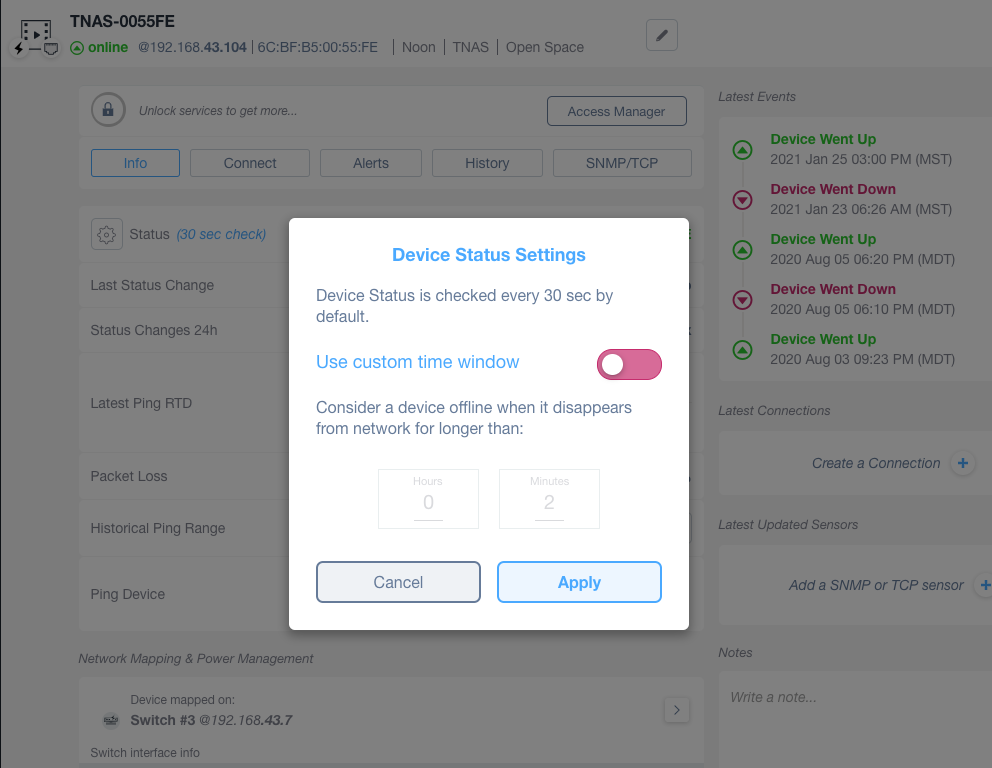
Device Status Settings Configuration
1. The page displays a section titled "Device Status Settings."
2. By default, the device status is checked every 30 seconds.
3. To customize the checking interval, toggle the switch next to "Use custom time window."
4. Specify offline duration thresholds using the input fields for hours and minutes.
5. Confirm changes by clicking "Apply" or discard changes with "Cancel."
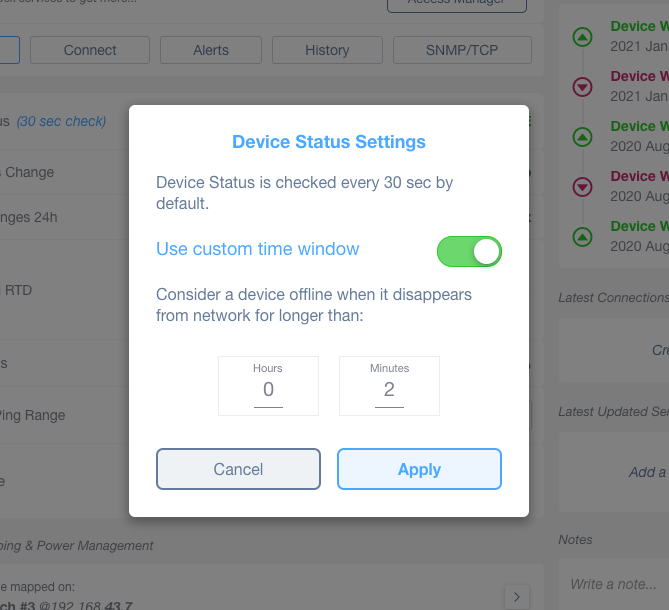
Device Status Settings Configuration
1. The panel allows you to configure how often the device status is checked. By default, it checks every 30 seconds.
2. To override the default setting, toggle the "Use custom time window" switch to on.
3. Set the custom offline detection threshold by specifying the time the device can disappear from the network before being considered offline. Adjust the "Hours" and "Minutes" fields as needed.
4. Click "Apply" to save your changes or "Cancel" to exit without saving.
Once you have changed the setting the Status line will now reflect the new frequency. Please note that there are 3 possible Status messages:
- Online
- Online – Unreachable: the device has not responded at the last status check but has not yet reached the new customized offline threshold. E.g. for the first 10 minutes a mobile device with Custom Offline thresholds set (10 minutes) disappears from the network.
- Offline
Mobile devices by default will use a custom time window of 10 minutes to avoid frequent online/offline messages from being sent. This can be edited just like any other device.
Power on/off, power re-cycle & PoE Network Switch mapping
In case a device is connected to a PDU, a smart plug or a PoE network switch, additional elements are shown in the Info section. Power control to on/off or just re-cycle the device are directly available at this level:
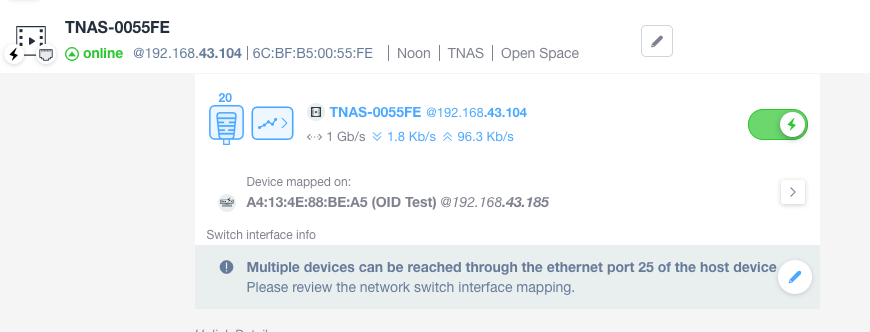
Network Device Status and Details
1. The network device is labeled TNAS-0055FE and has an online status, indicated by a green status icon. Its IP address is 192.168.43.104, with a MAC address of 6C:BF:B5:00:55:FE.
2. The connection speed is displayed as "1 Gb/s" with current data transfer rates of 1.8 Kb/s for download and 96.3 Kb/s for upload.
3. The device is mapped onto another device with the identifier A4:13:4E:88:BE:A5, labeled as "OID Test," at IP address 192.168.43.185.
4. A message is shown indicating that multiple devices can be reached through Ethernet port 25 of the host device, advising to review the network switch interface mapping.
Native Reboot buttons for supported devices
For certain supported devices we also include a Reboot Now button which makes use of the native reboot software commands to the device itself. This button will be visible below the Status section as in the image below. For a complete list of supported devices, refer to the Community forum pages at http://community.domotz.com
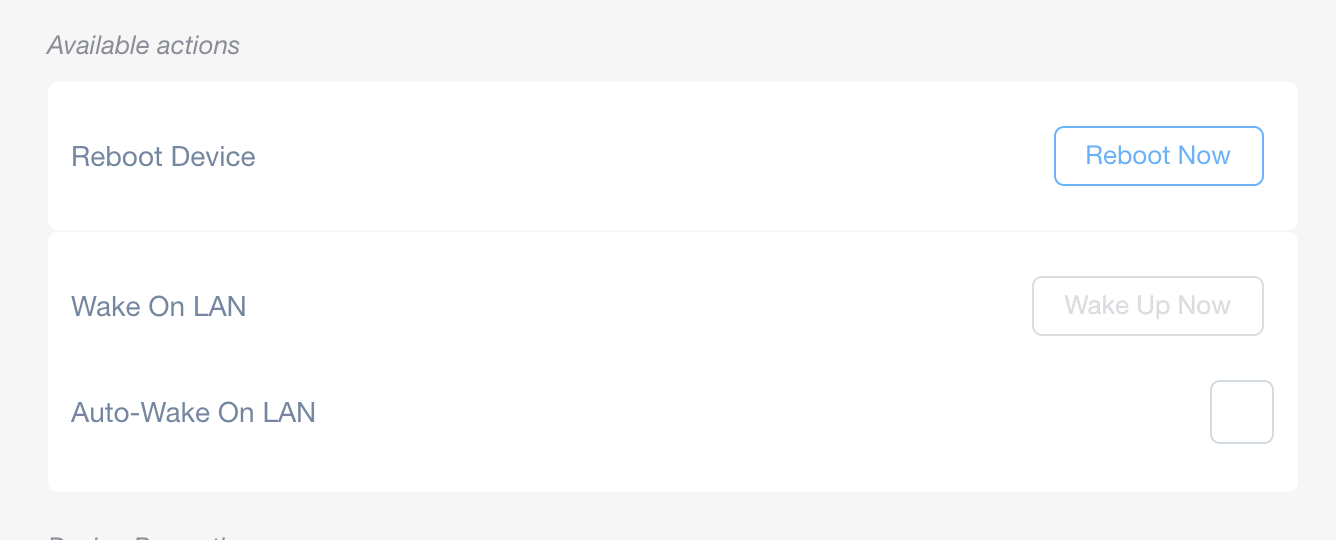
Device Management Options Overview
1. To reboot the device, click the "Reboot Now" button next to "Reboot Device."
2. The "Wake On LAN" option is available, but the "Wake Up Now" button is grayed out, indicating it is not currently active.
3. To enable "Auto-Wake On LAN," check the empty checkbox next to it.
Other details and Wake On LAN Management
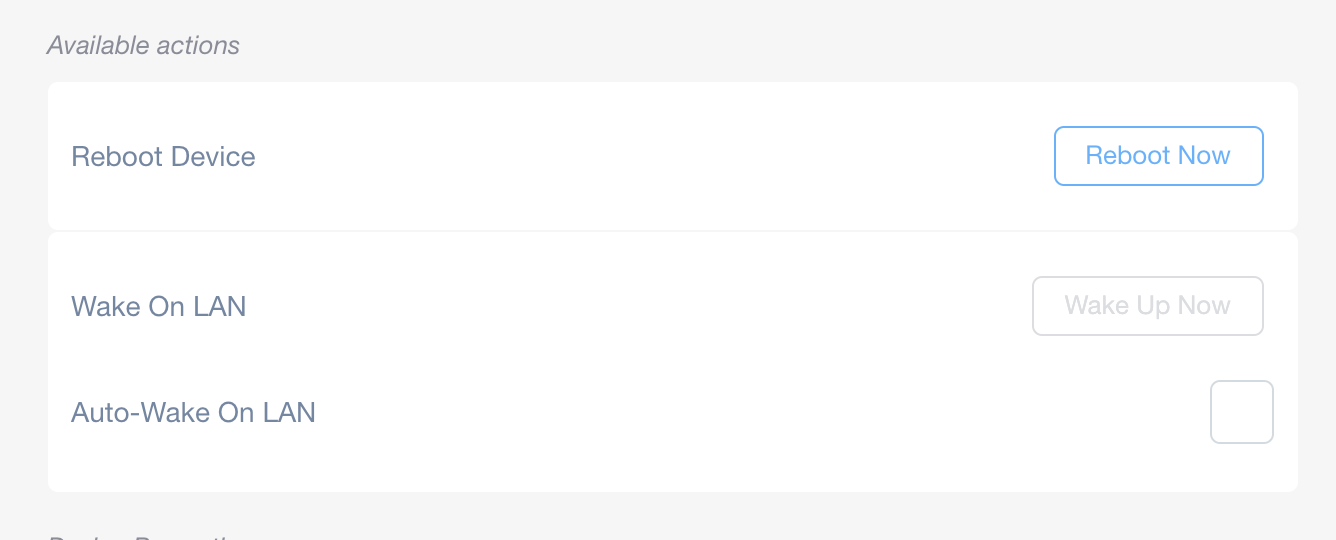
Device Management Options Overview
1. To reboot the device, click the "Reboot Now" button next to "Reboot Device."
2. The "Wake On LAN" option is available, but the "Wake Up Now" button is grayed out, indicating it is not currently active.
3. To enable "Auto-Wake On LAN," check the empty checkbox next to it.
In the Available Actions section, Domotz provides the support for Wake On LAN.
- Enable Auto-WOL toggle: enable Automated Wake on LAN. A WOL command is automatically sent if the device goes offline.
(*) Wake on Lan command has effect only if the device is actually supporting Wake On Lan.
Response Time Delay
From the device info window you can see the last RTD value for the device, and the historical values. A new RTD value is presented every 30 minutes. If you want to disable the automatic ping requests from the devices to the Agent you can do it from the Manage Devices or Subnets

Network Ping Information Display
1. The "Latest Ping RTD" shows the most recent ping round-trip delay time, indicated as less than 1 millisecond.
2. The "Historical Ping Range" presents the range of past ping times, marked as between less than 1 millisecond and 2 milliseconds. A graph icon next to this provides access to a more detailed view of historical ping data.
Clicking on the historical graph icon you’ll see the history of values and the possibility to perform a ping command from the device to the Domotz Agent.
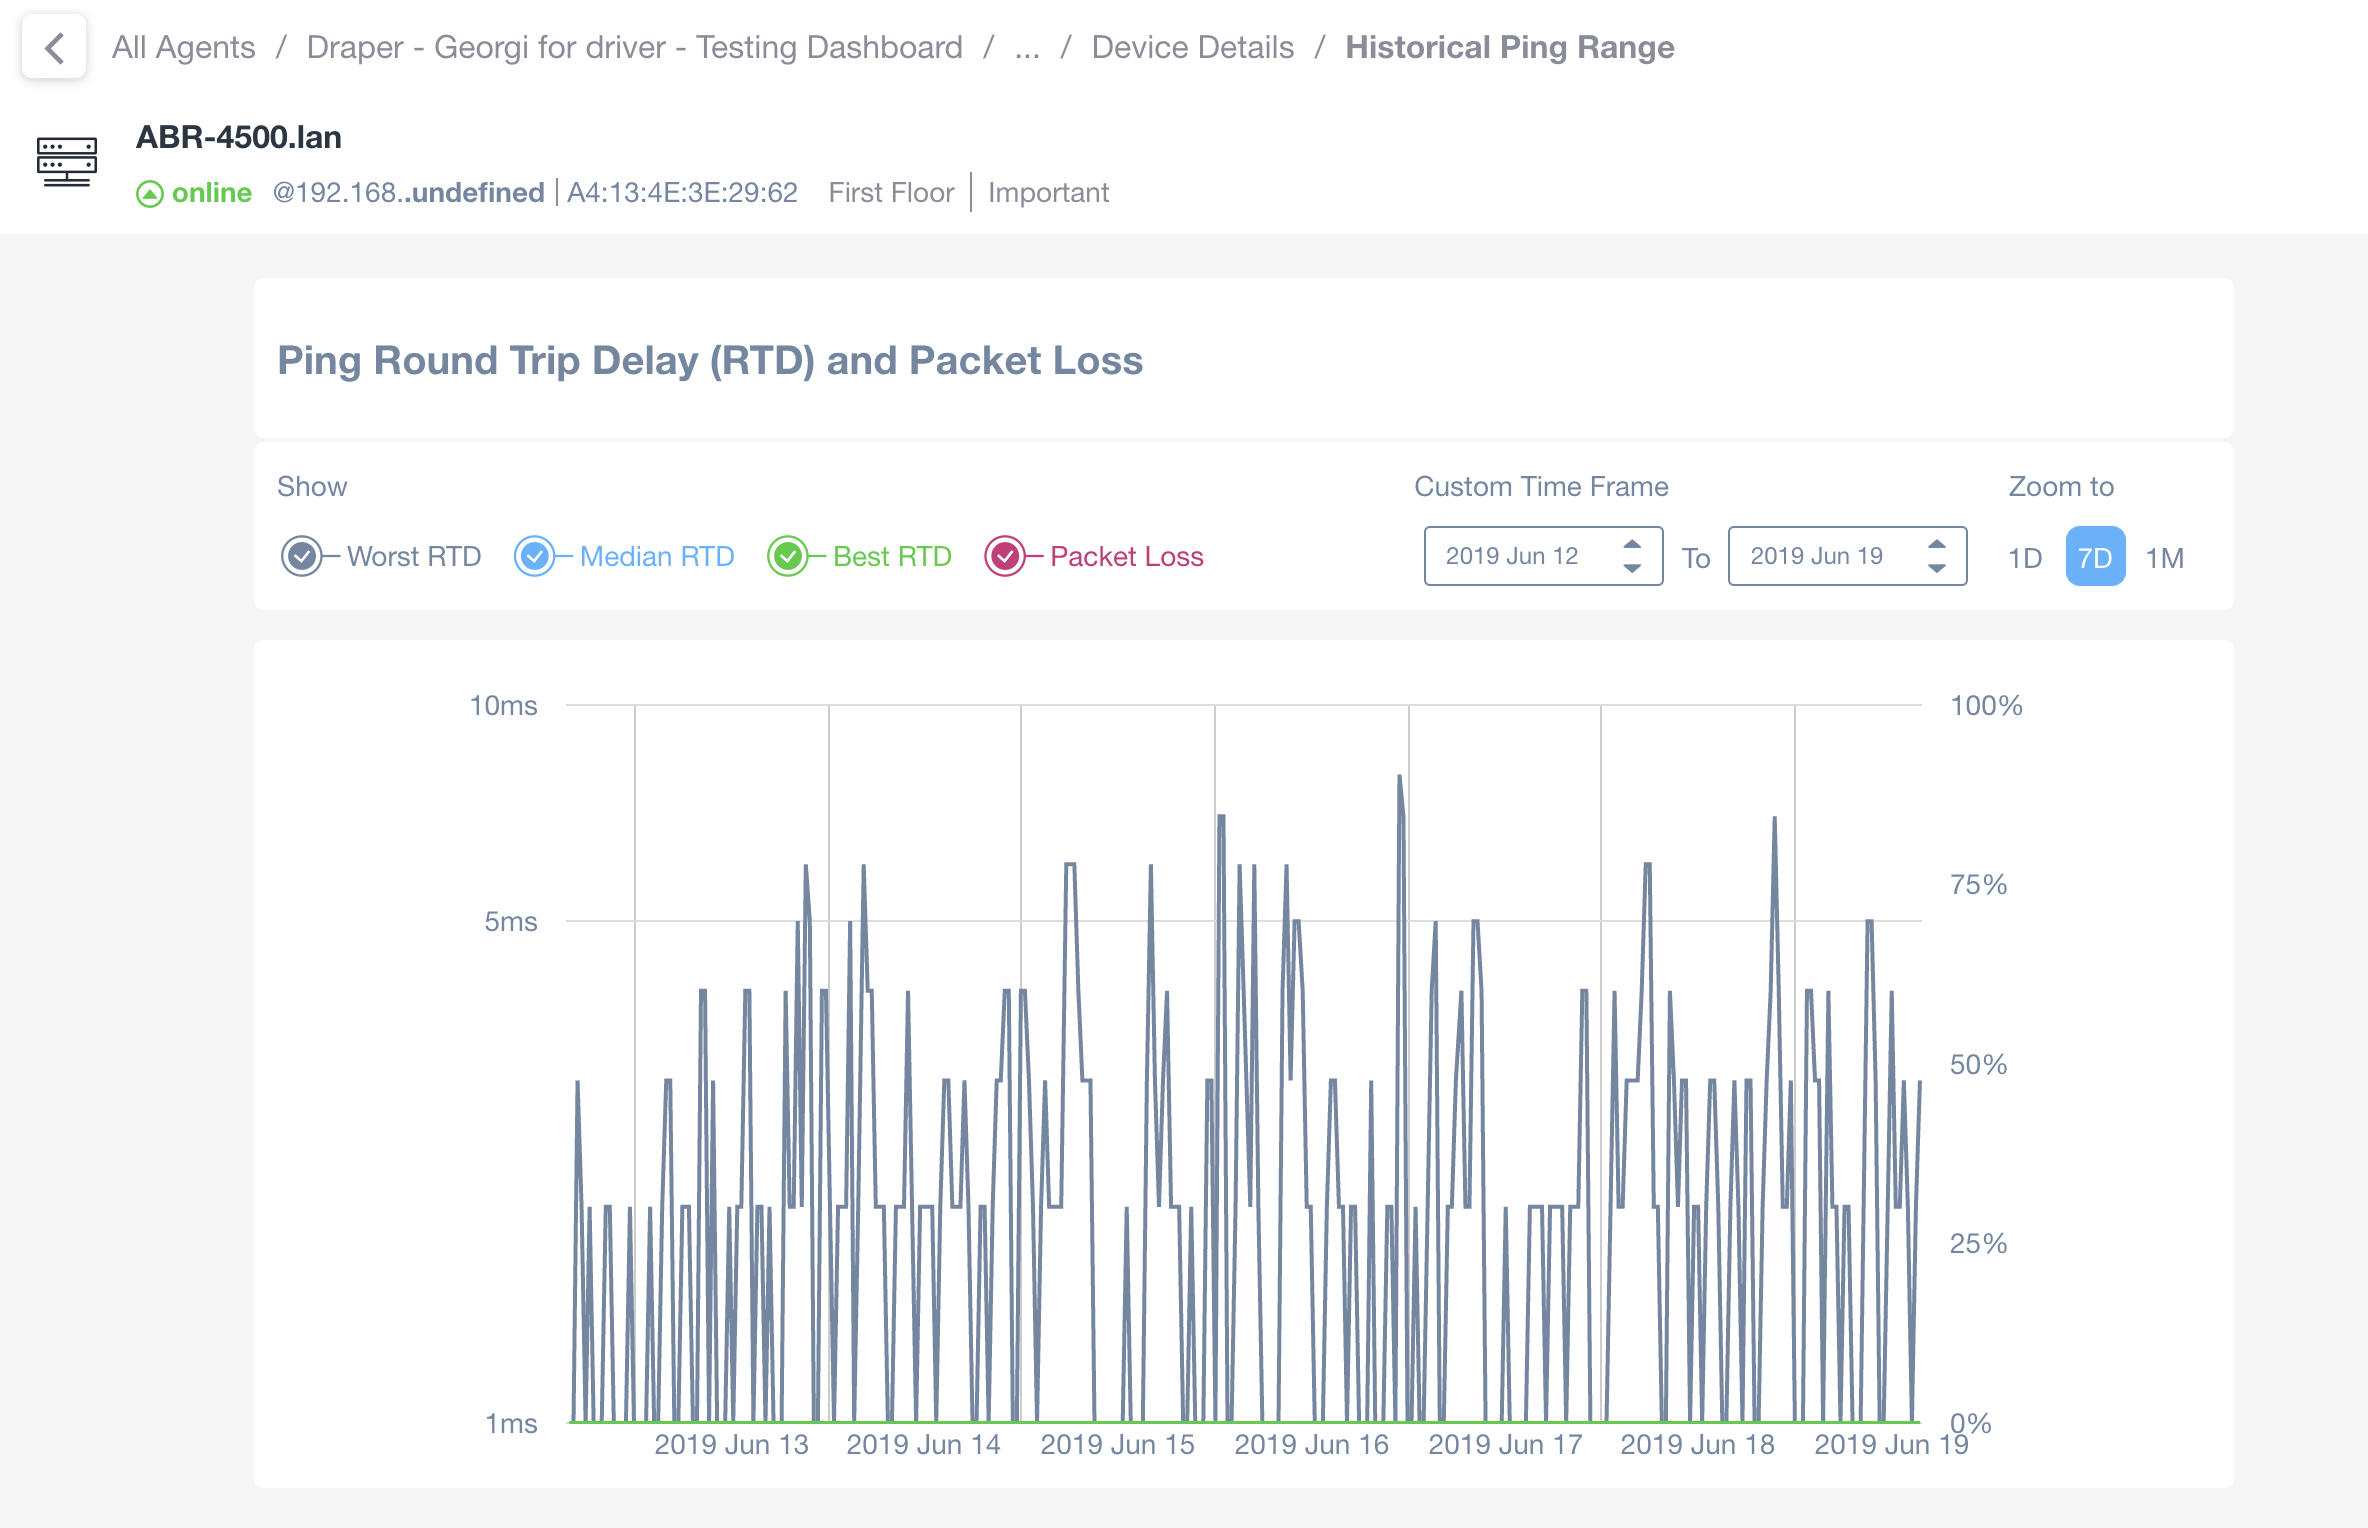
Ping Round Trip Delay (RTD) and Packet Loss Chart
1. The chart displays ping round trip delays and packet loss over a selected time frame.
2. The device monitored is "ABR-4500.lan," currently online.
3. Select data to display using options for Worst RTD, Median RTD, Best RTD, and Packet Loss.
4. Adjust the custom time frame by selecting dates from June 12, 2019, to June 19, 2019.
5. Use zoom options to view data in 1-day, 7-day, or 1-month intervals.
6. The vertical axis indicates measurement in milliseconds for RTD and percentage for packet loss.
7. Data points on the graph show variability in network performance over time.
You also have the possibility to set an alert on the latest RDT value
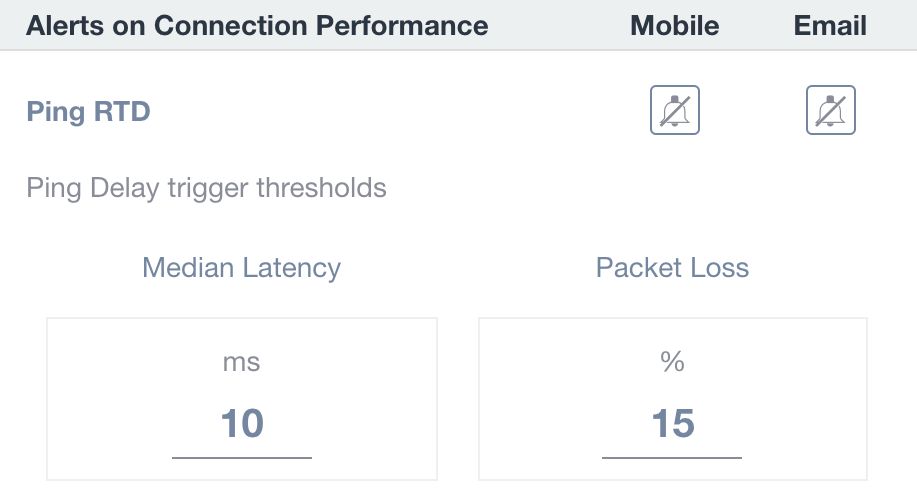
Connection Performance Alerts Configuration
1. Navigate to the "Alerts on Connection Performance" section.
2. Under "Ping RTD," configure the Ping Delay trigger thresholds.
3. For "Median Latency," set the threshold value in milliseconds to 10.
4. For "Packet Loss," set the threshold value as a percentage to 15.
5. Use the options under "Mobile" and "Email" to manage alert notifications for these thresholds.
Connect tab
This section includes all the Remote Connect features available for the specific device. The section is fully described in this article.
Alerts tab
This section allows the configuration of Alerts for the specific device. This section is fully described in this article.
History tab
The History tab displays how many times your device has connected to- and disconnected from the network and at what time(s) it occurred.
Domotz performs a connectivity check (heartbeat) and reports in this section when changes in connectivity have occurred.
Some devices (e.g. mobile) can lose connectivity quite often during normal operation, so such details may not be relevant.
For many other devices, History offers a useful snapshot of the recent history of the device. It can help to visualize a behaviour that you may not otherwise notice and tell you if further investigation is needed.
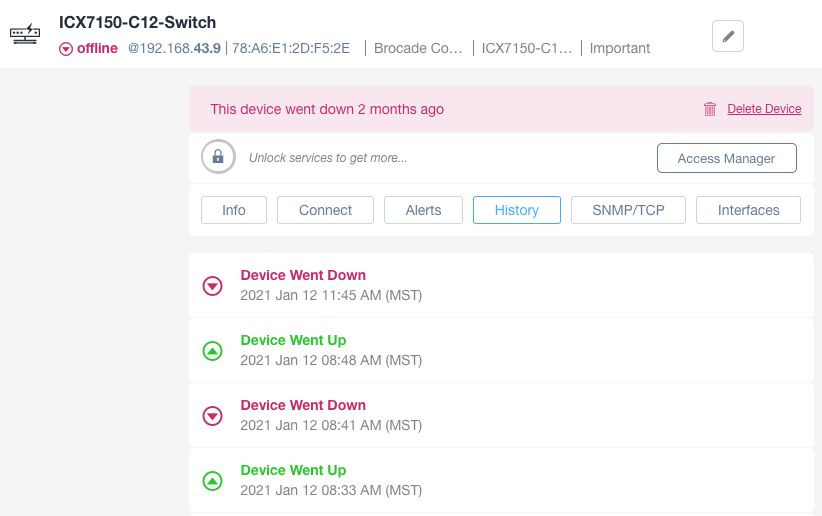
Switch Device History and Status Panel
1. The device named ICX7150-C12-Switch is currently offline, indicated by the status in red.
2. The IP address and MAC address of the switch are displayed along with its importance tag.
3. A warning message states that the device went down 2 months ago.
4. There are options to unlock services and access further management tools via the "Access Manager" button.
5. The panel includes several tabs: Info, Connect, Alerts, History (selected), SNMP/TCP, and Interfaces.
6. Under the History tab, a log displays the device's status changes:
- Device went down on January 12, 2021, at 11:45 AM (MST).
- Device went up on January 12, 2021, at 08:48 AM (MST).
- Device went down on January 12, 2021, at 08:41 AM (MST).
- Device went up on January 12, 2021, at 08:33 AM (MST).
7. There is also an option to delete the device from the system.
SNMP tab
This section allows you to monitor SNMP sensors. Learn more from our Help article about SNMP Monitoring.
TCP tab
This section allows you to monitor and manage TCP services. Learn more from our Help article about TCP Services Monitoring.
System tab
This section allows you to monitor and manage Operating System info such as architecture, build number, name, vendor, version, etc. In addition, it provides access to physical (disks, memory, CPU, etc.) and logical data of the monitored device. Learn more from our Help article about OS Monitoring.
Context-dependent tabs
A number of tabs, available for specific types of devices and enabling specific features, are shown in the Device Details screen. Examples are as follows:
- The Config tab. This is enabled for certain types of networking devices, to implement configuration management. See here for more details (see Network Configuration management).
- The Outlets tab. This is enabled for IP-based PDUs, smart plugs (see Remote Power Management).
- The Interfaces tab. This is enabled only for devices that expose SNMP-enabled network interfaces. It contains most of the. (see Managed Switches and PoE).
- The Camera tab. This is enabled for IP cameras supporting the ONVIF tab. (see Advanced hardware Integrations)
- The Access Point tab. This is enable for certain types of wi-fi access points (see Advanced hardware Integrations)
- Other Device-specific integration tabs. A number of tabs are also displayed for other devices with special integrations (see Advanced hardware Integrations)
Quick Views
On the right menu you can see the latest events for the selected device, together with the latest connections made on that device.
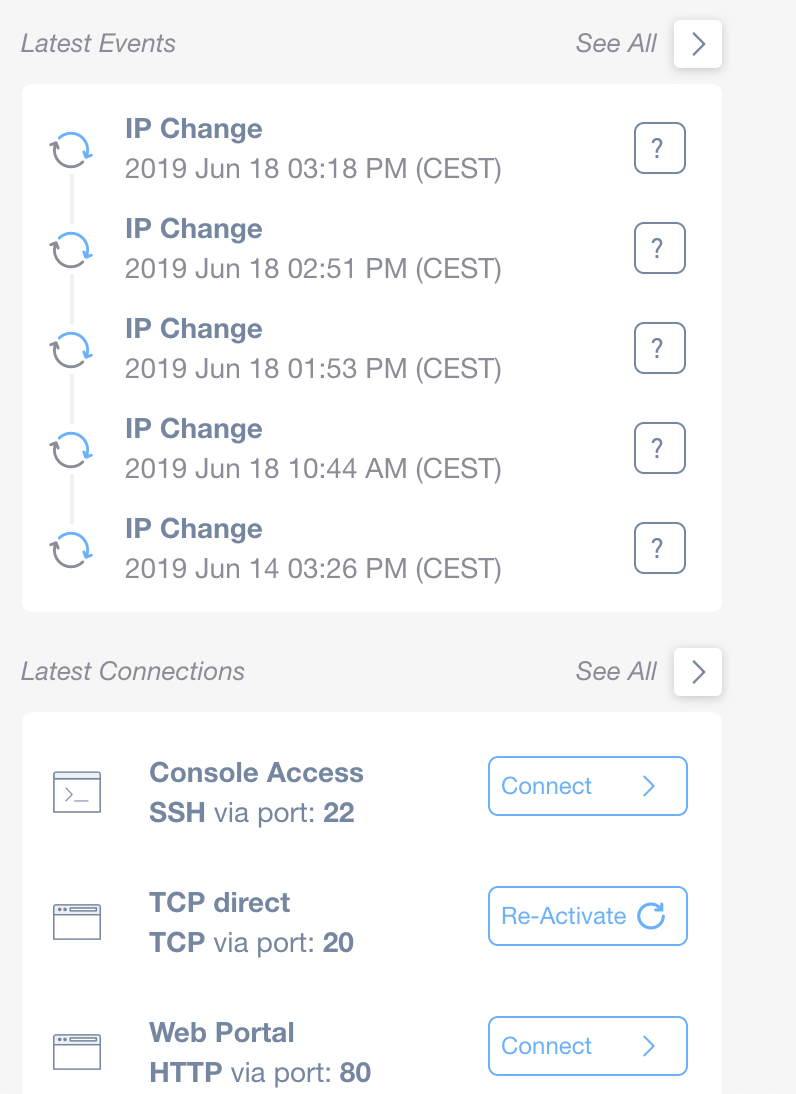
Network Activity and Connection Options
1. Under "Latest Events": A list of IP changes, each showing a time and date, such as "2019 Jun 18 03:18 PM (CEST)". Selecting the question mark icons next to each entry provides more details.
2. Under "Latest Connections": Options to connect via different methods.
- "Console Access" for SSH using port 22, with a "Connect" button.
- "TCP direct" using TCP via port 20, offering a "Re-Activate" button.
- "Web Portal" for HTTP using port 80, with a "Connect" button.
Use these options to monitor recent IP changes and manage connections.
The latest updated SNMP and TCP are also visible together with a Notes field that can be used to leave a memo for the device.
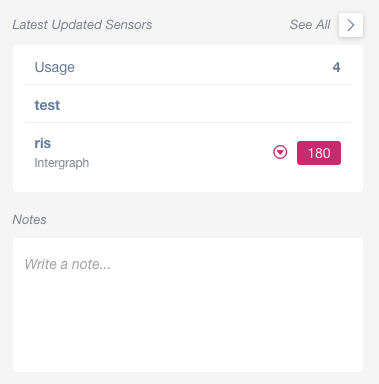
Overview of the Latest Updated Sensors Panel
1. Review the "Latest Updated Sensors" section, which displays recent changes to sensor data. Click "See All" to view a complete list.
2. Under "Usage," note the value "4," indicating the number of updates or activities.
3. Two sensors are listed: "test" and "ris."
- The sensor "test" displays only the name.
- The sensor "ris" includes additional information: the provider "Intergraph" and a status indicator with the value "180."
4. At the bottom, there is a "Notes" section where you can write additional information or observations.
Device Settings and Properties
All the Settings and Properties of a selected device (Name, Type, Model, Location, SNMP sensors, Triggers, etc), can be exported in a JSON file for backup purposes, or in order to create a template that can then be applied to multiple other devices.
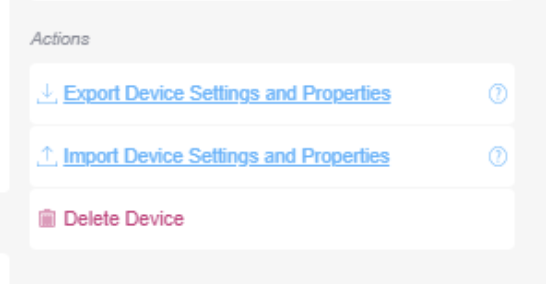
Actions menu in device settings.
1. To save current settings and properties, click "Export Device Settings and Properties."
2. To apply settings from a saved file, click "Import Device Settings and Properties."
3. To remove the device from the system, click "Delete Device."
By pressing the Export Device Settings and Properties button you can export all its settings and properties to a configuration file (JSON format) that can be used as a template for other devices and agents.
By pressing the Import Device Settings and Properties button, you will be able to upload a configuration file that you have previously saved or edited and apply it to the device. In this case, you will be able to select which settings and properties (parameters included in the configuration file) you would like to override on your device.
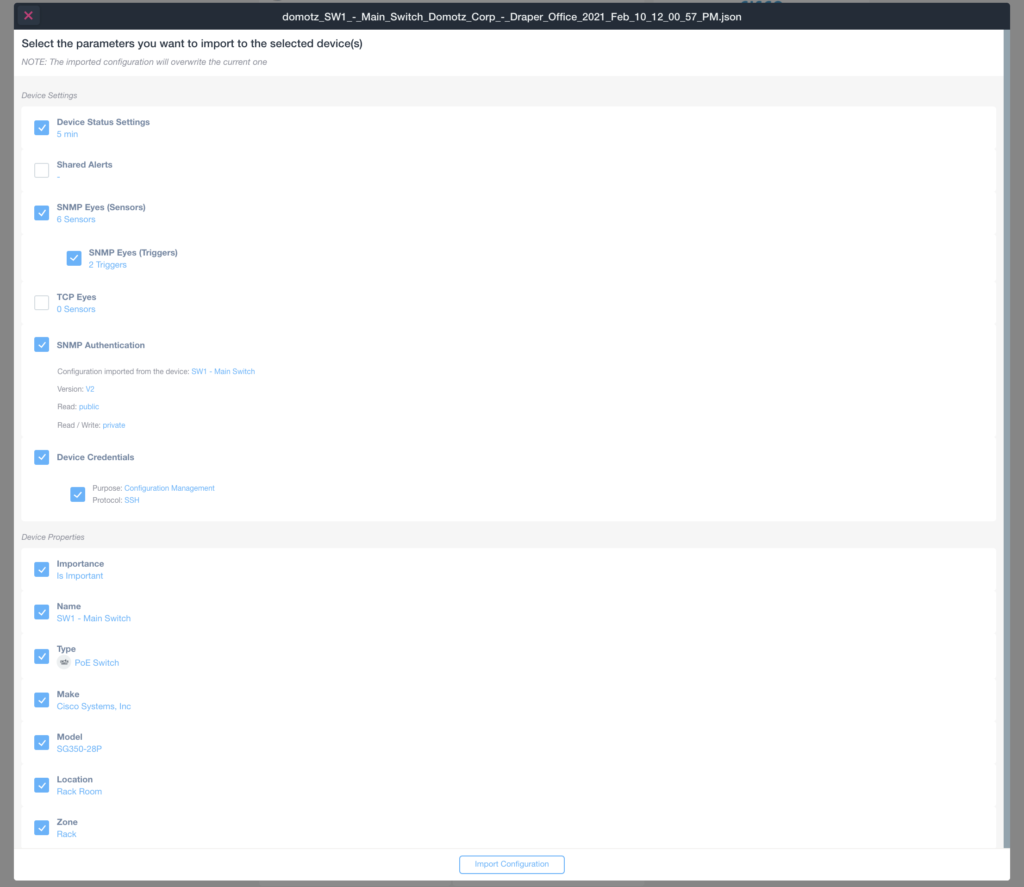
Import Configuration Parameters for Selected Devices
1. Under Device Settings, choose "Device Status Settings" to import status updates every 5 minutes.
2. Ensure "SNMP Eyes (Triggers)" is selected to import two SNMP triggers. SNMP Authentication should be active with details from "SW1 - Main Switch," using Version V2 and public read/write.
3. Check "Device Credentials" for configuration management using SSH protocol.
4. In Device Properties, select "Importance" to mark the device as important.
5. Confirm device details such as "Name" (SW1 - Main Switch), "Type" (PoE Switch), "Make" (Cisco Systems, Inc), "Model" (SG350-28P), "Location" (Rack Room), and "Zone" (Rack).
6. Click "Import Configuration" to apply these settings to the selected device(s).