
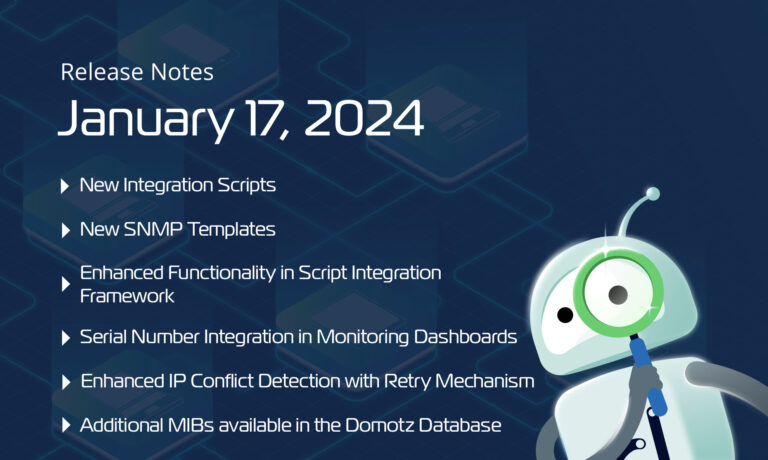
We want to start the new year with powerful new features, integration scripts, pre-configured SNMP templates, and improvements available on Domotz. This month’s exciting updates include enhanced functionalities in the integration script framework, the possibility to have the serial number column in the monitoring dashboards, enhanced IP Conflict detection with Retry Mechanism, new MIBs, and more.
Here’s what’s new and improved on Domotz this month.
We constantly improve Domotz and welcome your feedback. Don’t hesitate to contact our support team at support@domotz.com for help or suggestions.
New Integration Scripts
You can use custom integration scripts to monitor and manage, for example, network-connected devices, cloud services, and web applications. By using standard network protocols, these scripts will allow you to retrieve valuable data and execute actions on the monitored devices and services.
This month, we released the following:
Linux
Proactive monitor Linux host, with the following custom scripts:
- Linux CPU Usage
- Linux CPU Utilization per Process
- Linux Hard Disk Partitions
Linux CPU Usage
You can use this script to monitor the CPU usage on a Linux host:
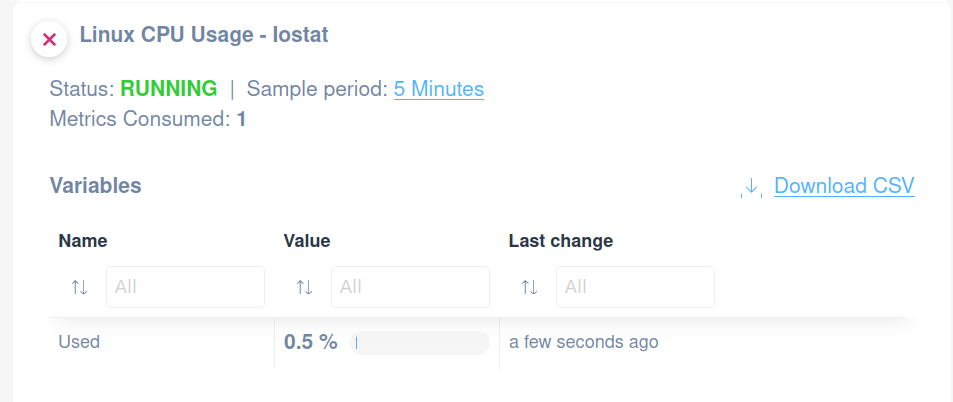
Monitoring Linux CPU Usage with Iostat
1. The "Linux CPU Usage - iostat" is actively running, as indicated by the status "RUNNING" in green.
2. The sample period is set to "5 Minutes."
3. The metrics consumed is "1."
4. Under "Variables," the "Used" CPU is currently at "0.5%."
5. The last change was recorded "a few seconds ago."
6. An option to "Download CSV" is available for exporting the data.
Linux CPU Utilization per Process
Apply this scripts to monitor the CPU utilization of chosen processes/services on Linux:
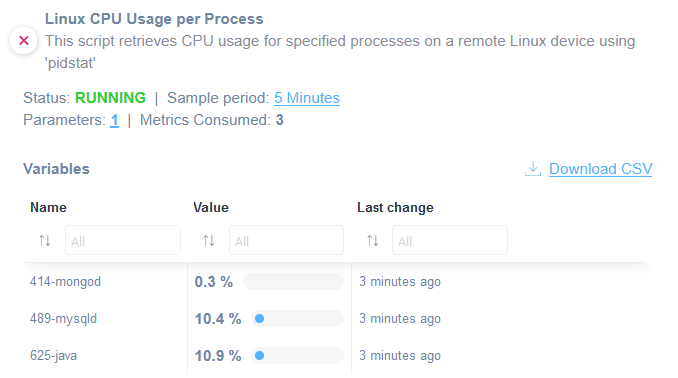
Linux CPU Usage Monitoring Interface
1. The interface shows a script that retrieves CPU usage for specified processes on a remote Linux device using 'pidstat'.
2. The current status is "RUNNING".
3. The sample period is set to 5 minutes with 1 parameter and 3 metrics consumed.
4. A table lists variables with columns: Name, Value, and Last change.
5. Under "Name", there are three processes: 414-mongod, 489-mysqld, and 625-java.
6. The "Value" column shows CPU usage: 0.3% for mongod, 10.4% for mysqld, and 10.9% for java.
7. The "Last change" column indicates updates were made 3 minutes ago for all processes.
8. There is an option to download the data as a CSV file.
Linux Hard Disk Partitions
Want to monitor hard drive partitions on Linux? Use the following script:
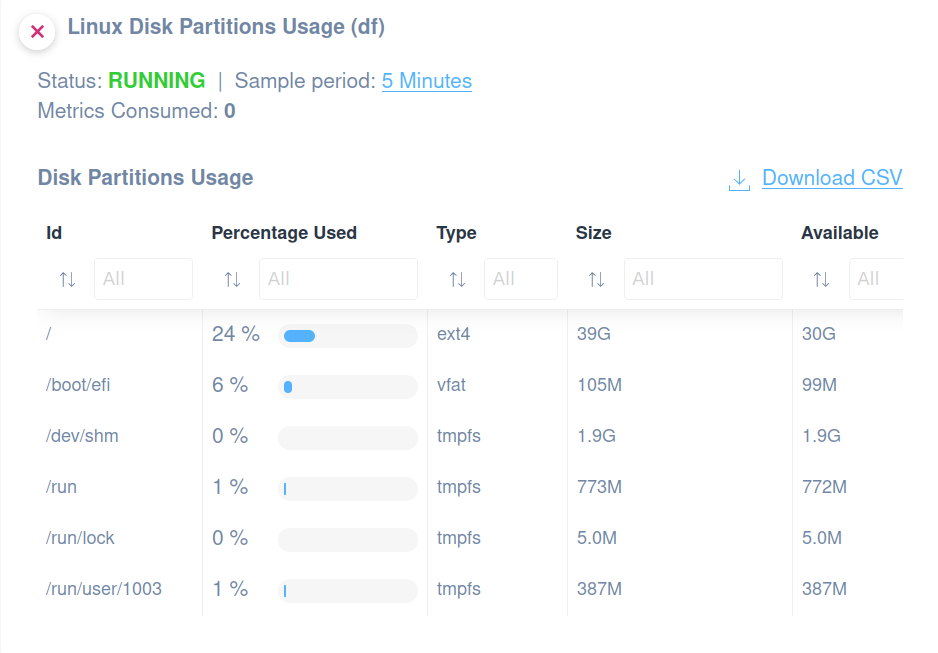
Linux Disk Partitions Usage Overview
1. The status of the disk monitoring is "RUNNING" with a sample period of 5 minutes and zero metrics consumed.
2. A table lists disk partitions with the following columns:
- **Id**: Indicates the mount point, such as "/", "/boot/efi", etc.
- **Percentage Used**: Displays the percentage of used space; for example, "/" uses 24%.
- **Type**: Shows the filesystem type like ext4 or vfat.
- **Size**: The total size of each partition, such as "39G" for "/".
- **Available**: The available space in each partition, with "/" having 30G available.
3. To download this data, use the "Download CSV" link provided.
You can find these scripts in our integration scripts library to use them as they are or customize them according to your requirements.
OPNsense
We create the following scripts to enable the proactive monitoring of an OPNsense host:
- General Monitoring
- Services
- Nat Rules
- Filter Rules
- Interface Stats (IPV4 and IPV6)
- Gateway Stats
General Monitoring
Use this script to extract the following information from an OPNsense host:
- Firmware Updates
- CPU Usage
- Memory Usage
- Product Version
- Swap Usage
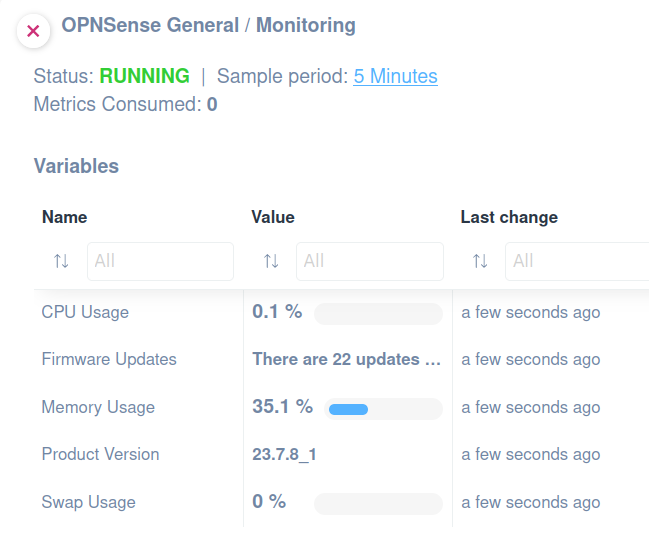
OPNSense Monitoring Dashboard Overview
1. The status of the system is indicated as "RUNNING," with a sample period of 5 minutes and zero metrics consumed.
2. Under the "Variables" section, key metrics are displayed:
- "CPU Usage" shows 0.1% with a recent change a few seconds ago.
- "Firmware Updates" indicate that 22 updates are available.
- "Memory Usage" is at 35.1%, with a roll-over bar showing utilization.
- "Product Version" is listed as 23.7.8_1.
- "Swap Usage" is at 0%, updated a few seconds ago.
3. Each variable is followed by a "Last change" column stating updates happened a few seconds ago.
Services
This script can be used to monitor chosen Services on an OPNsense host.
Apply this script to extract the following values:
- Service name
- Service Status
You might want to edit a parameter to choose specific services to be monitored, reducing the amount of metrics consumed.
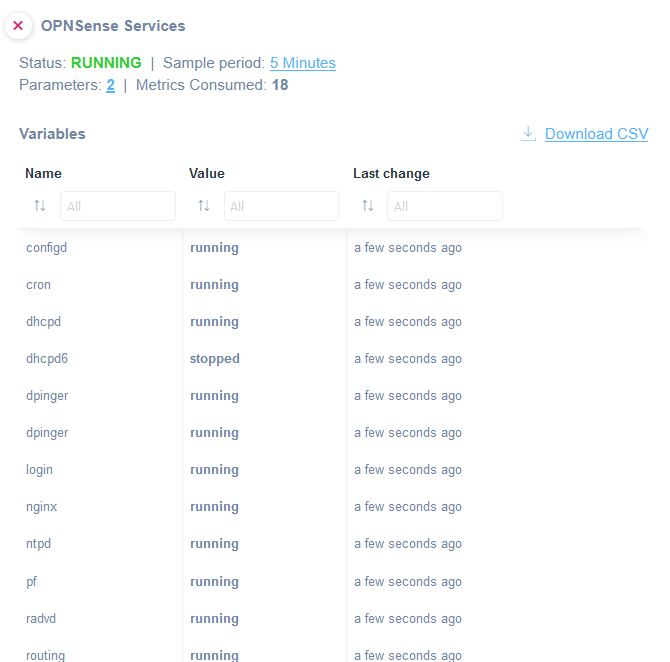
OPNSense Services Status Dashboard
1. The dashboard shows the status of OPNSense services, currently marked as "RUNNING."
2. The sample period is 5 minutes, with 2 parameters and 18 metrics consumed.
3. A table lists services under "Variables," with columns for "Name," "Value," and "Last change."
4. Each service name, such as "configd" and "cron," has an associated status value, like "running" or "stopped."
5. The "Last change" column indicates how recently each status was updated, noted as "a few seconds ago."
6. A "Download CSV" option is available for exporting the data.
Nat Rules
Use this script to monitor the Nat rules on an OPNsense host and the following values:
- Evaluations
- Bytes
- States
- States Creation
You might want to edit a parameter to filter amongst nat rules:
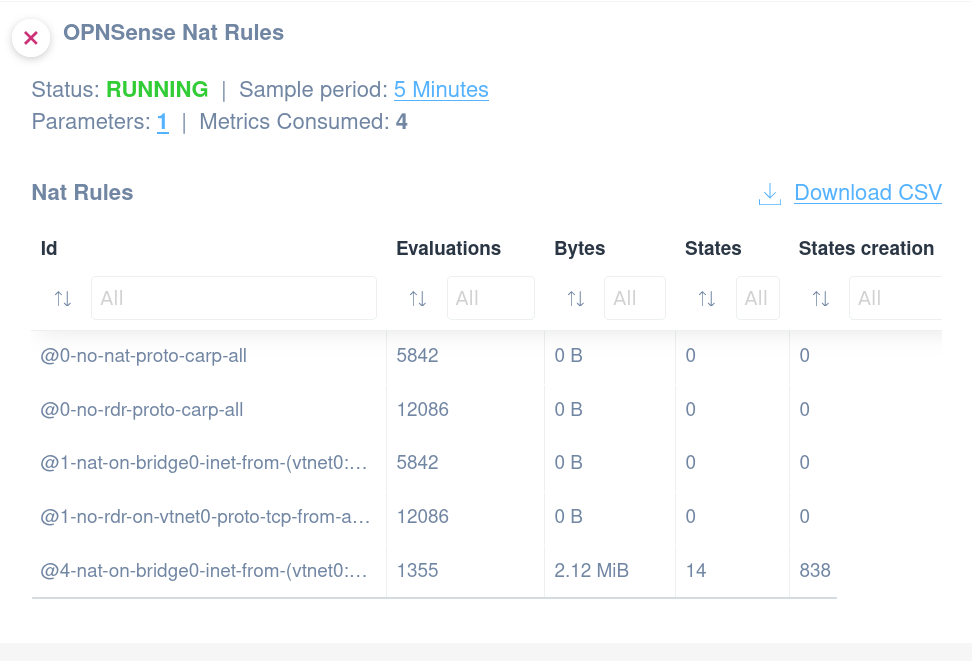
OPNSense NAT Rules Dashboard Overview
1. The status of the NAT rules is shown as "RUNNING." This indicates active processing.
2. The sample period is set to "5 Minutes," determining how often data is assessed.
3. There are "1" parameter and "4" metrics consumed in this setup.
4. A "Download CSV" option is available for exporting data.
5. The table displays NAT rules with headings: Id, Evaluations, Bytes, States, and States creation.
6. Example entries include:
- Rule "Id": @0-no-nat-proto-carp-all with "Evaluations": 5842, "Bytes": 0 B, "States": 0, "States creation": 0.
- Rule with "Id": @4-nat-on-bridge0-inet-from-(vtnet0…) has "Evaluations": 1355, "Bytes": 2.12 MiB, "States": 14, and "States creation": 838.
7. Data in columns can be sorted and filtered using the arrows and input fields at the top of each column.
Filter Rules
This script can be used to monitor the Filter rules on an OPNsense host.
- Evaluations
- Bytes
- States
- States Creation
You might want to edit a parameter to filter among rules.
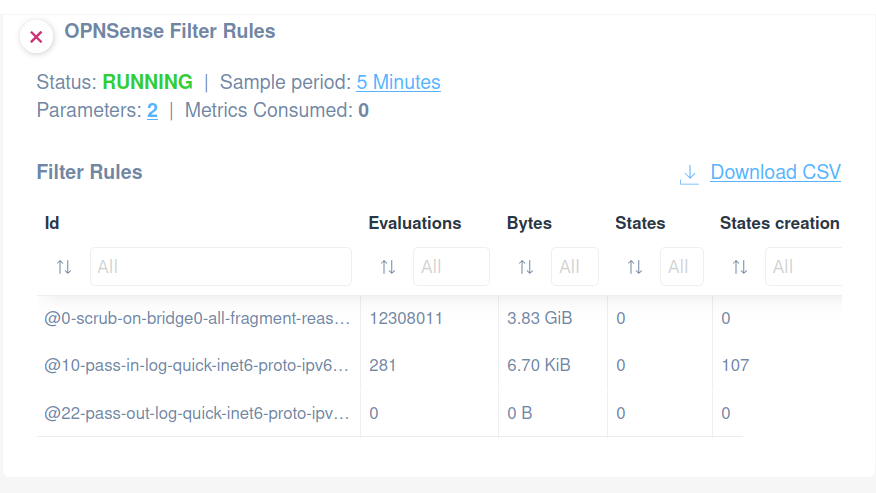
OPNSense Filter Rules Status and Details
1. The status is "Running," with a sample period of 5 minutes. Parameters and metrics consumed are listed as 2 and 0, respectively.
2. A link is available to download the data as a CSV file.
3. The "Filter Rules" table includes columns for Id, Evaluations, Bytes, States, and States creation.
4. The table lists three rules:
- Id: "@0-scrub-on-bridge0-all-fragment-reassembly" with 12,308,011 evaluations, 3.83 GiB bytes, 0 states, and 0 states created.
- Id: "@10-pass-in-log-quick-inet6-proto-ipv6" with 281 evaluations, 6.70 KiB bytes, 0 states, and 107 states created.
- Id: "@22-pass-out-log-quick-inet6-proto-ipv6" with 0 evaluations, 0 B bytes, 0 states, and 0 states created.
Interface Stats (IPV4 and IPV6)
This script can be used to monitor interface statistics (IPV4 and IPV6) on an OPNsense host.
The following values can be monitored:
- Interface Name
- References Number
- Blocked In Traffic
- Passed In Traffic
- Blocked Out Traffic
- Passed Out Traffic
- Cleared Time
You might want to edit a parameter to filter on interface names.
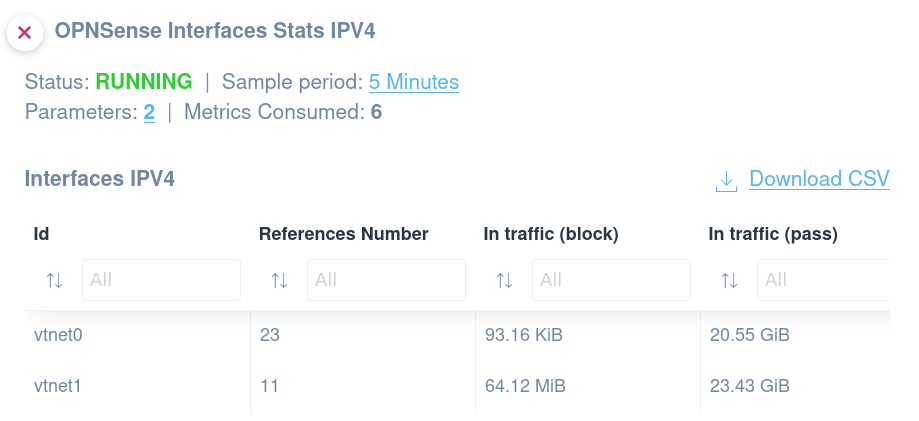
OPNsense Interface Stats IPv4 Overview
1. The system status is indicated as "RUNNING."
2. The sample period for data collection is set to 5 minutes.
3. There are 2 parameters and 6 metrics consumed.
4. A table lists the IPv4 interfaces with details:
- "Id" column shows interface identifiers, such as vtnet0 and vtnet1.
- "References Number" indicates the number of references, with values like 23 and 11.
- "In traffic (block)" and "In traffic (pass)" columns display data traffic information, measured in KiB and GiB respectively.
5. An option to download the data as a CSV file is available via the "Download CSV" link.
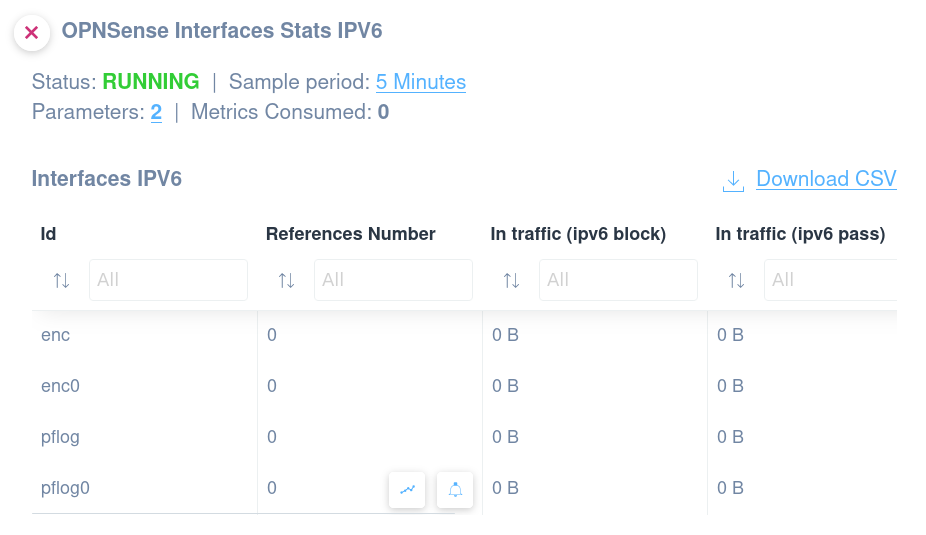
OPNSense Interfaces Stats IPV6 Dashboard
1. Status of the OPNSense is indicated as "RUNNING".
2. Sample period is set to 5 minutes. You can click "5 Minutes" to adjust this period.
3. There are 2 parameters, with 0 metrics consumed.
4. The "Interfaces IPV6" section lists network interface IDs, such as "enc", "enc0", "pflog", and "pflog0".
5. Columns provide details:
- "References Number" shows counts for each interface.
- "In traffic (ipv6 block)" and "In traffic (ipv6 pass)" display the traffic in bytes, all shown here as "0 B".
6. To export the data, click "Download CSV".
Gateway Stats
This script can be used to monitor gateway statistics on an OPNsense host.
- Gateway Name
- IP Address
- Status
- RTTsd (Round Trip Time Standard Deviation)
- Packet Loss
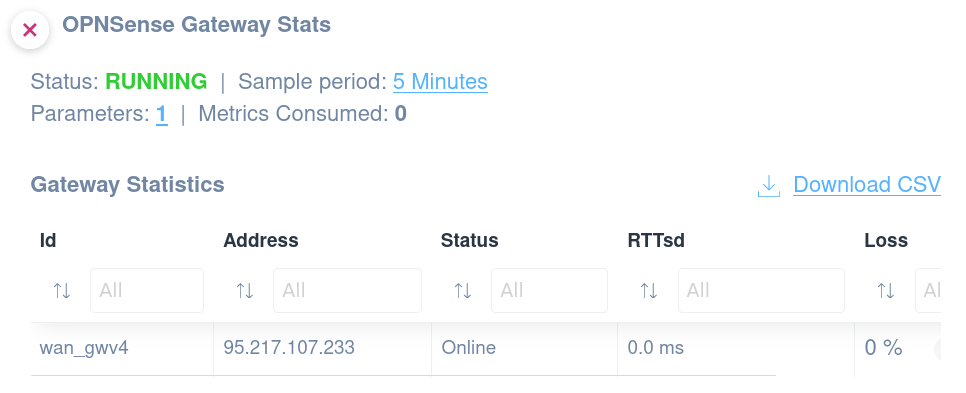
OPNsense Gateway Statistics Dashboard
1. The dashboard displays the status as "RUNNING."
2. The sample period is set to "5 Minutes."
3. There is 1 parameter and 0 metrics consumed.
4. Gateway Statistics section lists details in columns: "Id," "Address," "Status," "RTTsd," and "Loss."
5. An example entry shows Id as "wan_gwv4," Address as "95.217.107.233," Status as "Online," RTTsd as "0.0 ms," and Loss as "0%."
6. Option to download the data as a CSV file is available.
New SNMP templates
This month we released the following SNMP templates:
- Printer Serial Number
- Fortinet Fortigate VPN Tunnels (not-SSL)
- Ruckus Switch
- Ruckus WiFi Access Point
- Juniper
Printer Serial Number
Apply this SNMP template to get the Printers Serial Number:
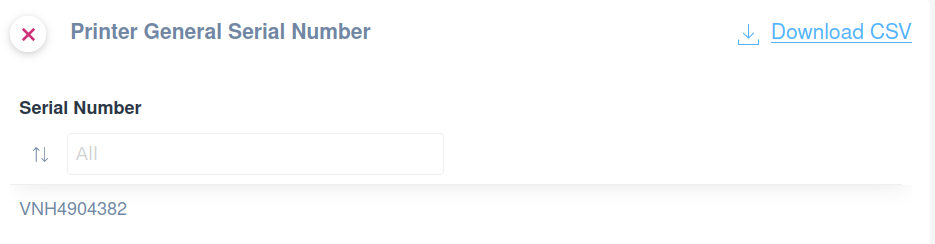
Printer General Serial Number Display
1. The window title is "Printer General Serial Number."
2. Below the title, there is a "Serial Number" label.
3. There is a search box for filtering serial numbers, defaulted to "All."
4. A serial number, "VNH4904382," is listed below the search box.
5. A "Download CSV" link is available on the upper right to save the data.
Once applied and done, you can remove the SNMP template from the device you have applied it to since the serial number will be shown in the Domotz Info tab and, therefore, will be available to be synced with every documentation system we support.
Fortinet Fortigate VPN Tunnels (Not SSL)
Apply this SNMP template to monitor the following properties on each VPN Tunnel:
- Name
- Status
- IP Local Gateway
- IP Remote Gateway
- In Traffic
- OutTraffic
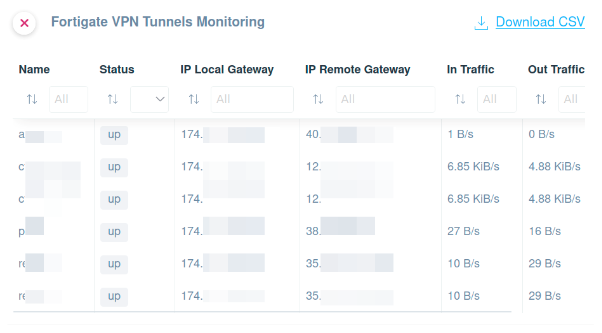
Fortigate VPN Tunnels Monitoring interface.
1. The table displays columns for Name, Status, IP Local Gateway, IP Remote Gateway, In Traffic, and Out Traffic.
2. Each row represents a different VPN tunnel, listing its name and current operational status.
3. The Status column shows if tunnels are "up," indicating they are active.
4. The IP Local Gateway and IP Remote Gateway columns provide the respective IP addresses.
5. In Traffic and Out Traffic columns show data transfer rates, measured in KB/s or B/s.
6. At the top right, there is an option to download the data as a CSV file for offline analysis.
Ruckus Switch
Serial Number
Apply this SNMP template to get the serial number of your Ruckus switches.
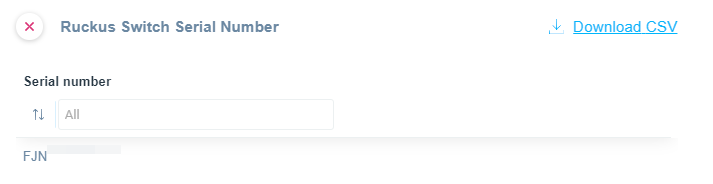
Ruckus Switch Serial Number Search and Download
1. To search for a Ruckus Switch serial number, enter the serial number in the "Serial number" search box. The search box allows filtering options, with "All" as the default setting.
2. The section shows a list of results matching the search criteria.
3. To download the list of serial numbers, click on the "Download CSV" link on the right side of the page.
Once applied and done, you can remove the SNMP template from the device you have applied it to since the serial number will be shown in the Domotz Info tab and, therefore, will be available to be synced with every documentation system we support.
CPU and Memory Usage
Apply this SNMP template to extract and monitor the following:
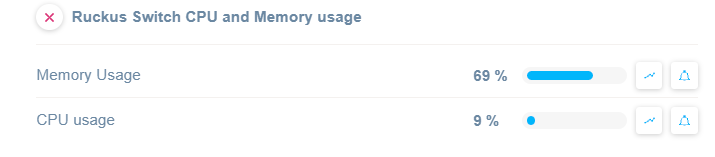
Ruckus Switch CPU and Memory Usage Overview
1. The "Memory Usage" section shows a usage percentage of 69% with a visual progress bar indicating current consumption.
2. The "CPU Usage" section displays a usage percentage of 9%, also accompanied by a visual progress bar.
3. Each section includes icons for viewing trends and setting alerts for further monitoring.
Power Supply Units
Apply this SNMP template to extract and monitor the following:
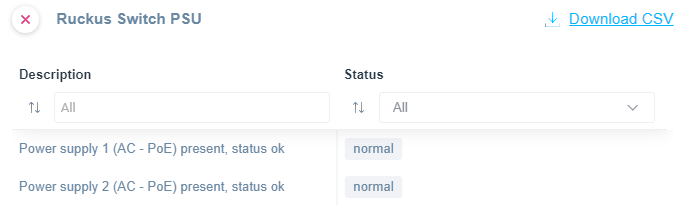
Ruckus Switch PSU Status Overview
1. The page displays the status of Ruckus Switch power supply units (PSUs).
2. In the Description column, two power supplies are listed: "Power supply 1 (AC - PoE) present, status ok" and "Power supply 2 (AC - PoE) present, status ok".
3. In the Status column, both power supplies are marked as "normal".
4. The interface includes options to sort and filter by Description and Status.
5. A "Download CSV" link is available for exporting the data.
Fans
Apply this SNMP template to extract and monitor the following:
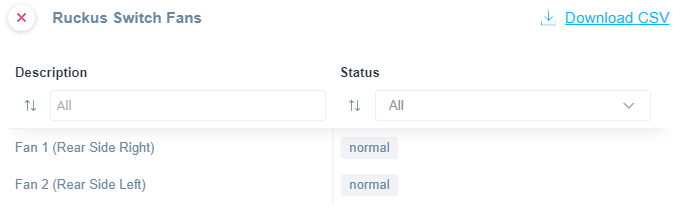
Ruckus Switch Fans Status Overview
1. The title at the top reads "Ruckus Switch Fans" with an option to download the data as a CSV file on the right.
2. The interface displays two main columns: "Description" and "Status."
3. Each column has a filter option with a default value of "All" that can be adjusted to refine the display.
4. Under "Description," two entries are listed: "Fan 1 (Rear Side Right)" and "Fan 2 (Rear Side Left)."
5. The "Status" column shows both fans labeled as "normal," indicating they are functioning correctly.
Ruckus WiFi Access Point
Apply this SNMP template to extract and monitor the following:
- Serial Number
- CPU Usage
- Memory Usage
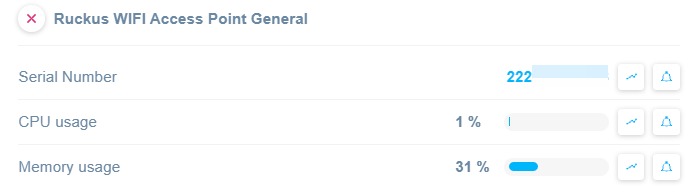
Ruckus WIFI Access Point Status Overview
1. At the top, there is a section labeled "Ruckus WIFI Access Point General."
2. Below, the Serial Number field shows the value as 222.
3. The CPU usage indicator displays a value of 1%.
4. Memory usage is indicated at 31%, with a visual progress bar.
5. Each metric has an adjacent line graph icon and a bell icon, which may be used for viewing trends or setting alerts.
Juniper
Components Monitoring
Apply this SNMP template to extract and monitor Juniper hardware components.
Once applied, you will be able to monitor the following:
- Component
- CPU Usage
- Temperature
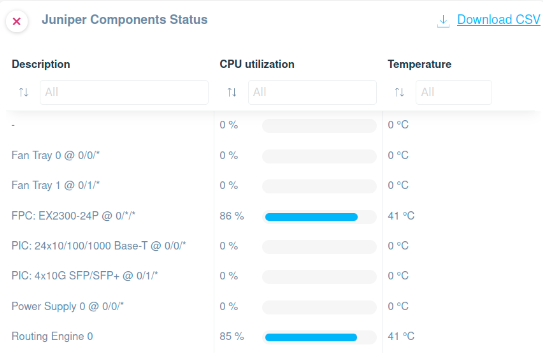
Juniper Components Status Overview
1. The table displays the status of various Juniper hardware components, with columns for Description, CPU Utilization, and Temperature.
2. The Description column lists components such as Fan Tray, FPC (Flexible PIC Concentrator), PIC (Physical Interface Card), Power Supply, and Routing Engine.
3. CPU Utilization is shown as a percentage, with notable values like 86% for FPC EX2300-24P and 85% for Routing Engine 0, indicating these components are under significant load.
4. Temperature is indicated in degrees Celsius, with FPC and Routing Engine both at 41°C.
5. A "Download CSV" option is available for exporting this data. Use this to save the component status information for analysis or record-keeping.
Alarms
Apply this SNMP template to extract and monitor the Juniper Alarm States. Once applied, you will be able to monitor the following:
- Relay Mode
- Yellow Alarm State
- Red Alarm State
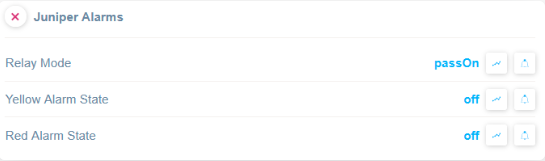
Juniper Alarms Settings
1. The "Relay Mode" is currently set to "passOn," indicating the system is actively forwarding alarms.
2. The "Yellow Alarm State" is set to "off," meaning yellow alarms are currently inactive.
3. The "Red Alarm State" is also set to "off," indicating red alarms are inactive as well.
4. Each alarm state has buttons for further configuration or status increases, typically used for detailed management or analysis.
Led Table
Apply this SNMP template to get insights on the Led Table on the Juniper appliance:
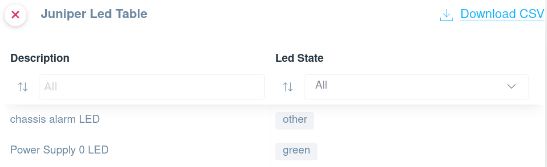
Juniper LED Table Interface
1. At the top, there's an option to download the table as a CSV file.
2. Two columns are displayed: "Description" and "Led State."
3. The "Description" column includes entries like "chassis alarm LED" and "Power Supply 0 LED."
4. The "Led State" column shows the status, such as "other" and "green."
5. Dropdown menus next to each column allow filtering by specific criteria in the "Description" or "Led State" fields.
Improvements
Enhanced Functionality in Script Integration Framework
We have expanded the capabilities of our Script Integration framework. You can now utilize the Serial Number and the device’s MAC Address within the Custom Script sandbox. This enhancement opens up new possibilities for interfacing with third-party platforms, devices, or APIs using these critical pieces of device information.
Additionally, Field Operators are now empowered with visibility into which Integration Scripts are associated with each device they manage. This transparency ensures more efficient and informed operations, enabling Field Operators to leverage the full potential of Script Integrations.
Serial Number Integration in Monitoring Dashboards
We also enhance our network monitoring dashboards by allowing the reporting of device Serial Numbers within the tables. This improvement allows you to track and manage devices more effectively by utilizing the Serial Number as a key piece of device information in the dashboard tables.
For detailed insights on how to utilize this new feature, please refer to the Monitoring Dashboards guide.
Enhanced IP Conflict Detection with Retry Mechanism
We’ve upgraded the IP Conflict detection feature in the Network Troubleshooting section to include a retry mechanism. This development significantly reduces false negatives by performing multiple checks before resolving an IP Conflict notification. Previously, the system would send an immediate resolution notification upon detecting an IP Conflict, and the notification was based on a single check, which occasionally missed ongoing conflicts.
The new retry mechanism ensures more accurate and reliable detection of IP Conflicts, enhancing network stability and user trust in the system’s notifications.
Additional MIBs available in the Domotz Database
Additional MIB files are available for the following devices.
- COMAP
- EPYGI
- RUCKUS-L2TP
- Brocade
- Barco
- Netgear GC752xp
- GrandStream GWN
Going on, you can search for their OIDs from Domotz.
Fixes
We’ve fixed the following issues:
- Remote connections were broken for some versions of Domotz Agents, including old Domotz Boxes (B-01 and B-11).
- Remote connection traffic limit exceeds produced an error despite using a booster pack.
- Fixed the link to the Help center from the Network Troubleshooting area.
- Unable to configure advanced SNMP v3 settings as default credentials.
- Monitoring Dashboard – sorting tables by Zone and Location was not working.
- Fixed errors in the console when loading Monitoring Dashboards.
- Resolved the issue causing Domotz Agents based on Windows to be marked sporadically offline.
- Fixed an issue preventing the automatic generation of monthly reports at the beginning of the month.
- The execution of Custom Script Actions via Public API was not correctly tracked in the Agent’s history.
- Mikrotik PoE Switch, “Unlock action”, did not store device credentials properly, requiring a subsequent unlock action.
- We have improved the loading time for the Asset Synchronization integration, which was causing issues in some cases.
- SynchoMSP deleted the organization, resulting in errors when loading the integration for the Asset Synchronization.
- New device discovery alerts were also sent when new Physical or Virtual Interfaces were added to the device hosting the Domotz Agent (recognized as different MAC addresses from the system).
- The “Configuration Management” view for identifying differences between several backups did not work on the Mobile App.
Known limitations
- No data from the GlassWire For Business (GW4B) application is available centrally on the Domotz Platform. However, in the next few months, we will add more stats about the remote endpoint into the Domotz App/WebApp.
- You cannot remove the alerts for IP Conflict without removing the default custom filter for all the Agents.
- There is no central repository for all the SNMP pre-configured, OS Monitoring, and Custom Integration script sensor alerts.
- Downgrading the GlassWire For Business endpoint amount purchased is impossible without contacting Domotz Support.
- Monitoring Dashboards are currently limited to Monitoring Tables as Widgets.
- Luxul Router-based Agents do not support VPN on demand. To elaborate, we’ll add this capability as soon as Luxul’s team provides us with the required API.
- You can’t configure the static IP address on the Domotz Box before configuring the Agent.
- Lastly, you can’t leverage DHCP on additional VLANs on the Domotz Box.
To conclude, these release notes cover the changes, including Domotz Pro Cloud, Domotz Agent, and Domotz Pro App.
Learn more about our software on our website or read our blog to stay updated with modern network and IT Infrastructure monitoring and management.