
Purpose of Account Setup Article
This onboarding article on setting up your account on Domotz will help you establish a process to optimize your work flow.
We cover the following topics in our Account Setup guide:
- Branding
- Team Management
- SSO
- Documentation systems
- Monitoring Dashboards
Furthermore, please note that this article assumes that you’ve done your Domotz trail and now want to start using the software as part of your stack.
Branding
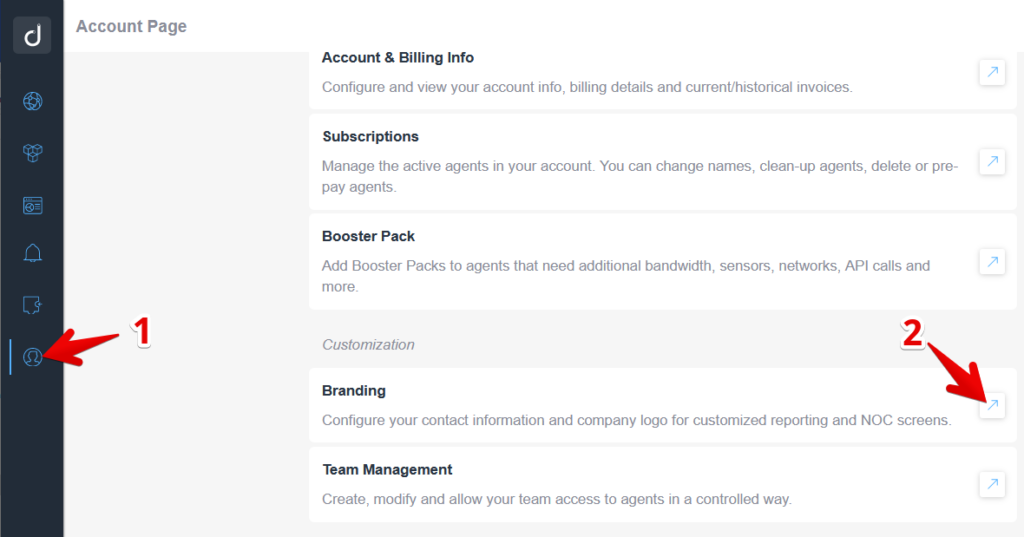
Next in the account set-up guide we cover branding. When it comes to branding the following tab allows you to configure your contact info and upload a company logo for display in the reports we generate:
Navigating to Branding on the Account Page
1. On the left sidebar, click the profile icon to access the Account Page.
2. Under the Customization section, select "Branding" to configure your contact information and company logo for customized reporting and NOC screens.
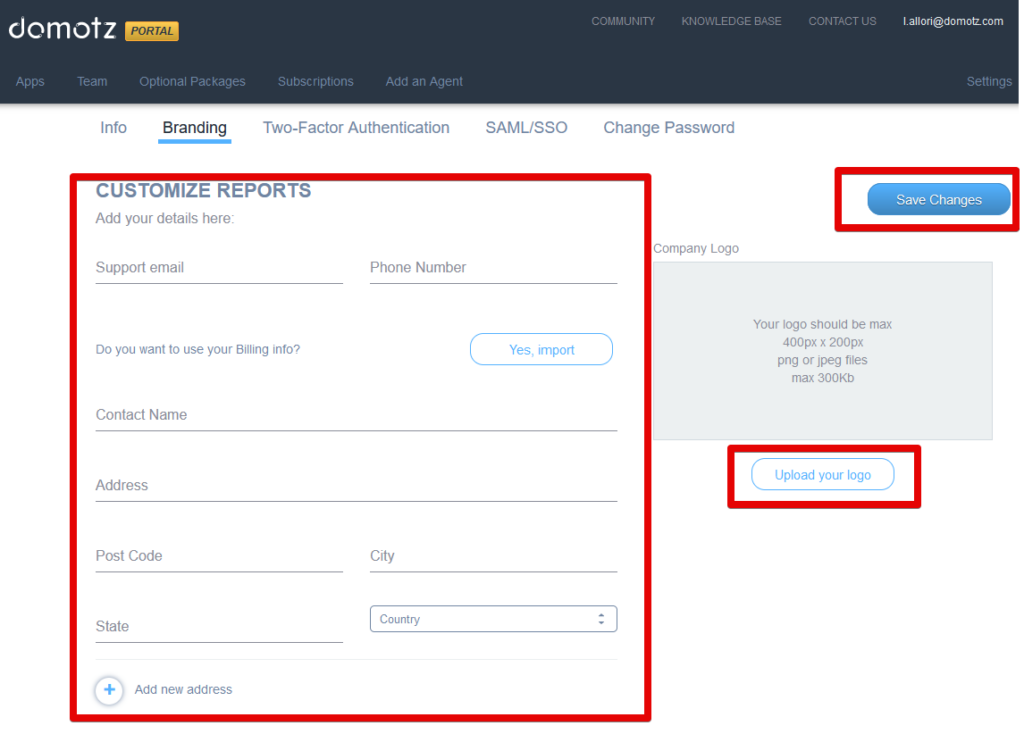
Or you can configure these directly from the Portal (https://portal.domotz.com), under the Account -> Branding tab:
Customizing Reports in Domotz Portal
1. Navigate to the "Branding" section in the Domotz Portal.
2. Fill in the required fields: Support email, Phone Number, Contact Name, Address, Post Code, City, State, and Country. Use the option to import billing info if needed.
3. To add a new address, select "Add new address."
4. For the company logo, ensure the file is a PNG or JPEG, and does not exceed 400x200px or 300Kb. Upload via the "Upload your logo" button.
5. Save all changes by selecting the "Save Changes" button.
Don’t forget to save your changes.
Team Management
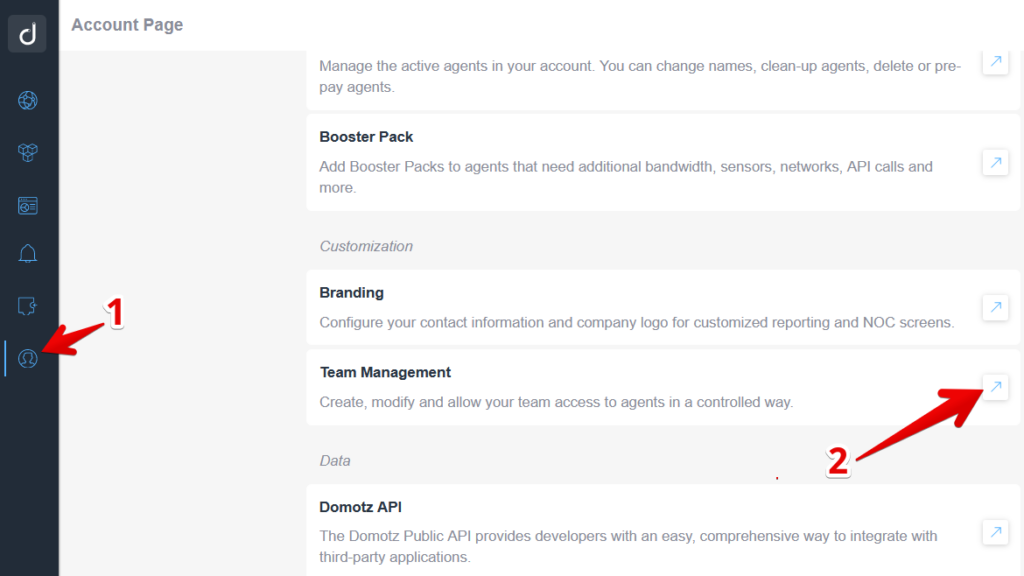
You can create/manage accounts for your team and your clients here:
Accessing Team Management Settings
1. In the sidebar menu on the left, select the icon depicting a user to navigate to the Account Page.
2. On the Account Page, locate the "Team Management" section. Click on the adjacent icon to open and manage team access settings.
Find more information about user roles in Domotz here: https://help.domotz.com/user-guide/team-management/
How to setup SSO/SAML
Domotz supports SAML/SSO authentication with the following systems:
- Microsoft Azure Active Directory
- Evo
- Okta
- Jumpcloud
For more information on how to configure SAML/SSO please see:
https://help.domotz.com/user-guide/saml-sso-authentication/
Manage Organizations and Agents
If you are an MSP, and one of your client has more than one site/network which you’ll monitor, you can group your agents by using the Organization tab in the Inventory Dashboard:
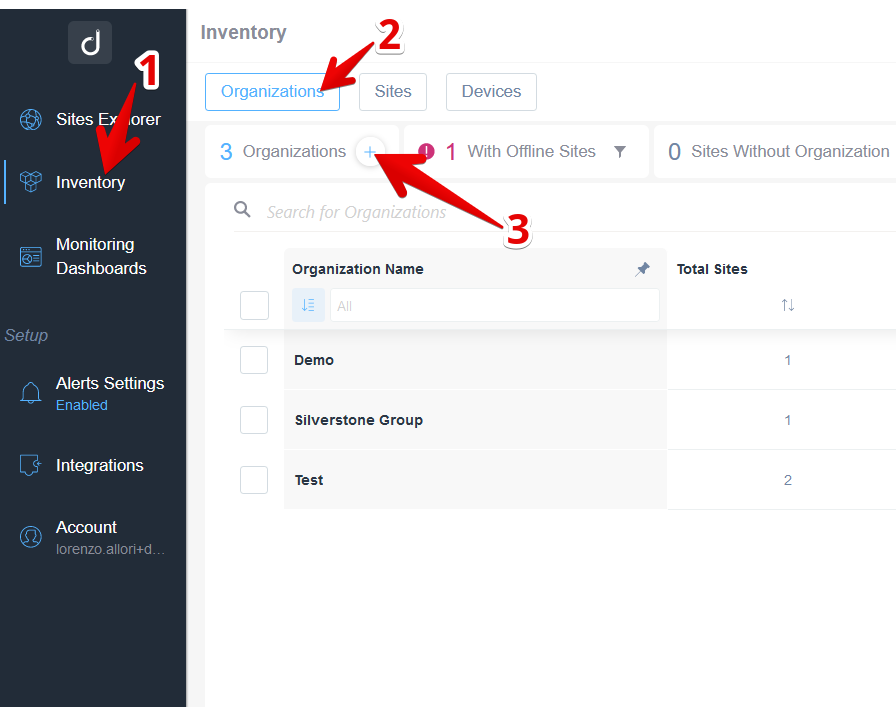
Accessing and Managing Organizations in the Inventory
1. In the left-hand menu, click on "Inventory" under "Sites Explorer."
2. At the top of the Inventory page, ensure that the "Organizations" tab is selected.
3. To add a new organization, click on the plus icon (+) next to the "Organizations" label at the top. This allows you to include a new entry to the list.
The table below the search bar displays existing organizations with columns for "Organization Name" and "Total Sites," listing details such as "Demo," "Silverstone Group," and "Test," along with their corresponding site counts.
Once the + button will be clicked you will be able to create a new Organization:
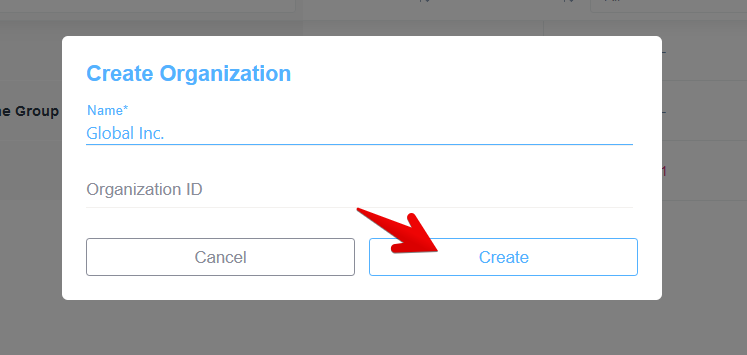
Dialog box for creating an organization.
1. Enter the organization's name in the "Name" field. In this example, it is "Global Inc."
2. No action is needed for the "Organization ID" field unless required by your system.
3. To proceed, click the "Create" button.
4. To cancel the process, click the "Cancel" button.
And then you can associate the chosen sites/networks (Domotz Agents) to that Organization:
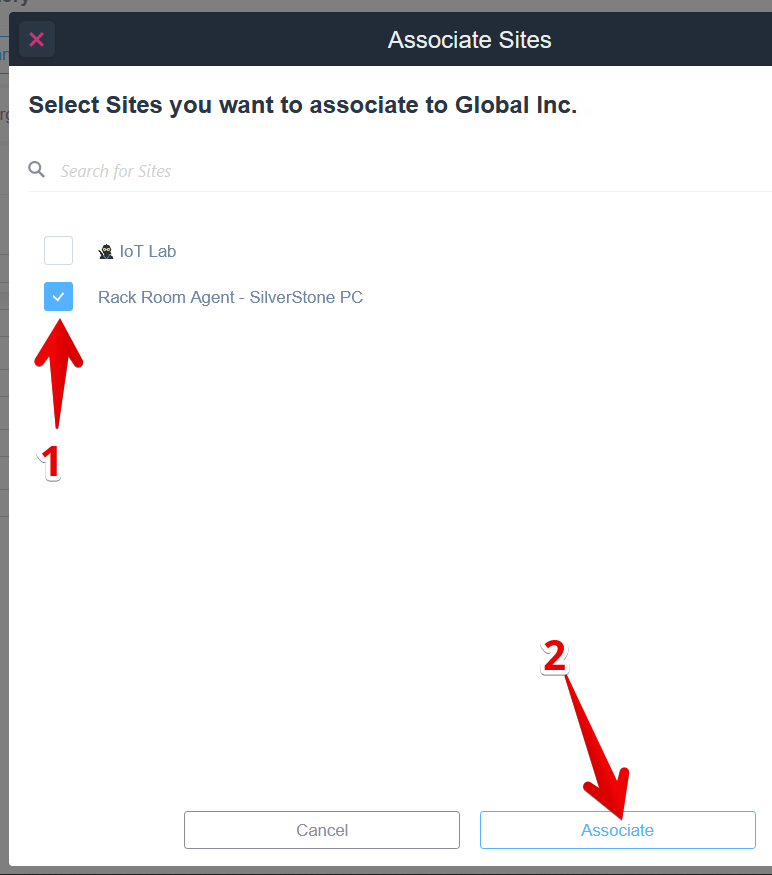
Associate a Site to Global Inc.
1. In the "Associate Sites" window, select the site you want to associate by checking the box next to "Rack Room Agent - SilverStone PC."
2. Click the "Associate" button at the bottom right to complete the association process.
Once you associate these, you will be able to filter for the sites which belong to a specific organization by accessing the Inventory Dashboard Sites tab and apply a filter in the Organization column:
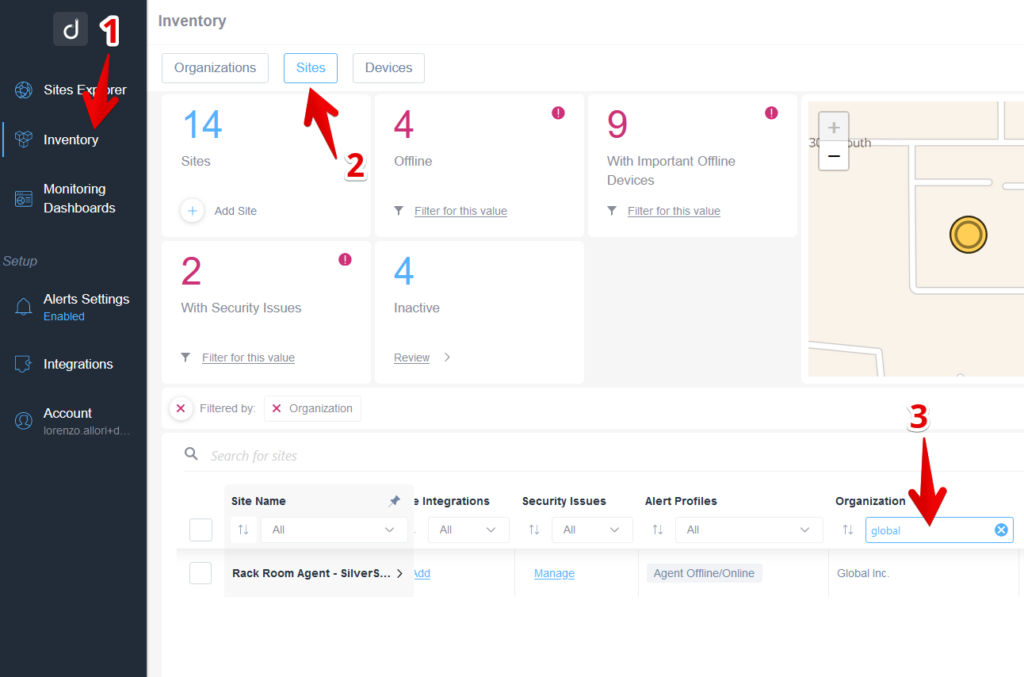
Navigating the Inventory Tab to Filter Sites by Organization
1. In the left sidebar menu, select "Inventory" to access the Inventory tab.
2. In the Inventory tab, click on the "Sites" button at the top to view the list of sites.
3. In the table below, locate the "Organization" column. Use the search box within this column to enter the desired organization name, such as "global," to filter the list of sites by that organization.
You can also select directly the Sites/Networks (Domotz Agents) belonging to an Organization, by clicking directly on the Review button (mouse over the Total Sites column):
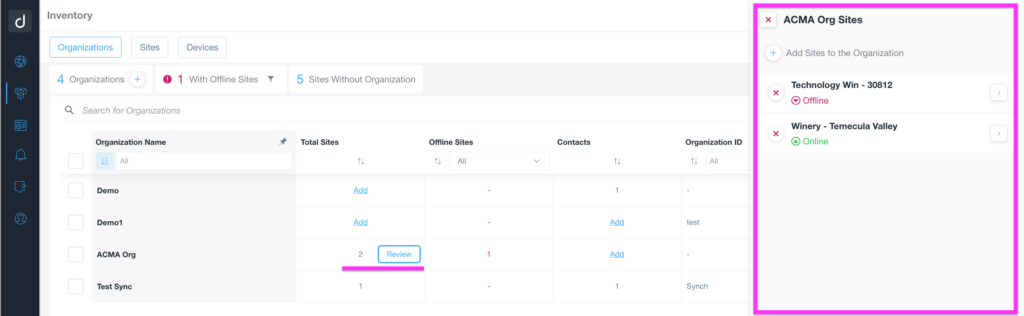
Viewing and Managing Offline Sites in an Organization
1. Access the Inventory section and select the Organizations tab at the top of the interface.
2. Identify organizations by reviewing the list under the "Organization Name" column. Look for "ACMA Org" and note the "Total Sites" column, which indicates 2 sites.
3. Click the "Review" button in the "Offline Sites" column for "ACMA Org" to manage its sites.
4. A panel on the right titled "ACMA Org Sites" will display site details:
- "Technology Win - 30812" is marked as Offline in red.
- "Winery - Temecula Valley" is marked as Online in green.
5. Use the "Add Sites to the Organization" option to include more sites. Select individual sites for further actions by clicking the arrow next to each site's name.
A right tab will appear with the list of Sites belonging to that Organization, the status and a quick link to the details for that specific Site/Network.
Ticketing Systems and Shared Alerts
In Domotz there are two types of alerting systems:
1) Shared Alerts (will notify the entire team, or route the alerts to a ticketing or external system in general)
2) Personal alerts (will notify only the user within a specific Team/Account)
In others words the second type (Personal Alerts), will only trigger notifications to be sent to you. Shared alerts instead will notify your entire team. So, if you are an MSP and have team members, you would probably choose the first type of alerting system.
Additionally, if you are using a ticketing system you might want the system to receive alerts about network and device events. You should choose shared alerts, if you want to send notifications to a ticketing system.
To send alerts to your ticketing system, you’ll need to connect it with your Domotz account.
Creating a Contact Channel
By accessing the “Alerting” section in the Domotz App, you can see all the Ticketing Systems we support. Choose click on ‘Connect Account’ to set-up your ticketing system with Domotz.
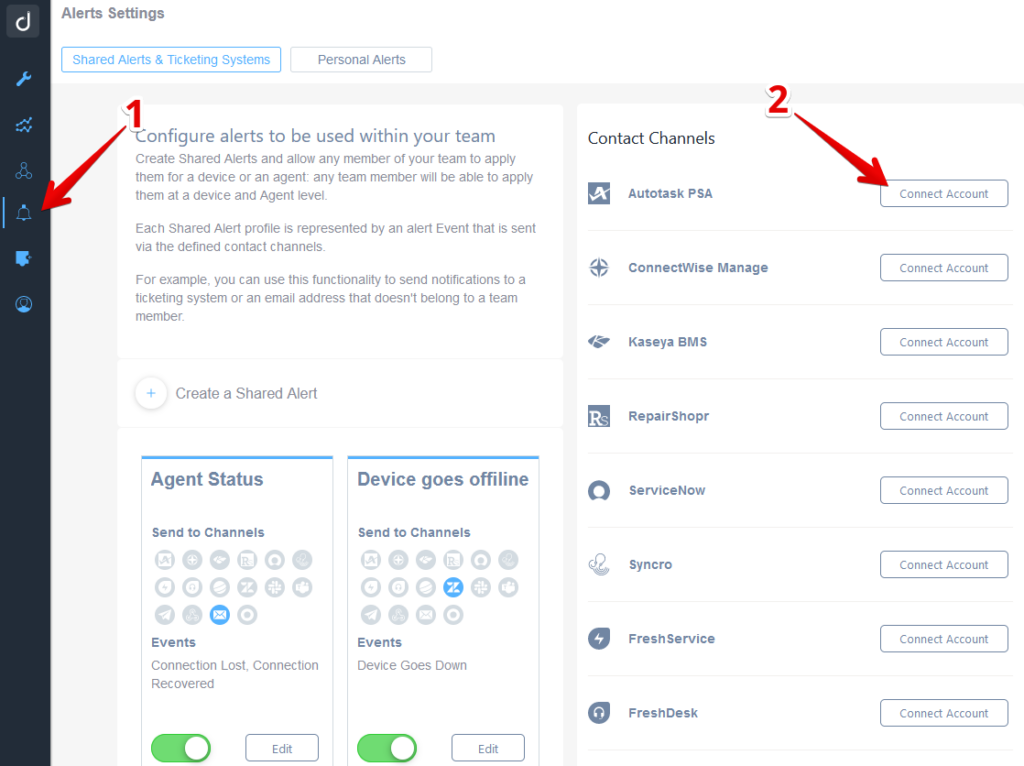
Alerts Settings Configuration Guide
1. Navigate to the Alerts Settings section, focusing on the "Shared Alerts & Ticketing Systems" tab. This area allows you to configure alerts for team use, enabling notifications for devices or agents.
2. In the Contact Channels section, you can connect different accounts to receive alerts. Select “Connect Account” next to the desired contact channel, such as Autotask PSA, ConnectWise Manage, Kaseya BMS, RepairShopr, ServiceNow, Syncro, FreshService, or FreshDesk.
Clicking this will give you access to the configuration guide for connecting your ticketing system:
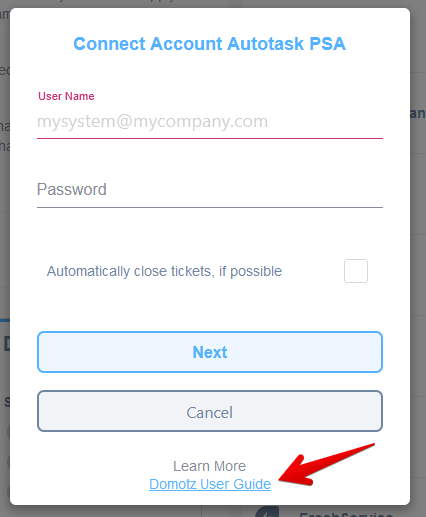
Connect Autotask PSA Account Login Form.
1. Enter your email address in the "User Name" field.
2. Input your password in the "Password" field.
3. Optionally, check the box to "Automatically close tickets, if possible" if this feature is desired.
4. Click the "Next" button to proceed with the connection.
5. Use the "Cancel" button to abort the process if needed.
6. For additional assistance, click the "Domotz User Guide" link at the bottom.
How to see the Ticketing Systems available
Domotz integrates with many different types of ticketing software.
The list of the ticketing systems we support along with the corresponding ‘Connect’ button can be seen on the right side of the previous screen.
Creating a Shared Alert Profile
Now, you can create a Shared Alert Profile that will deliver your chosen alert events to the Contact Channel(s) that you just chose.
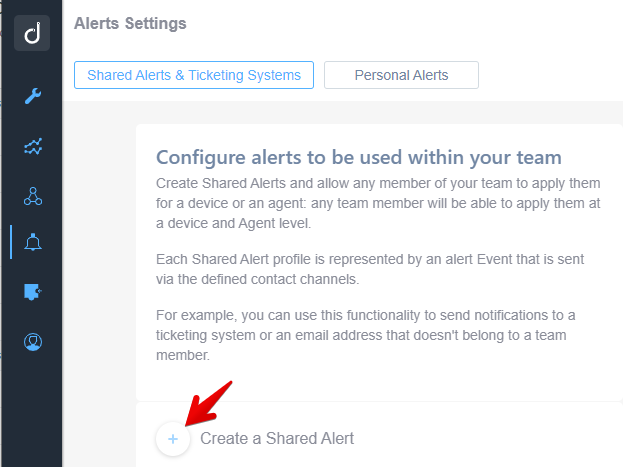
Creating a Shared Alert in Alerts Settings
1. Navigate to the "Alerts Settings" section in your software dashboard.
2. Select the "Shared Alerts & Ticketing Systems" tab.
3. Review the instructions in the "Configure alerts to be used within your team" section to understand Shared Alerts functionality.
4. Click the "Create a Shared Alert" button to initiate the creation of a new shared alert profile.
After defining the Name and the Contact channel, you can select the events to monitor:
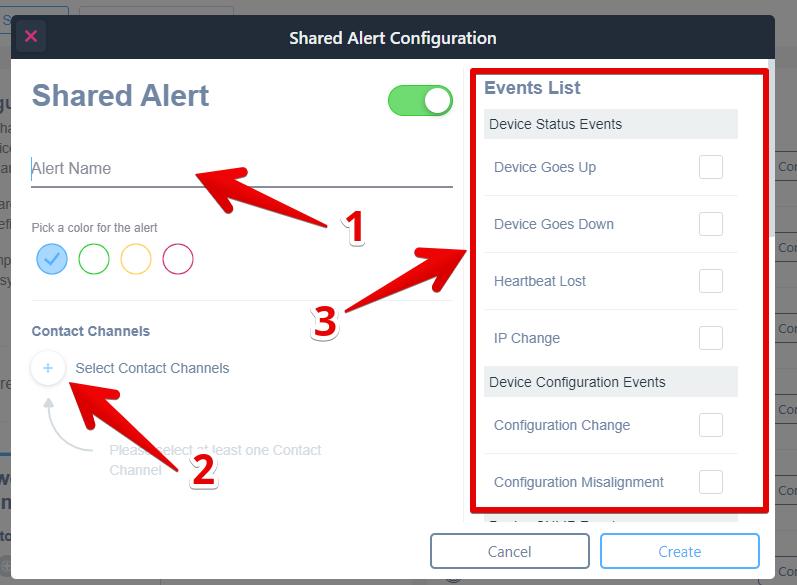
Shared Alert Configuration Setup
1. Enter the alert name in the "Alert Name" field at the top.
2. Click "Select Contact Channels" to choose the channels through which alerts will be sent. Ensure at least one contact channel is selected.
3. Under "Events List," choose the events to trigger an alert by ticking the corresponding checkboxes. Events include "Device Goes Up," "Device Goes Down," "Heartbeat Lost," and more.
4. After completing the selections, click the "Create" button to finalize the alert setup.
Please read this guide in order to understand when and how to use each event https://help.domotz.com/user-guide/shared-alerts-events-list-explained/
Supported Ticketing Systems
Following the list of the Domotz officially supported ticketing systems, along with their Domotz configuration guide:
Zendesk: https://help.domotz.com/user-guide/zendesk/.
Autotask PSA. For more details see https://help.domotz.com/user-guide/autotask-psa/.
ConnectWise Manage. For more details a see https://help.domotz.com/user-guide/connectwise-manage/.
Solutions360 / Q360. For more details see https://help.domotz.com/integrations/solutions360/.
FreshService. For more details see https://help.domotz.com/knowledge-base/freshservice/.
FreshDesk. For more details see https://help.domotz.com/user-guide/freshdesk/.
RepairShopr. For more details see https://help.domotz.com/user-guide/repairshopr/.
ServiceNow
Kaseya BMS. For more details see https://help.domotz.com/user-guide/kaseya/.
Syncro PSA. For more details see https://help.domotz.com/integrations/syncro-psa/re.
Halo PSA. For more details see hehttps://help.domotz.com/user-guide/halopsa-domotz-integration/e.
SquadCast
Supported Documentation Systems
It is very useful to enrich your Documentation Systems with the data coming from Domotz such as location, zone, status of the device, device name, MAC address, IP address, etc.
Following the list of Domotz officially supported documentation systems, along with their Domotz configuration guide:
IT Glue: https://help.domotz.com/user-guide/itglue-integration/
IT Portal: https://help.domotz.com/user-guide/it-portal/
Hudu: https://help.domotz.com/user-guide/hudu-integration/
Syncro: https://help.domotz.com/user-guide/syncromspdoc-integration/
Cloudradial: https://help.domotz.com/user-guide/cloudradial/
In general, you can leverage the Domotz Public API to extract the information out of Domotz to populate the Documentation system of your choice:
Monitoring Dashboard Configurations
The Monitoring Dashboard is a flexible, multi-tenant view of all your devices as well as any sensors associated with your devices. Customizing your dashboards allows you to view the systems and sensors that you think are most important. Additionally, you can configure your dashboards in a way that makes sense in terms of how you work.
You can create multiple views by adding dashboards to the left column:
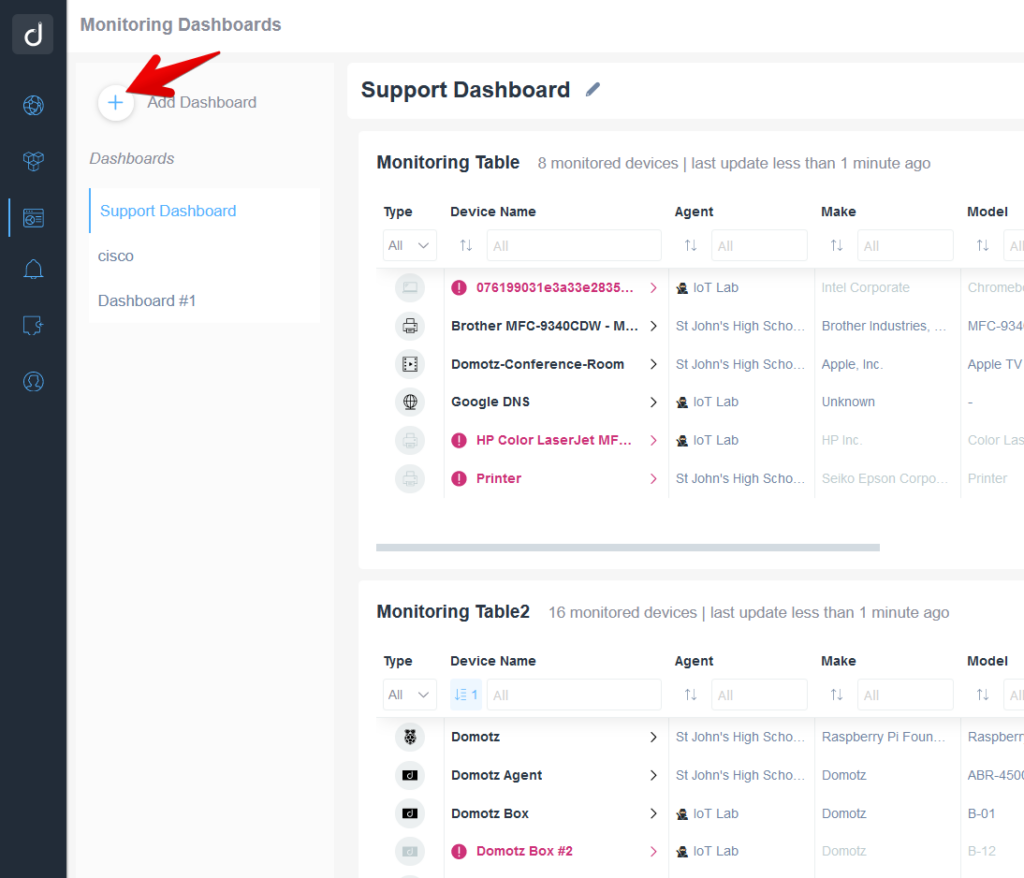
Creating a New Dashboard in the Monitoring Interface
1. On the Monitoring Dashboards page, locate the sidebar on the left.
2. Click on "Add Dashboard," indicated by a plus sign.
3. In the main section, the Support Dashboard displays various device monitoring tables.
4. Each table lists monitored devices along with details like Device Name, Agent, Make, and Model.
5. Use these tables to view and manage device statuses and information within your dashboard.
Additionally, you can add multiple tables to your dashboard by using the “Add Monitoring Table” button in the upper right. You will then have the option of adding a table specific to devices or a table of sensors.
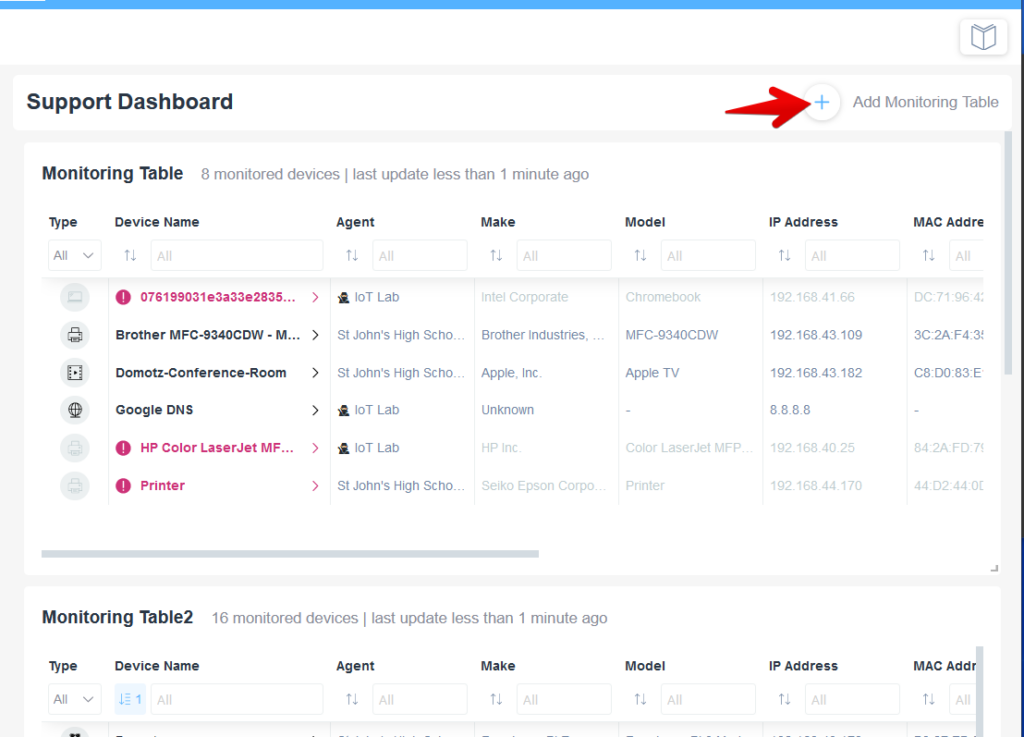
Support Dashboard Monitoring Table Overview
1. The image displays a support dashboard with multiple monitoring tables labeled "Monitoring Table" and "Monitoring Table2."
2. Each table lists monitored devices with columns for Type, Device Name, Agent, Make, Model, IP Address, and MAC Address.
3. To add a new monitoring table, click the "Add Monitoring Table" button located at the top right, indicated by a plus symbol.
4. The tables show device information such as the device name, the agent managing the device, and network details like IP and MAC addresses.
5. Use filters above each column to sort and find specific devices or information.
Within each Dashboard you can add multiple tables that can be sized based on what devices and data you’d like to have shown. The monitoring table sizes are quite flexible. On the other hand, consider that if the data goes beyond the table size, you can scroll to see the rows and columns as appropriate.
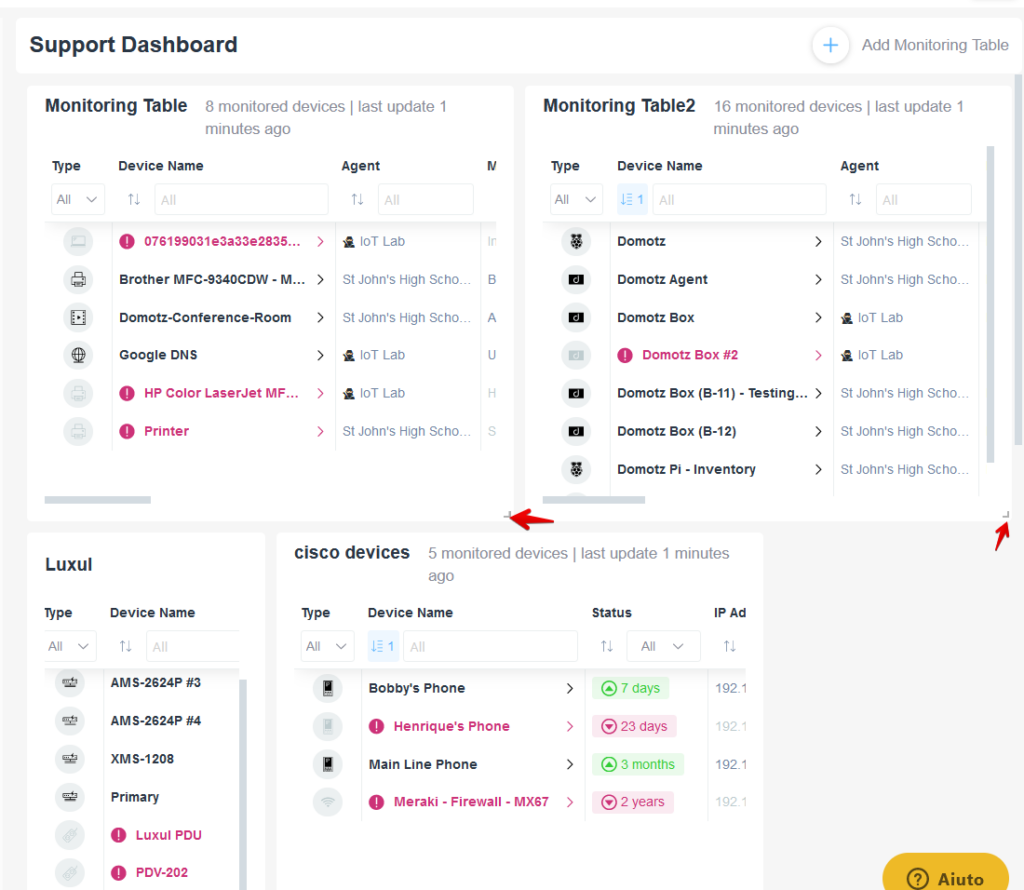
Support Dashboard Overview
1. The dashboard contains sections for monitoring devices, each with a specific name such as "Monitoring Table," "Luxul," and "cisco devices." Each section shows the number of monitored devices and the last update time.
2. Within each section, there is a table listing device details such as Type, Device Name, Agent, Status, and IP Address. You can sort these columns or filter by specific criteria such as agent or status.
3. Device names are marked with icons indicating their status, such as issue notifications or normal operation. For example, red warning icons next to device names like "HP Color LaserJet MF" indicate a possible issue.
4. Status indicators such as "7 days," "23 days," "3 months," and "2 years" show the time since the last update or identified issue. Use these to assess device health and responsiveness.
5. To add a new monitoring table, use the "Add Monitoring Table" option at the top right of the dashboard.
This setup helps streamline monitoring tasks, offering a clear view of device status and quickly identifying any issues that need attention.
A good practice is to consider what data you would like to view in the table and how this data will be sorted. You can prioritize the sorting of columns to organize your information in a way that helps your teams efficiency.
Please read this guide on how to properly set-up the Monitoring Dashboards: https://help.domotz.com/user-guide/monitoring-dashboards/
Network Architecture Considerations
When deploying Domotz on a network there are two main questions to ask:
- How many Agents should I deploy in a network?
- Where in the network should I plug in a Domotz agent?
The answers depends on how your network is set-up.
In this blog article on setting up networks with subnets and VLANs, we explain the most common network set-ups and how to approach them with Domotz.