
Another month, another round of fresh updates! This release is packed with new features, automation and scripts, and relevant enhancements to streamline your IT infrastructure monitoring and simplify your workflows.
As always, we value your feedback, so don’t hesitate to reach out to our support team at support@domotz.com with any questions or suggestions.
New features and integrations
New feature
Device-based subscription
Domotz now offers a device-based subscription. You can now monitor and manage devices for $1.50 a device, with the ability to secure additional discounts based on volume and contract length. The per-device model is designed to improve the flexibility you need to scale fast and securely at a competitive price point. Customers on the device-based pricing model choose which devices they would like to manage and pay for.
This plan is automatically available for customers who signed up after October 30th.
Existing customers will not be affected by this change. Existing customers who wish to transition to device-based pricing can reach out to sales@domotz.com
Choose the devices you want to monitor and manage today, with the chance to add more later.
Automation and Scripts
SonicWall Firewall
IPv4 DHCP Leases
Apply this script to monitor IPv4 DHCP leases on a SonicWall firewall. You will be able to monitor the following:
- Current number of DHCP leases
- Available dynamic DHCP leases
- Available static DHCP leases
- Total active DHCP leases
- Total configured DHCP leases
The script uses HTTP as a communication protocol.
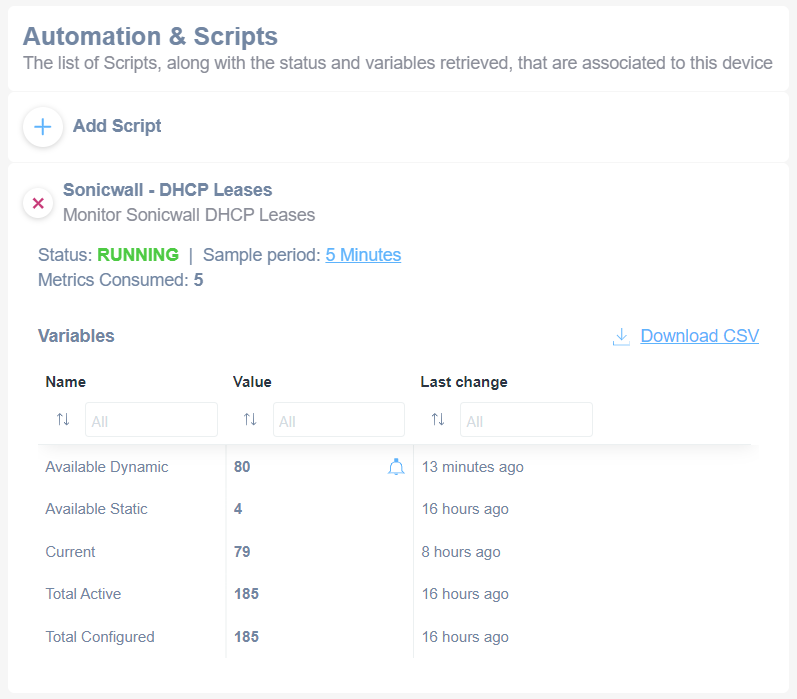
Automation and Scripts Monitoring
1. To add a new script, click on "Add Script."
2. The script "Sonicwall - DHCP Leases" is running, indicated by the "Status: RUNNING."
3. The sample period is set to 5 minutes, and 5 metrics have been consumed.
4. Under the "Variables" section, the table shows:
- "Available Dynamic" leases at 80, changed 13 minutes ago.
- "Available Static" leases at 4, changed 16 hours ago.
- "Current" leases at 79, updated 8 hours ago.
- "Total Active" leases at 185, changed 16 hours ago.
- "Total Configured" leases at 185, changed 16 hours ago.
5. For data export, click on "Download CSV."
Azure
Please note these scripts use HTTPS as a communication protocol.
Rely on Domotz scripts to ingest more data about:
Azure VM List
Use our VM list script to monitor your virtual machine list about your Azure.
You will be able to monitor the following:
- ID
- Name
- Resource Group
- Location
- Size
- Provisioning State
- Hibernation Enabled
- Image Publisher
- Image Offer
- Image SKU
- Image Version
- OS Type
- Managed Disk
- Data Disks
- Computer Name
- Network Interface ID
- Zone

Azure Virtual Machines Monitoring Dashboard
1. The dashboard displays a list of Azure virtual machines with their details.
2. Key columns include Id, Name, Resource Group, OS Type, Location, and Size.
3. Additional details shown are Image Publisher, Image, Image Version, and Image SKU.
4. Data Disks, Provisioning State, and Hibernation Enabled indicate the VM configurations.
5. Managed Disk, Computer Name, Network Interfaces, and Zone provide further network and storage information.
6. The status of the monitoring service is indicated as "RUNNING."
7. Sample period shows 5 minutes, with 6 parameters and 16 metrics consumed.
8. There is an option to download the information as a CSV file on the top right.
Azure script for Containers
Easily apply this script to be able to monitor the following:
- ID
- Image
- Memory
- CPU
- Resource Group
- Container Group
- DNS Name Label
- IP Address
- IP Address Type
- Location
- OS Type
- Provisioning State
- Restart Policy
- CPU Usage
- Memory Usage
- Network Received
- Network Transmitted

Azure Container Overview
1. The status of the Azure Container is indicated as "RUNNING." Monitoring parameters can be adjusted using a sample period of 5 minutes, with 9 parameters and 16 metrics consumed.
2. Detailed Azure Container information is displayed in a table format, including:
- **ID:** Unique identifier for the container.
- **Image:** Name of the container image used.
- **Memory:** Allocated memory of 1.5 GB.
- **CPU:** Information on CPU allocation.
- **Resource Group:** Name of the resource group, here listed as "RG-SalesEng."
- **Container Group:** Identified as "domotc1."
- **DNS Name Label:** Listed as "aci-demo-domotc."
- **IP Address:** 20.71.0.226 is shown.
- **IP Address Type:** Public.
- **Location:** "westeurope."
- **OS Type:** Indicated as "Linux."
- **Provisioning State:** Marked as "Succeeded."
- **Restart Policy:** Set to "Always."
- **CPU Usage, Memory Usage, Network Received, Network Transmitted:** Data not available or shown as "N/A."
3. A link is provided to download the data as a CSV file.
Azure Virtual Machine Scale Sets
Apply our Virtual Machine Scale Sets script on Azure to monitor the following:
- ID
- Name
- Resource Group
- Location
- SKU Name
- SKU Tier
- SKU Capacity
- Etag
- Orchestration Mode
- Upgrade Policy Mode
- Scale-in Policy Rules
- Scale-in Force Deletion
- Computer Name Prefix
- OS Type
- Image Publisher
- Image Offer
- Image SKU
- Image Version
- Network Interface Name
- Network IP Configurations
- Provisioning State
- Platform Fault Domain Count
- Time Created
- Available Memory
- Network Out Total
- Network In Total
- CPU Credits Left
- Percentage CPU
- CPU Credits Used
- VM Availability

Azure Virtual Machine Scale Sets Dashboard Overview
1. The title shows "Azure Virtual Machine Scale Sets."
2. Status is marked as "RUNNING." A sample period is set to "5 Minutes."
3. A line lists "Parameters: 4" and "Metrics Consumed: 29."
4. A table displays various columns including:
- Image Version: current entry is "latest."
- Network Interface Name: example "RG-domotzCD-vnet-nic01."
- Network IP Configurations: lists "RG-domotzCD-vnet-nic01-ip."
- Provisioning State: shown as "Succeeded."
- Platform Fault Domain Count: value is "1."
- Time Created: noted as "10/23/2024 10:35:35."
5. Additional columns show metrics such as Available Memory (“0.22 Gb”), Network Out Total/Network In Total (“0.00 Gb”), CPU Credits Left (“101.93”), Percentage CPU (“0.13 %”), CPU Credits Used (“N/A”), and Vm Availability.
6. A "Download CSV" option is available at the top-right for exporting the data.

Azure Virtual Machine Scale Sets Dashboard Overview
1. The title indicates the section for Azure Virtual Machine Scale Sets.
2. Status shows "RUNNING" with the sampling period set to "5 Minutes," suggesting active monitoring.
3. Parameters link to further details, with "1" metric and "29" metrics consumed.
4. Below, a table displays details of a virtual machine scale set:
- Id: "07bc7e7e-..."
- Name: "test-vm-scale-set"
- Resource Group: "RG-DOMDTCZO"
- Location: "westeurope"
- SKU Name and Tier: "Standard_B1ms" and "Standard"
- SKU Capacity: "2"
- Etag: "1"
- Orchestration Mode: "Flexible"
- Upgrade Mode: "Manual"
- Scale-in Policy Rules: "Default"
- Scale-in Force Deletion: "N/A"
- Computer Name Prefix: "test-vm-s"
- OS Type: "Linux"
- Image Publisher: "debian"
- Image Offer: "debian-12"
- Image SKU: "12-gen2"
5. A "Download CSV" option is available for exporting data.
Azure Virtual Machine Scale Sets Disks
This script enhances visibility, performance management, and cost efficiency for your Azure Virtual Machine Scale Sets disks.
You will be able to monitor the following:
- ID
- Name
- Resource Group
- Disk Controller Type
- OS Disk Size
- Disk Write Ops
- Disk Read
- Disk Read Ops
- Disk Write
- Data Disk Read
- Data Disk Write
- Data Disk Read
- Data Disk Write
- Data Disk Bandwidth Consumed
- Data Disk IOPS Consumed
- Data Disk Target Bandwidth
- Data Disk Target IOPS
- OS Disk Bandwidth Consumed
- OS Disk IOPS Consumed
- OS Disk Read
- OS Disk Write
- OS Disk Read
- OS Disk Write

Monitoring Azure Virtual Machine Scale Set Disk Metrics
1. The page displays metrics for Azure Virtual Machine Scale Sets related to disk usage.
2. The status is shown as "RUNNING," and the sample period is set to "5 Minutes."
3. Metrics and parameters are accessible via hyperlinks indicating their availability.
4. A table lists specific details for each virtual machine:
- The first column shows the ID, "07b..." truncated for example.
- The 'Name' column provides the scale set name, such as "test-vm-scale-set."
- 'Resource Group' is listed as "RG-DOMZCD."
- 'Disk Controller Type' is indicated as "SCSI."
- 'OS Disk Size' details the size, displayed as "30 Gb."
- Columns for 'Disk Write Ops,' 'Disk Read,' 'Disk Read Ops,' 'Data Disk Read,' 'Data Disk Write,' 'Data Disk Read Ops,' 'Data BW' display metrics, many of which are labeled as "N/A," with "Disk Write Ops" showing "0.22 ops/sec."
5. A "Download CSV" option is available for exporting data.

Azure Virtual Machine Scale Sets Disk Metrics Overview
1. The title at the top indicates this section pertains to "Azure Virtual Machine Scale Sets - Disk."
2. The status is currently "RUNNING." The sample period is set to "5 Minutes" and there are "6" parameters with "22" metrics consumed.
3. The section below displays various disk metrics for Azure Virtual Machine Scale Sets, including:
- Data IOPS
- Data Disk Target BW
- DataDisk Target IOPS
- OS Disk BW
- OS Disk Read Ops
- OS Disk Write Ops
- OS Disk Read
- OS Disk Write
4. For each metric, there are fields labeled "N/A" or specific values, indicating current measurements or lack thereof. For example, "OS Disk Write Ops" shows "0.71 ops/sec" and "OS Disk Write" shows "5055.64 bps."
Use this information to monitor and analyze the disk performance of your Azure Virtual Machine Scale Sets.
Azure Disks Information
Apply the script to extract the following information:
- ID
- Name
- Resource Group
- Managed By
- Location of the resource
- Availability zone
- SKU name
- SKU tier
- Os
- Hyper-V generation
- Supports hibernation
- Accelerated networking support
- Architecture
- Disk creation option
- Disk size
- Disk IOPS for read/write
- Disk throughput for read/write
- Encryption type
- Network access policy
- Public network access policy
- Creation time of the disk
- Provisioning state
- Disk state
- Disk tier
- Composite Disk Read
- Composite Disk Write
- Composite Disk Read Ops
- Composite Disk Write Ops
- Disk On-demand Burst Ops
Azure Disks Information Overview
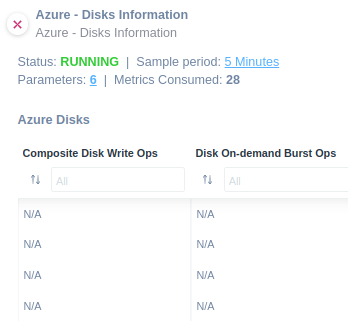
1. The status is indicated as "RUNNING," confirming the operation is active.
2. The sample period is set to "5 Minutes," showing the frequency of data collection.
3. Parameters used in the analysis are listed as "6."
4. Metrics consumed total "28."
5. Two disk metrics are displayed: "Composite Disk Write Ops" and "Disk On-demand Burst Ops," both with filtering options but no available data, marked as "N/A."

Azure Disks Information Table
1. The table displays details about Azure disks, with each row representing a disk.
2. Columns include IOPS for read/write, disk throughput, encryption type, network access policy, public network access policy, creation time, provisioning state, and disk state.
3. Additional columns specify disk tier, composite disk read/write, and composite disk read operations.
4. The status above the table shows "RUNNING" and indicates a sample period of 5 minutes with metrics consumed.
5. You can filter the data using the filter option (labeled "All") beneath each column header.

Azure Disks Information Overview
1. The status of the Azure Disks Information is "RUNNING" with a sample period of 5 minutes.
2. A table lists Azure disk details with the following columns: Id, Name, Resource Group, Managed By, Location of the resource, Availability zone, SKU name, SKU tier, OS, Hyper-V generation, Supports hibernation, Accelerated networking support, Architecture, Disk creation option, and Disk size.
3. Each row provides specific information for an individual disk. The example values include disk IDs, resource group names, management details, and configurations like the SKU and OS type.
4. An option to download the data as a CSV file is available on the top right corner.
Azure Billing Costs
Find it ready to use to extract the following properties:
- ID
- PreTaxCost
- UsageDate
- Meter
- MeterSubcategory
- ResourceGroup
- ServiceName
- ResourceLocation
- Total Cost
Azure Billing Costs Metrics Overview
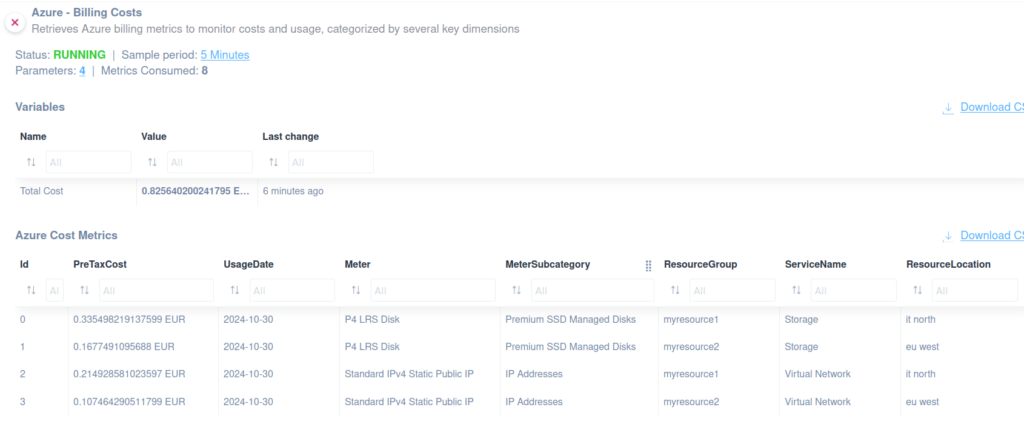
1. The title indicates the data is related to Azure billing costs for monitoring usage, categorized by key dimensions.
2. Status is shown as "RUNNING." The sample period is set to 5 minutes, with 4 parameters and 8 metrics consumed.
3. Under "Variables," the total cost is displayed as 0.825640200241795 EUR, updated 6 minutes ago.
4. In the "Azure Cost Metrics" section, four entries are listed with these details:
- Id: Identifiers 0 to 3 for each cost entry.
- PreTaxCost: Costs range from 0.107464290511799 to 0.3354982191937599 EUR.
- UsageDate: Each entry is dated 2024-10-30.
- Meter: Examples include P4 LRS Disk and Standard IPv4 Static Public IP.
- MeterSubcategory: Identify subcategories like Premium SSD Managed Disks and IP Addresses.
- ResourceGroup: Names like "myresource1" and "myresource2."
- ServiceName: Services listed include Storage and Virtual Network.
- ResourceLocation: Locations such as it north and eu west are mentioned.
5. Options to download the data are provided on the right side.
Azure script for VM List Metrics
To monitor virtual machines list metrics about your Azure, you might use this script.
Apply the script to extract the following information:
- ID
- Name
- Resource Group
- OS Name
- OS Version
- Extension Type
- Extension Status
- Extension Status msg
- Power State
- Network Out Total
- Network In Total
- Available Memory
- Percentage CPU
- CPU Credits Remaining
- CPU Credits Consumed
- Disk Read
- Disk Write
- Disk Read Ops
- Disk Write Ops
- Data Disk Read
- Data Disk Write
- Data Disk Latency
- OS Disk Read
- OS Disk Write
- OS Disk Latency
- OS Disk Read Ops
- OS Disk Write Ops
- VM Availability
- Temp Disk Latency
- Temp Disk Read
- Temp Disk Write
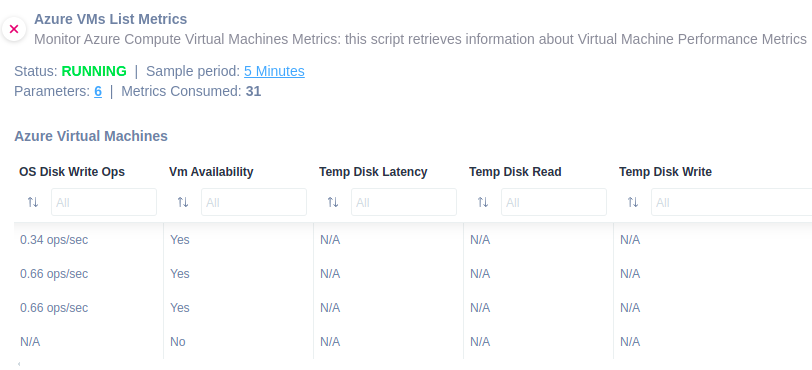
Azure VMs List Metrics Dashboard
1. Overview information includes the script name for monitoring Azure Compute Virtual Machines Metrics, indicating its function to retrieve performance metrics.
2. The status is displayed as "RUNNING," and the sample period is set to 5 minutes, showing how often data is collected.
3. It mentions 6 parameters are in use and that 31 metrics have been consumed.
4. The table below lists metrics for Azure Virtual Machines, with columns for OS Disk Write Ops, VM Availability, Temp Disk Latency, Temp Disk Read, and Temp Disk Write.
5. Specific values are provided for each metric, such as "0.34 ops/sec" for OS Disk Write Ops, and "Yes" for VM Availability, indicating current performance and availability status.
6. "N/A" entries indicate that certain data is not applicable or not available.
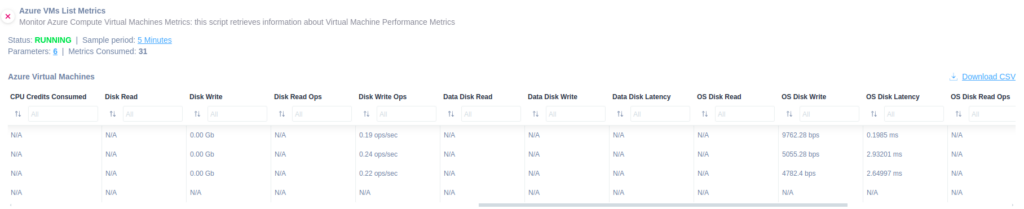
Azure Virtual Machines Metrics Overview
1. The section titled "Azure VMs List Metrics" displays an overview of virtual machine performance metrics.
2. The status of the monitoring process is shown as "RUNNING" with a sample period link labeled "5 Minutes."
3. Parameters indicate the number "9," and metrics consumed are "31."
4. Below the metrics, a table displays various performance indicators for Azure Virtual Machines, including:
- CPU Credits Consumed
- Disk Read and Disk Write (with their respective operation counts)
- Data Disk Read and Write
- Data Disk Latency
- OS Disk Read, Write, and their Latency
5. The OS Disk Write activities show specific values in tps (transactions per second) and ms (milliseconds) for latency.
6. On the right, there is an option to download the information as a CSV file.
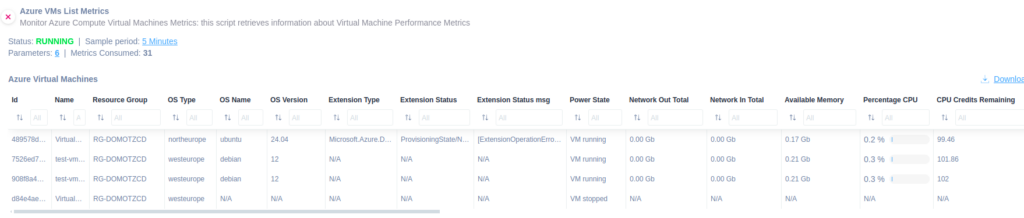
Azure VMs List Metrics Overview
1. The title "Azure VMs List Metrics" describes the purpose: monitoring Azure Compute Virtual Machines' performance metrics.
2. Current status details:
- Status is "RUNNING."
- Sample period is set to "5 Minutes."
- Parameters utilized: 9.
- Metrics consumed: 31.
3. Table of Azure Virtual Machines includes columns:
- Id: Unique identifier for each VM.
- Name: VM names are listed.
- Resource Group: All VMs belong to "RG-DOMOTZCD.”
- OS Type and OS Version: Lists operating systems such as "ubuntu" or "debian" with respective versions "24.04" or "12."
- Extension Type and Status: Shows details like "Microsoft.Azure.Diagnostics" with statuses including "ProvisioningState."
- Power State: Indicates if VMs are "running" or "stopped."
- Network metrics: "Network Out Total" and "Network In Total" are quantified in gigabytes.
- Available Memory and Percentage CPU: Displays available memory in gigabytes and CPU usage in percentage.
- CPU Credits Remaining: Shows remaining CPU credits.
4. The table rows provide specific data for each column, allowing users to assess and compare the metrics of different VMs efficiently.
5. A "Download" option is available at the top-right for exporting the data.
Enhancements
Spotlight on What Matters Most
With this release, we’ve listened to your feedback and introduced red badges which highlight the necessity of attention for a different type of reason. This change made it easier than ever to stay on top of your devices that need attention within the collector dashboard. Now, at a glance, you can quickly identify which tabs contain devices or elements requiring your attention, providing quick visibility into key statuses:
- All Important Devices Online: Indicates when all devices marked as “Important” are operational.
- Number of Important Devices Offline: Displays the count of offline “Important” devices.
- Number of Security Issues: Highlights the total number of unresolved security issues.
- Collector Alerts Disabled/Snoozed: Notifies you when alerts are intentionally disabled or snoozed.
As shown in the screenshot below, red badges highlight particular situations, ensuring that you never miss an issue that needs immediate action. Simplified visibility, streamlined workflows—because your time matters.
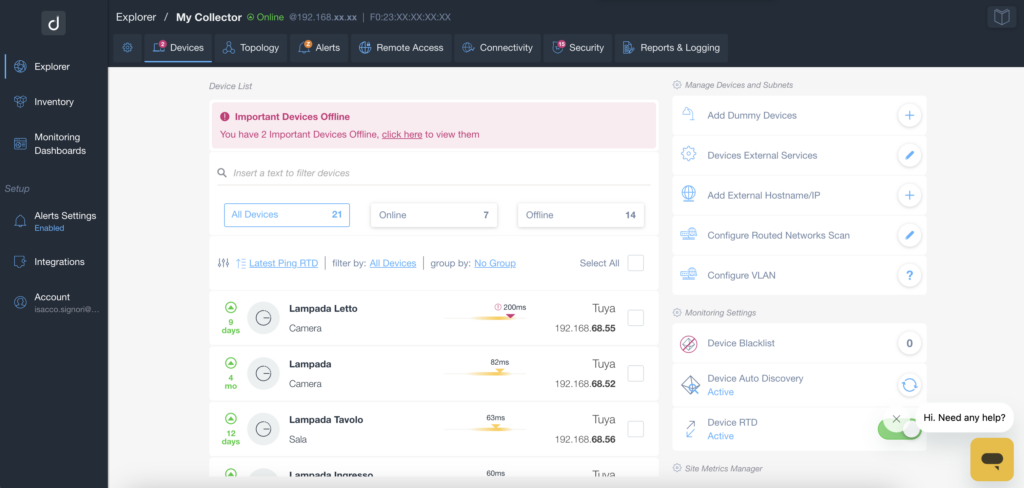
Dashboard Overview for Device Management
1. At the top, the status "Important Devices Offline" alerts users to click the provided link to view two offline devices.
2. Use the search bar to filter devices by name or status.
3. Selection filters are available to view "All Devices" or specific statuses like "Online" or "Offline," with numbers indicating current device counts.
4. The device list shows individual devices, displaying details such as name, status in green (indicating uptime duration), response time in milliseconds, brand (e.g., Tuya), and IP address.
5. On the right panel, options are available to manage devices with functions like "Add Dummy Devices" and configure subnets.
6. Under "Monitoring Settings," you can manage the "Device Blacklist," enable "Device Auto Discovery," and monitor RTD status.
7. Assistance is available through a chat feature at the bottom right for further help.
Smoother Onboarding, Smarter Interactions
We’ve taken the onboarding experience to the next level for you in the device-based monitoring mode! Now, adding Monitored devices is a breeze—changes are automatically saved, so you are no longer required to click on the save button every time.
Take advantage of this enhancement to focus on scaling your monitoring setup without interruptions or extra clicks.
Plus, we’ve made the Save button more visible when transitioning from Location-based mode to Device-based mode, ensuring a seamless setup process. These enhancements mean less hassle, fewer steps, and more time to focus on what truly matters: effortlessly managing your infrastructure.
Find the Perfect Sensor in Seconds
Now, navigating the monitoring dashboard is even easier. You can browse the full list of available sensors or quickly search for the one that fits your specific needs—saving you time and making your setup more efficient.
We’ve made searching for sensors faster and more dynamic! With Domotz, you already have access to a wide range of sensors to monitor your devices and the metrics that truly matter to your business.
Discover this improvement today and enjoy streamlined monitoring tailored to your business!

Monitoring Metrics Selection Interface
1. Choose the metrics you want to start monitoring from the top section, with options like "Network Troubleshooting," "Connectivity Status & Uptime," "Find Additional Metrics," and "Custom SNMP OID Sensors."
2. Expand monitoring capabilities using automation and scripts; options include "Another Table Driver" and "Valid Driver."
3. Browse or search for built-in metrics. Available options are listed, such as "APC UPS - Battery Replacement Date," "Cisco CPU and Memory Utilization," "Cisco Fan Monitor," and others, each identified with the label "SNMP."
Updated Custom Driver/Integration Scripts API reference guide with new UI
Our official custom driver API documentation has been updated, and you can easily go through it accessing on our portal.
You can use this guide as a documentation reference for the Domotz Custom Driver Feature to write “custom drivers”.
Rename the “Sites Explorer” menu item to “Explorer”
We have renamed the menu item from “Sites Explorer” to “Explorer”. From that section, you’ll access the Collectors in a hierarchical way.
Network Collector Updates
We recently rollout different platform updates and related improvements:
Snap Linux, Luxul, Synology, Netgear Router, QNAP, Raspberry, Docker, and Netgear
Last Version 6.3.3-b001
- Fix issue with network scan on subnets with netmask between /21 and /16 not considering Interfaces Policy and Automatic Discovery configurations
- Fix issue that in some edge cases was causing false device down alerts on Domotz Box when the main interface was disconnected for some time
- Fix issue on Configuration Management feature for Cisco C2960S devices where backups was not working correctly
- Fix issue with WinRM sessions not closing correctly when used within Integration Scripts
Windows
Last Version 6.3.4-b001
- Fix issue preventing the Network Collector to be installed on Windows 11 24H2
- Network Information (attached/virtual networks and connectivity details) are available right after the Collector is configured
Domotz Box
Last Version 6.3.5-b001
- Fix issues that sporadically caused all the network devices to be reported erroneously as Offline
- Network Information (attached/virtual networks and connectivity details) are available right after the Collector is configured
New MIBs
- GUDEADS-EPC1121-MIB
- Scenix SensorGateway-MIB
- ISILON-MIB
Fixes
- Fix performance issues when fetching the SNMP Pre-Configured Sensors list and metrics on the Monitoring Dashboard and Device Details
- Fix an issue with the Configuration Management feature on Fortigate and Netgear devices, triggering not relevant Configuration Change events
- Fix issue on the Desktop App where the Export Devices List menu option was erroneously disabled
- Fix issue on Cisco Meraki integration causing disconnection and requiring manual action
- All connections with a valid API key have been automatically recovered
- Fix issue preventing to update Billing Info on Account page
- Fix issue with false positive Configuration Change events on Fortigate and SonicWall devices
- Fix issue on Configuration Management compare view displaying date/time information in UTC format instead of properly formatted
- Fix issue on Public API endpoints for power management of PDU devices managed through SNMP
- Fix issue on Interfaces tab displaying “Reachable Devices” on ports instead of displaying the actual connected device
- Fix performance issues on Collector Devices List UI
- Fix issue on Device Detail where the Interfaces tab was not appearing as expected
- Fix issue on Collector Dashboard UI where Collector name and detail on header was not updated correctly when switching
- between multiple Collectors
- Fix issue on Public API not reporting the updated Collector location when changed from the UI
- Fix issue with Configuration Management feature not being available on Zyxel and Cisco SF devices