This article will cover how to create helpful custom reports and analytics in Power BI Desktop using the Domotz custom connector. The Power BI integration will allow you to create custom reports on speed tests, RTD information, SNMP sensor charts, network and device status, and more.
- How to install the Domotz connector for Power BI integration
- Run Domotz Power BI templates
- Domotz Power BI templates
- Customizing your Power BI templates
- What is and why use Power BI gateway?
- How to get started with the Power BI gateway
- How to configure the Power BI service to use the Power BI gateway
- How to use the data source to refresh the data
- I am not able to see the geo map in PowerBI
Microsoft Power BI enables you to access data from hundreds of sources, such as Dynamics 365, Salesforce, Azure SQL DB, Excel, SharePoint, and more.
With Power BI, you can transform and clean the data into a data model and create charts or graphs to provide visuals of the data.
You can create dashboards and reports without technical support. A powerful natural language interface and an intuitive graphical designer tool make the platform easy to use.
The Domotz custom connector allows you to gather data from the Domotz public API and create visually rich reports.
How to install the Domotz connector for Power BI integration
First, you need to enable support for custom connectors.
To do so, you need to download and put the domotz.mez file in this location (create a folder with the following path, if it does not already exist):
C:\Users\$username\OneDrive…\Documents\Microsoft Power BI Desktop\Custom Connectors
If you do not use OneDrive, put it in:
C:\Users\$username\Documents\Power BI Desktop\Custom Connectors
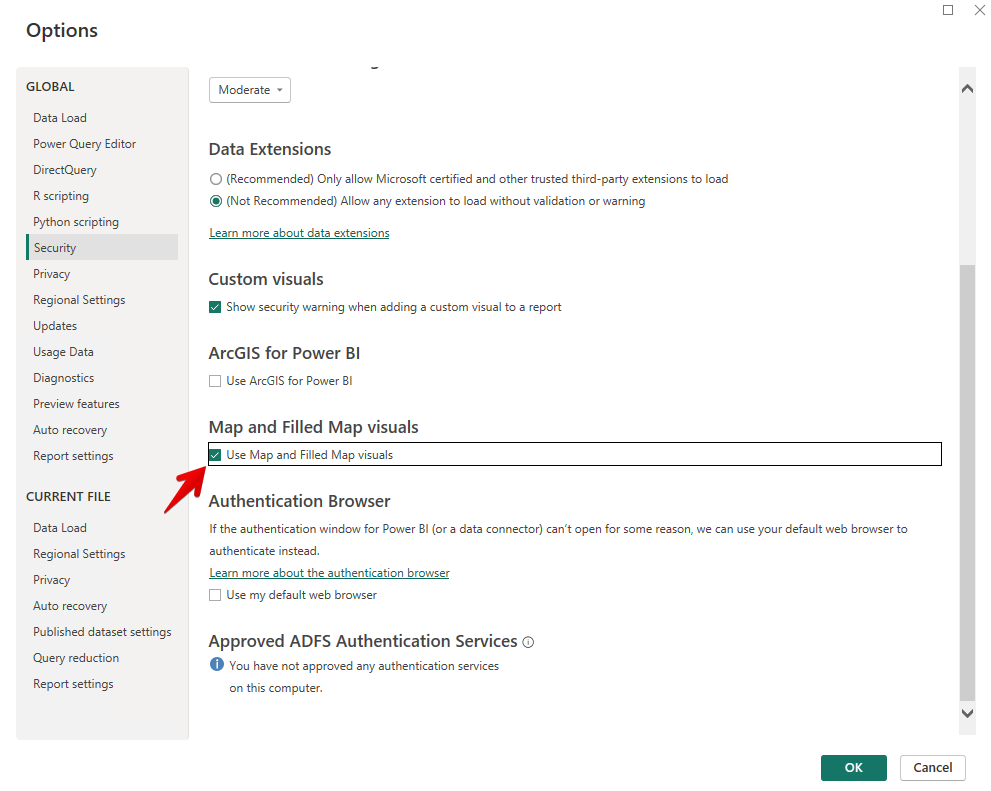
Start using Power BI Desktop, and from File → Options and Settings →Options → Security → Data Extensions, select “Allow any extension to load without validation or warning” and click OK.
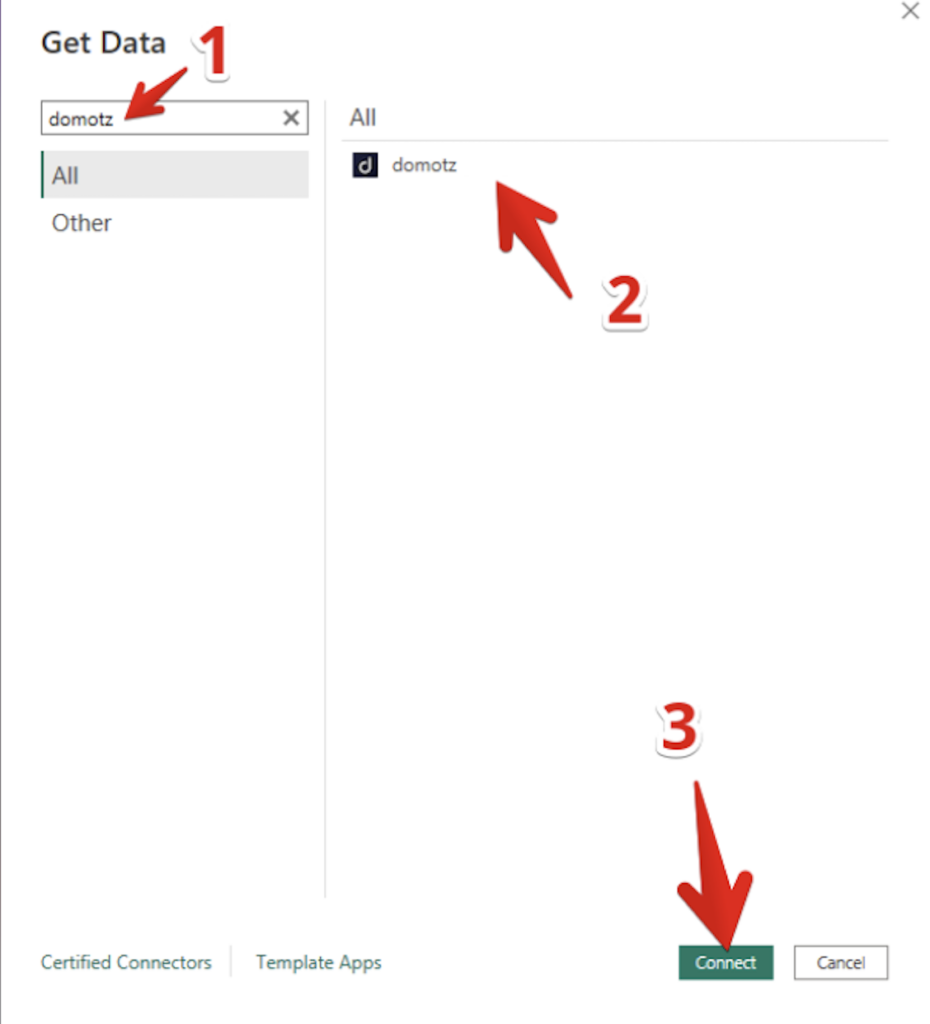
Then go to File → Get data -> Get data to get started:
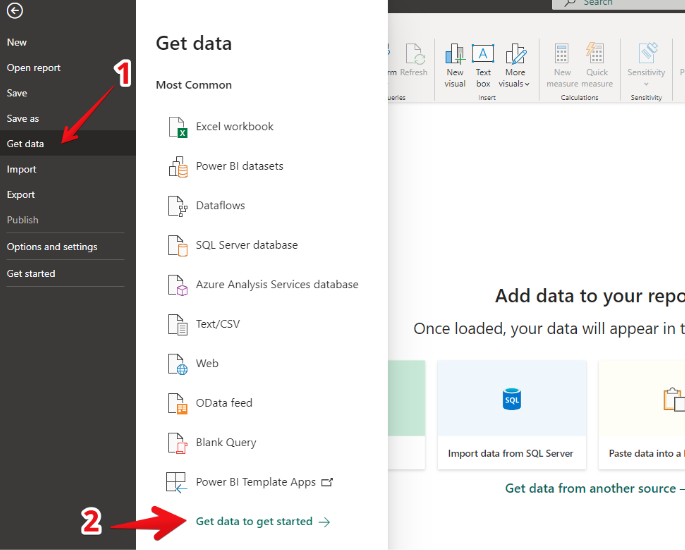
Search for the Domotz extension, select it, and click connect:
To complete the configuration, you must provide the API Endpoint and API Key (please see here https://help.domotz.com/admin-global-features/domotz-api/:
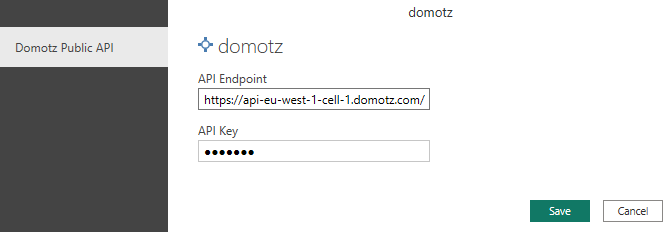
When the configuration is complete, you will have access to the Domotz Public API endpoints. Remember that some data might require transformation (expanding nested objects, data conversion) before being usable from Power BI visualization tools.
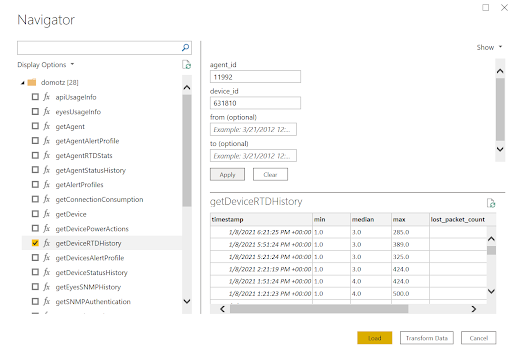
Now the connector is ready to be used.
Run Domotz Power BI templates
Please download the Domotz template here: https://github.com/domotz/power_bi_domotz/blob/main/templates/Domotz.pbit
And double click on it.
When opening the template, a popup message will ask for the time interval. This will be important to retrieve all the historical data you need:
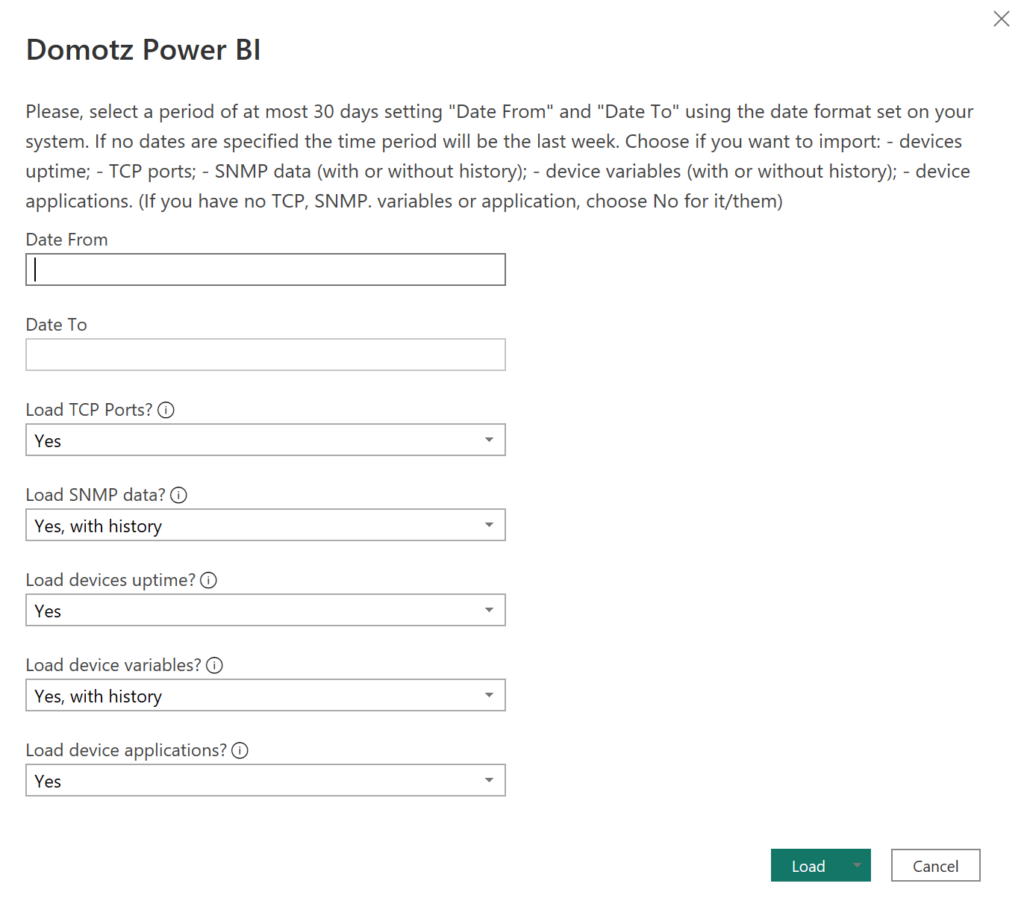
You can simply click the “Load” button leaving empty the form, and you access the historical data of the last 7 days. Otherwise, when specifying the time interval, please take care of respecting the following limits:
- Size of the time interval at most 30 days
- “Date From” not before 2 months ago
The date format to use is “MM/DD/YYYY” or “DD/MM/YYYY” depending on the settings of the system used.
The import and processing of the data should now start, and you will see the following screen:
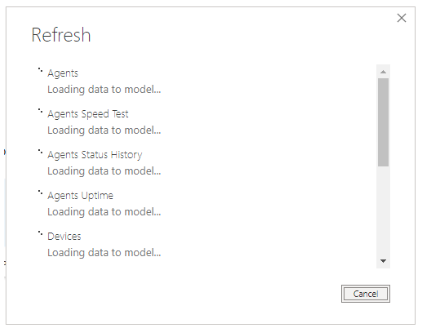
Load time (as well as API consumption) depends on the number of agents and sensors.
Domotz Power BI templates
When the data import is finished, you will be able to see Domotz Power BI Dashboards.
Each dashboard contains interactive reports and filters: you can act on the filters or click a specific item in a report to filter all the information in the dashboard.
Network Highlights
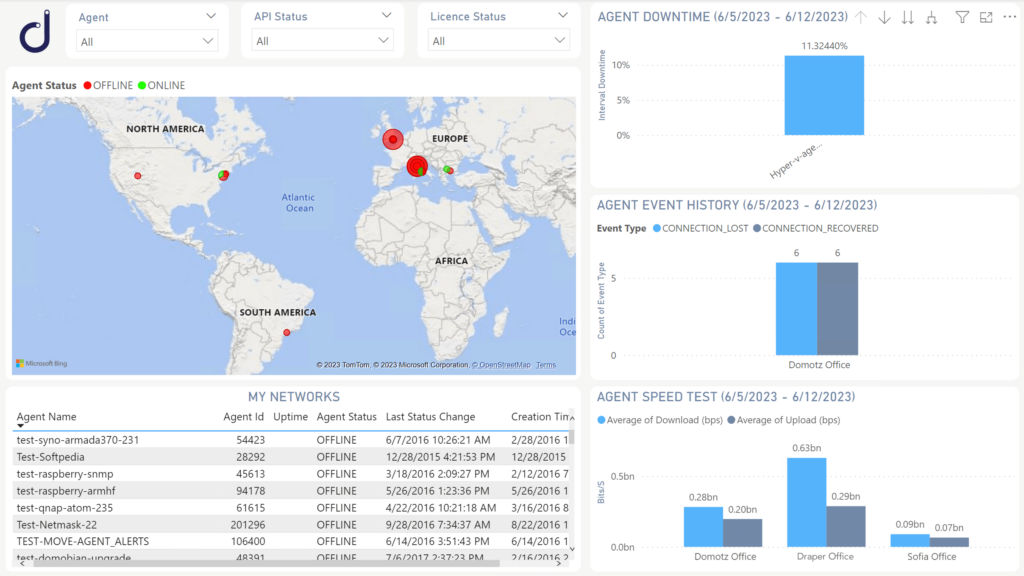
“Network Highlights” reports data about your Agents: their current status and location, their downtime during the selected period, the average speed test of their networks (AGENT SPEED TEST), and the events registered (AGENT EVENT HISTORY).
In AGENT DOWNTIME, AGENT SPEED TEST, and AGENT EVENT HISTORY, if you right-click on one agent data, you can drill down by time to visualize the downtime events or the historical trend:

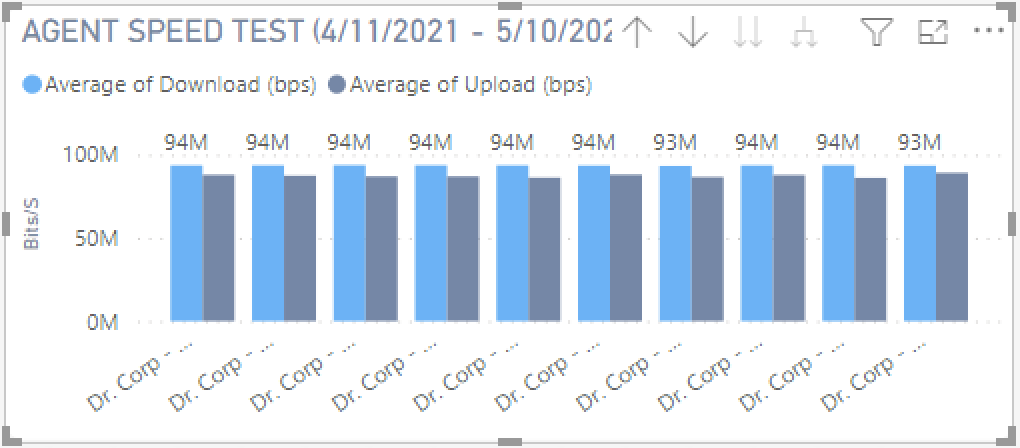
Remember that speed test and event history data are limited to the time period selected before the data load.
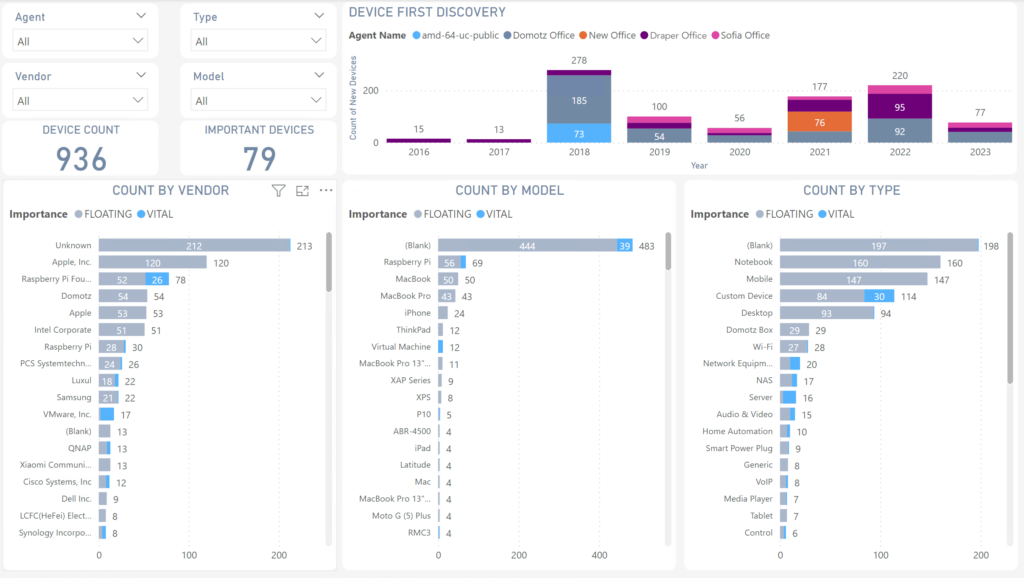
Network Inventory

In “Network Inventory”, you see the composition of your networks by device vendor (COUNT BY VENDOR), model (COUNT BY MODEL), and type (COUNT BY TYPE) distinguished by importance (VITAL or FLOATING).
The “device first discovery” graph reports how many devices were discovered over time, with the possibility of drilling down over time.
Device Performance
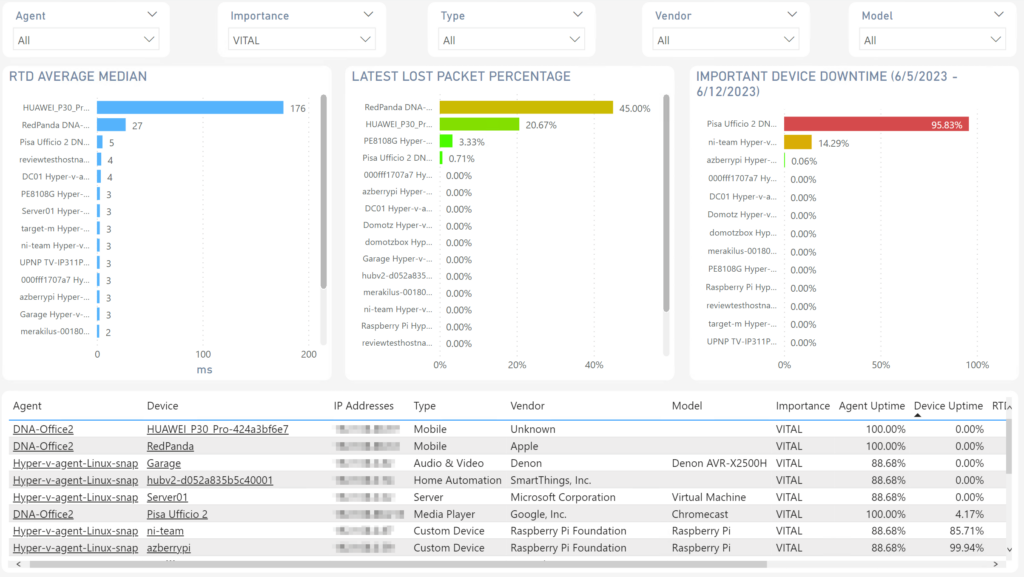
Device Performance may help you find which of your devices is slow regarding RTD (RTD AVERAGE MEDIAN) and which has the highest packet loss (LATEST LOST PACKET PERCENTAGE). It also reports the downtime of important devices.
If you want to troubleshoot your device in Domotz WebApp, click on the Device field in the table, which will link you to its page.
SNMP/TCP
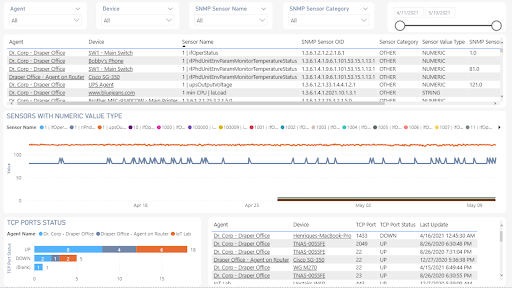
SNMP/TCP retrieves data from your sensors. The latest values are reported in the tables, while in the chart, you see the historical data over time of the SNMP sensors with a numerical value type.
Variables
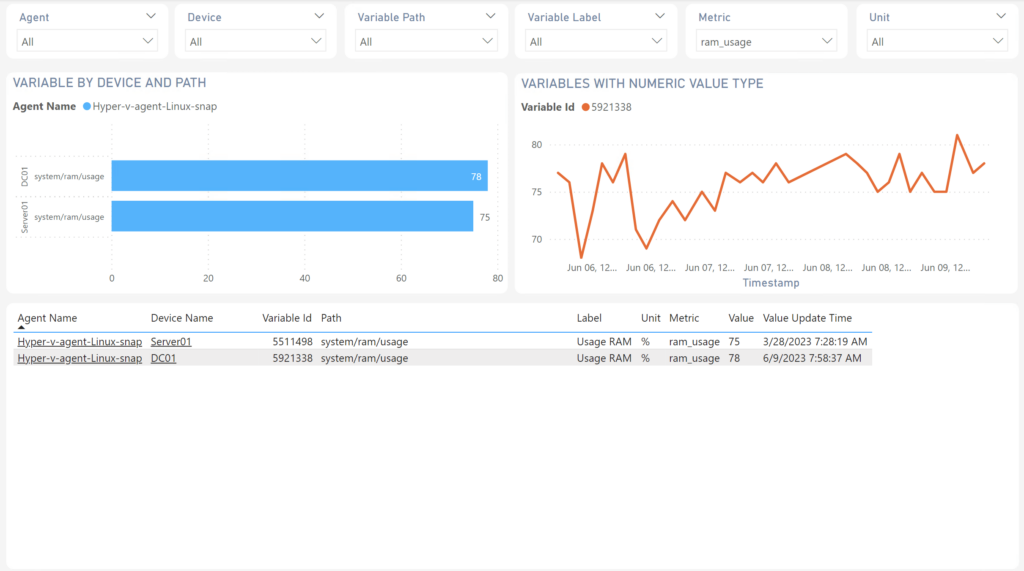
If you use Pre-Configured SNMP Sensors, Custom Integrations, or TCP Sensors, this dashboard allows you to access this information in a single place. Just filtering by “Metric” you will be able to see at a glance the free space of all your disks or the RAM usage of all devices along with their historical values. Alternatively, you can filter by “Unit” to see, for example, any temperature sensor or select the specific sensors you are interested in by their path or label.
Applications
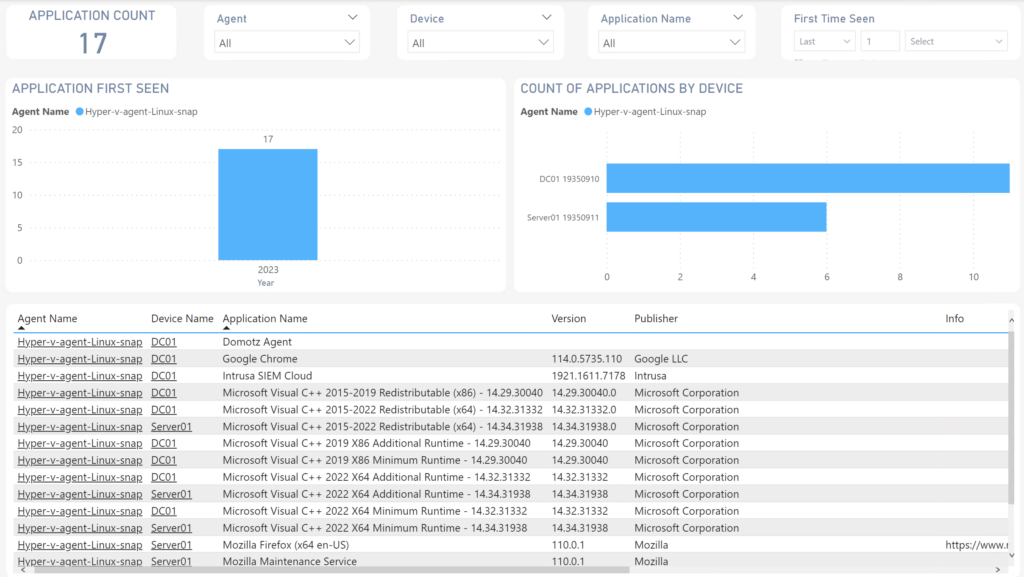
If you unlock the OS monitoring on any device, here you can see the list of all the applications in your devices, with a visual of when they were discovered. You can drill down in this view to determine when and where you installed the new applications.
Customizing your Power BI templates
Every Power BI template, even the Domotz one, can be customized and adapted to fit your needs better.
You can set a global filter at the page or template level using the “Filters” section or create a visualization leveraging the list of fields available in the “Fields” section.
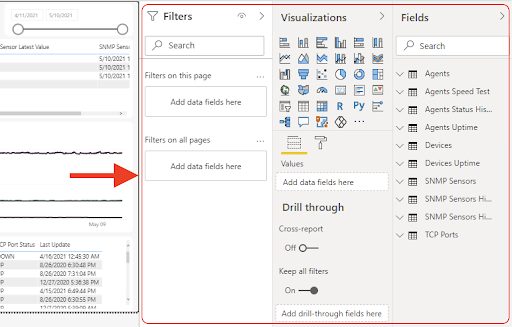
For example, add/remove some fields from the tabular views of the Domotz template or create a chart view containing only a specific set of sensors (e.g., all the printer supply levels).
When you finish your customization, you can save it as a .pbit or .pbix file:
- .pbix is a file that contains the structure (data sources, data manipulations, the data model, reports) along with the actual data
- .pbit is a template file that contains the structure like a .pbix file but without data
What is and why use Power BI gateway?
Power BI gateway is software required to access data in an on-premises network. The gateway manages the request if anyone needs to access on-premises data from a cloud or web-based app.
The on-premises Power BI gateway provides quick and secure data transfer between data not in the cloud, called on-premises data, and several Microsoft cloud services.
Power BI gateway allows you to schedule an automatic refresh of your reports or an on-demand refresh.
How to get started with the Power BI gateway
Get ready to use the data gateway in Power BI by following these five simple steps:
1: Download the standard mode of the Power BI gateway and install it.
2: Start it and login in with your credentials.
3: Create a new Power BI gateway with a custom name, for example, “myDomotzGateway”.
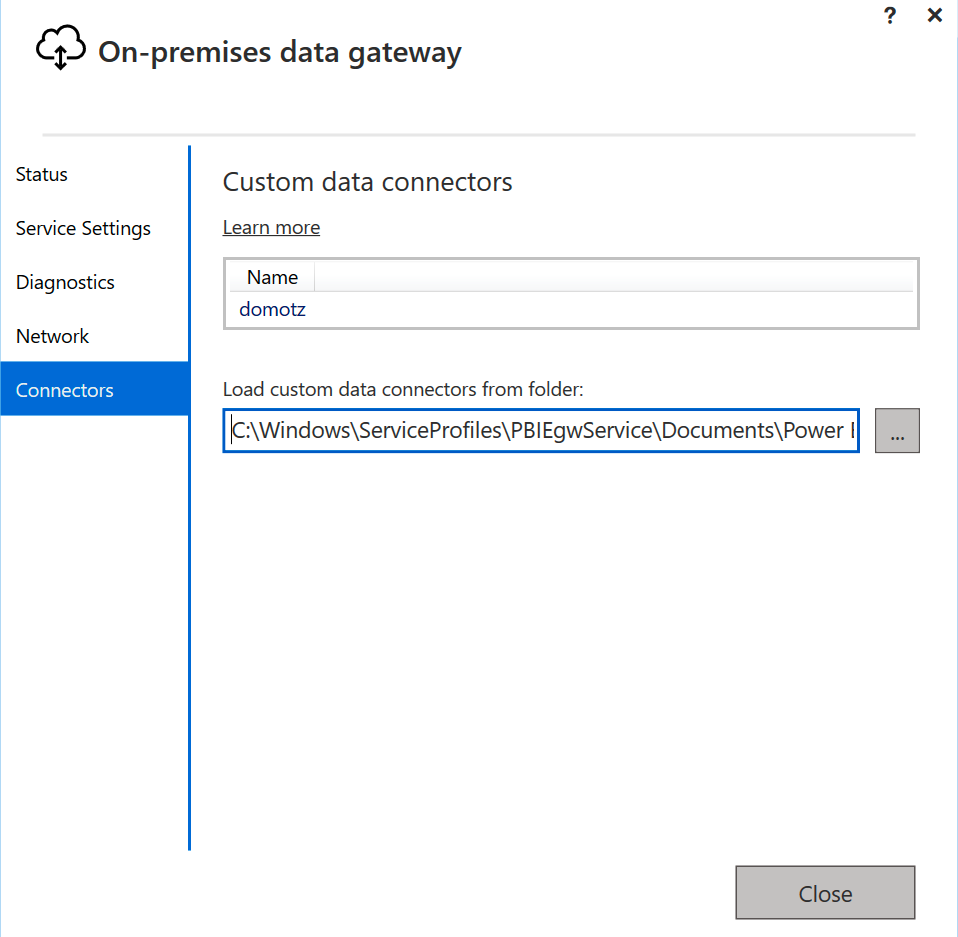
4: Open the connectors settings tab and copy the domotz.mez file in the default directory proposed by the interface, in this example, “C:\Windows\ServiceProfiles\PBIEgwService\Documents\Power BI Desktop\Custom Connectors”. If the directory does not exist, create it.
Step 5: See the Domotz connector loaded after you restart your gateway service:
How to configure the Power BI service to use the Power BI gateway
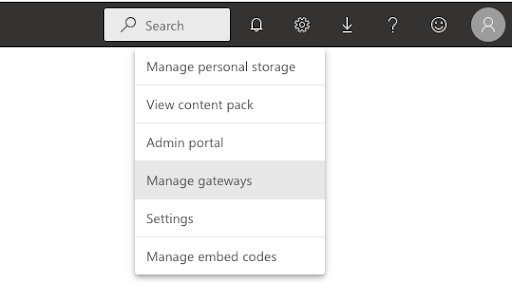
Firstly, open the “Manage Gateways” section in the Power BI service:
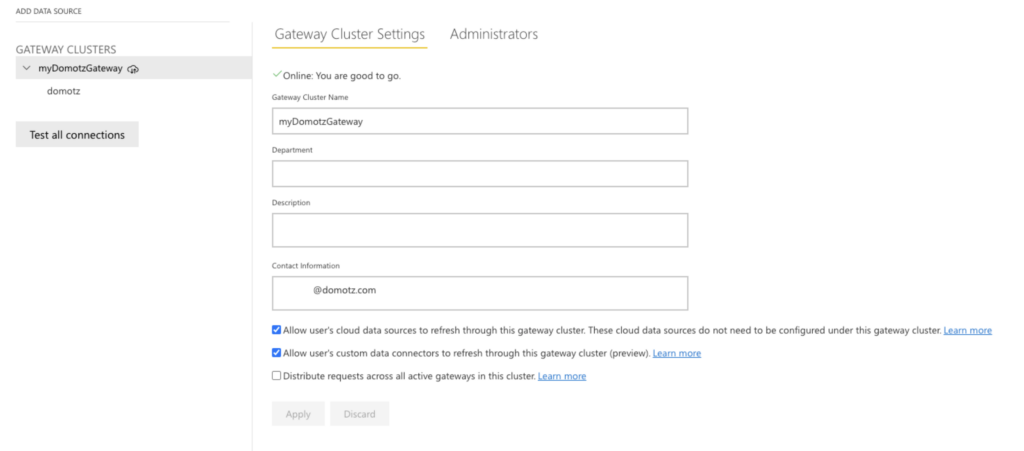
Secondly, select “Allow user’s custom data connectors to refresh through this gateway cluster”:

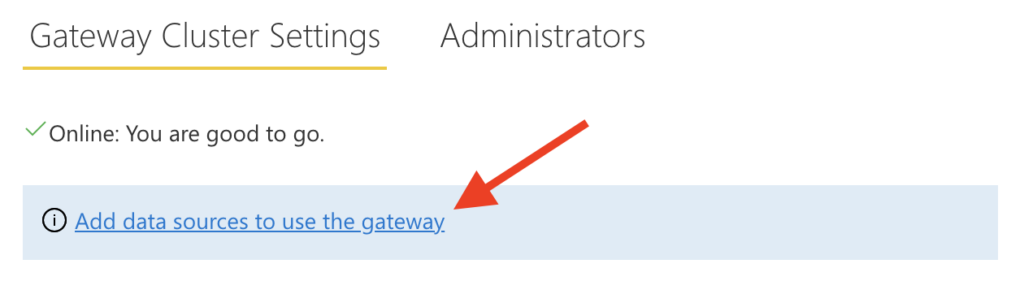
Then add the Domotz data source:
The last step is to provide your Domotz Public API credentials – use the API endpoint as Username and the API Key as Password:
How to use the data source to refresh the data
Create your report starting from the Domotz template for Power BI. Do not select a time frame when opening the template.
Publish your report when you want.
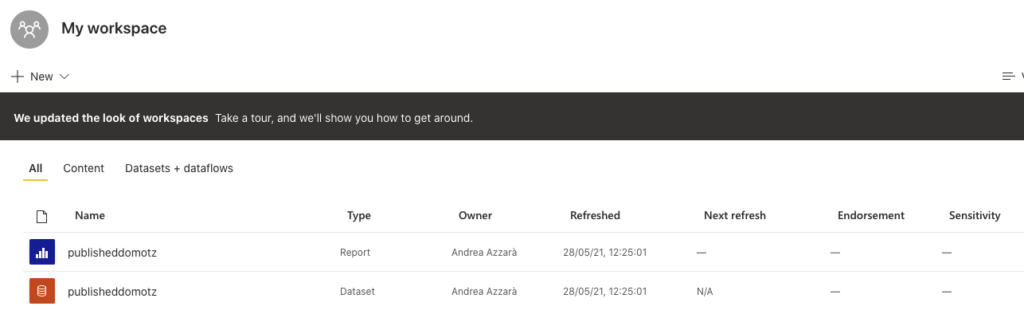
As a result, you’ll see both the report and the dataset in the Power BI service workspace:
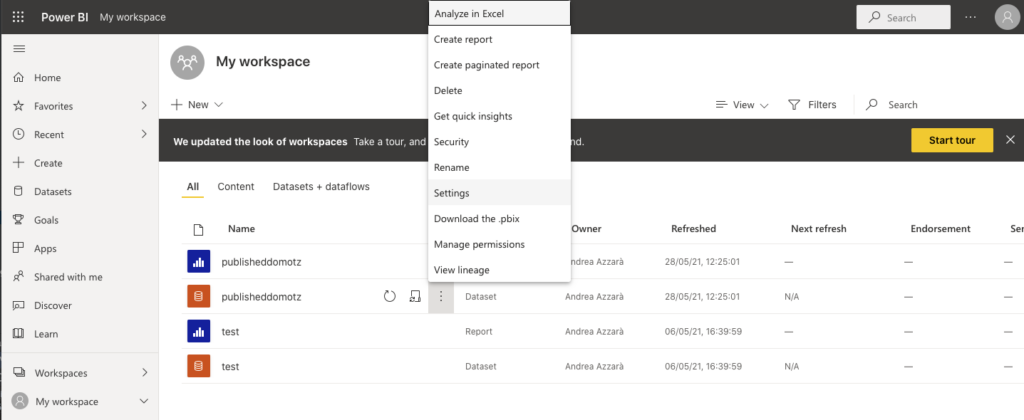
Proceed with opening the “Settings” of the datasets from the menu to open “Gateway Connection”:
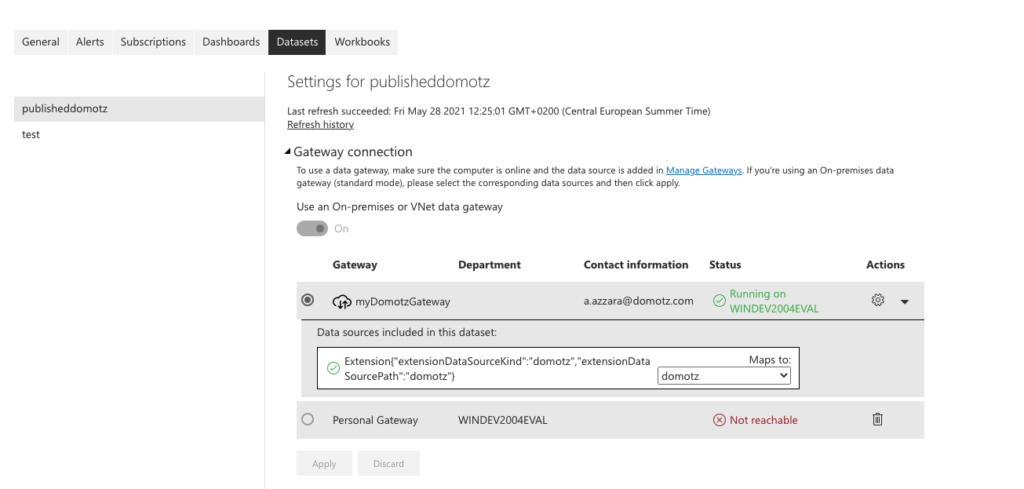
As a result, you can now refresh the dataset by assigning the newly-created data source:
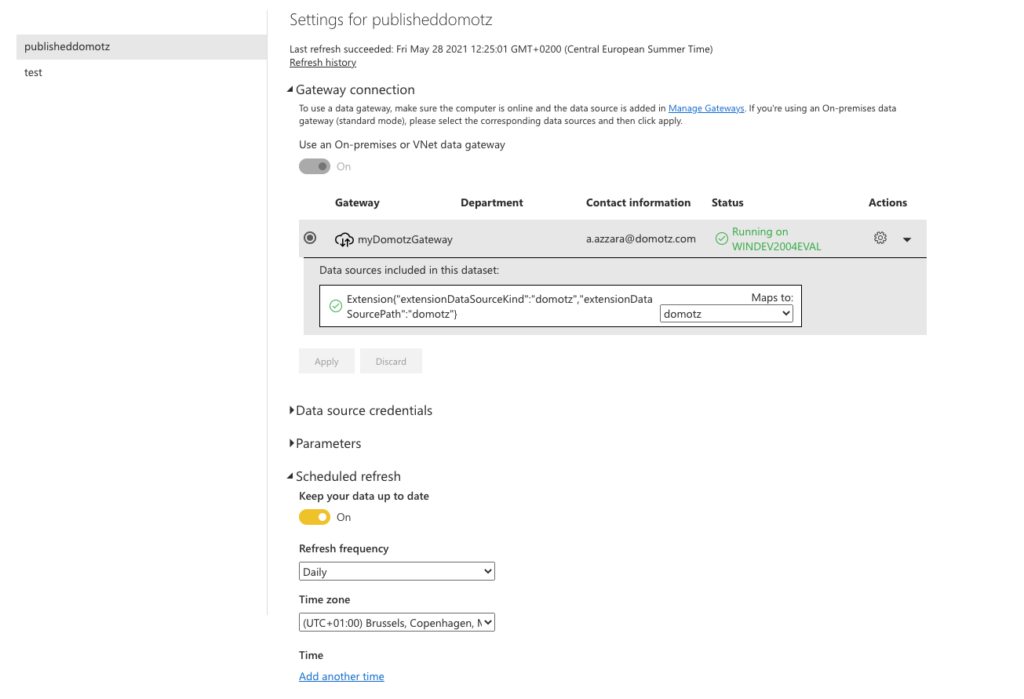
In addition, on the same settings page, you can also configure the automatically scheduled refresh:
I am not able to see the geo map in PowerBI
It may happen that the Geo Map is not visible in your PowerBI Domotz Template. This may be due to PowerBI configurations:
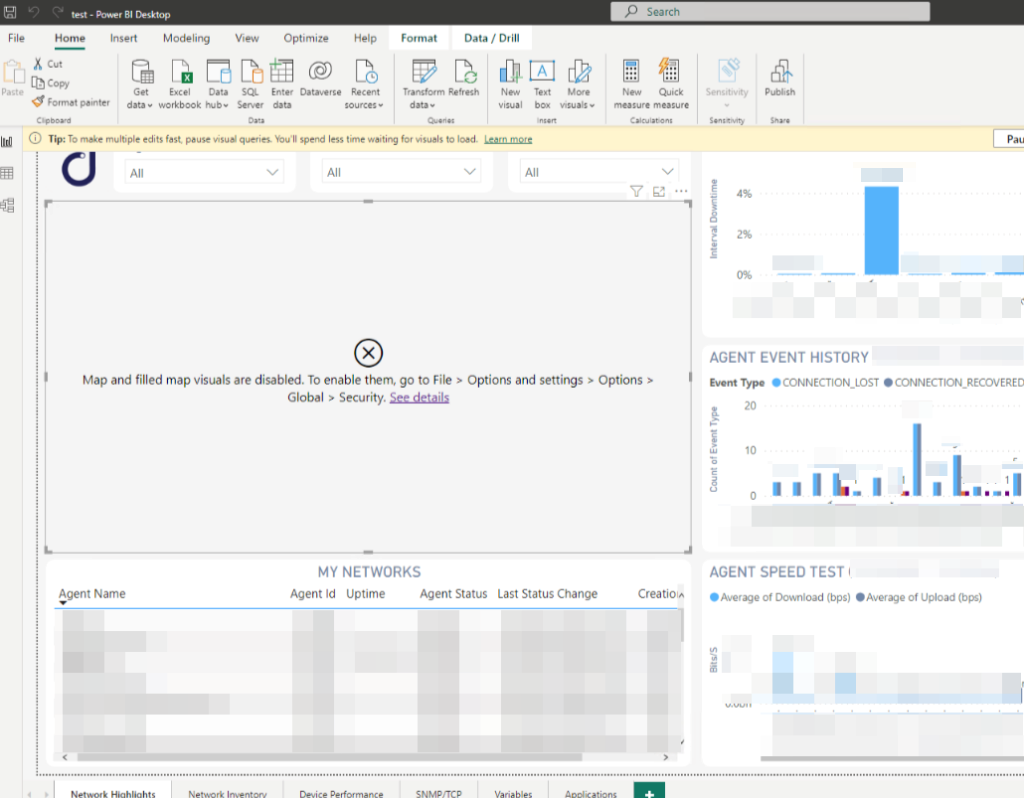
Under File -> Options and Settings -> Optiona -> Global -> Security, you may check the following checkbox to enable it: