Here are the latest features we’ve added to Domotz:
- HaloPSA can now be used as a Contact Channel for notifications
- Syncro MSP can now be integrated with Domotz to synchronize assets
- Monitoring Tables can now be opened in a new dedicated window
- Monitoring Dashboards can now be re-ordered
- Squadcast has been added as a service which can be connected to Domotz
- iDRAC is now supported for OS Monitoring via SSH
- Search & Manage optimizations and new functionalities
- Extended TCP and UDP Port scanning
- Additional MIBs
What’s new
HaloPSA Integration (Ticketing System)
You can now connect HaloPSA with Domotz. HaloPSA is now available as a Contact Channel for Shared Alerts. Domotz creates and updates HaloPSA Tickets when a network or device event being monitored occurs.
- Firstly, Domotz creates a HaloPSA Ticket for the alerts you choose.
- Secondly, if new events occur on a network or device, existing opened tickets are updated automatically. When a ticket is closed and a new event occurs on that network or device, a new ticket is generated.
- Thirdly, any new ticket generated will reference the previous ticket so that all details are at your fingertips.
- Additionally, you can also configure the integration so that Domotz automatically closes HaloPSA tickets when specific conditions are met.
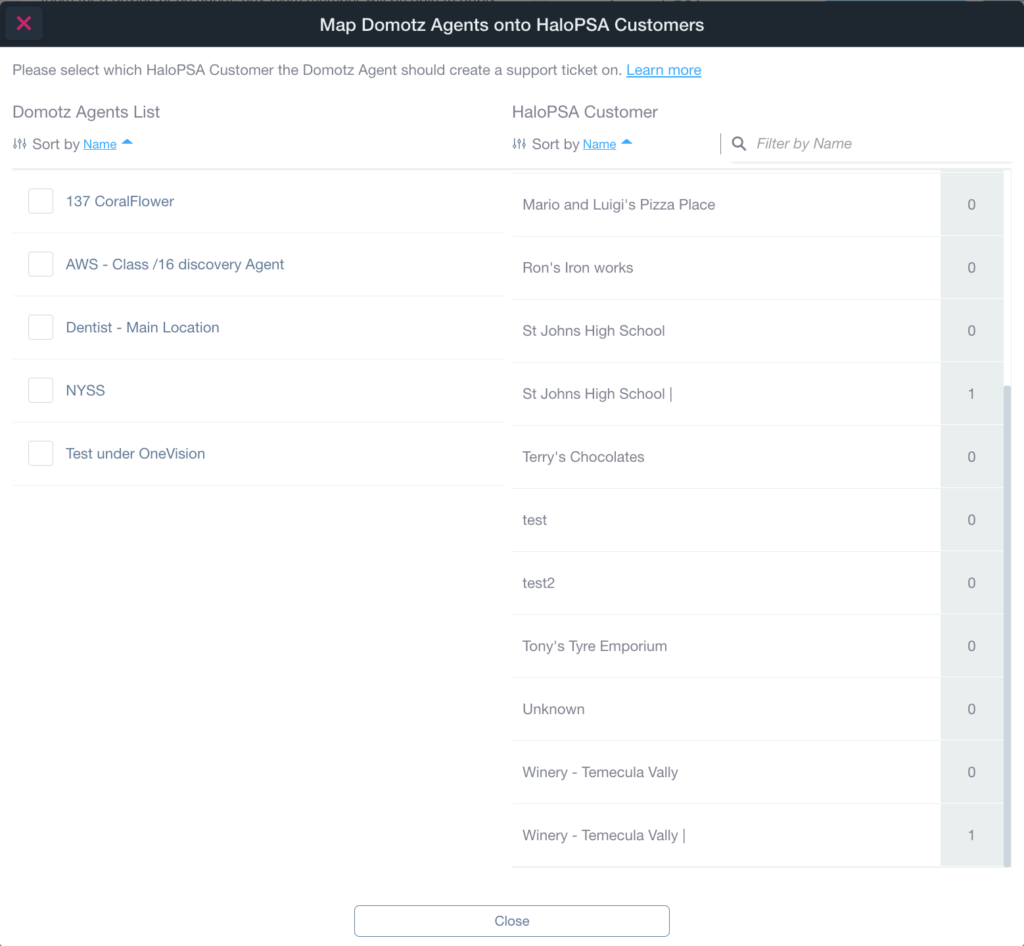
When configuring this integration, you need to connect a Domotz Agent to one specific HaloPSA Account. This is so that every time a ticket is generated in HaloPSA, it flows under a specific Customer/Site.
Syncro MSP Integration (Asset Management Synchronization)
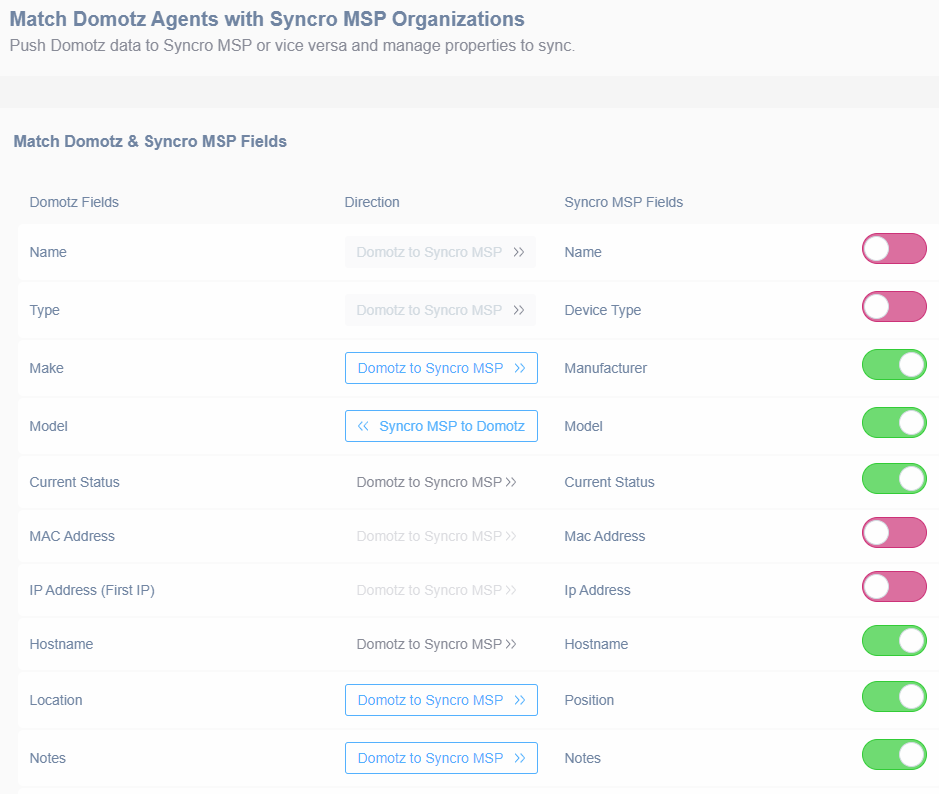
Connect your Syncro MSP account to Domotz to keep your Asset Lists / Inventory data synchronized between the two platforms.
Firstly, you can discover all devices with Domotz and send all details directly to Syncro. Secondly, thanks to the bi-directional communication between the services, networks that are already documented in Syncro can now be automatically synced with Domotz too.
The integration enables the following capabilities:
- Firstly, Domotz scans the network and gathers all details about all devices including: make, model and type, MAC address, vendor, location, zone, software version, IP address and automatically sends all asset details directly to Syncro.
- Additionally, you can edit device details in Syncro and sync those changes to Domotz.
- Assets already documented in Syncro can be synchronized directly with Domotz
- Furthermore, you choose which data fields to sync and whether information flows from Domotz to Syncro, or from Syncro to Domotz and whether this is done automatically or manually.
Improvements
Search and Manage optimizations
The new Search & Manage view is now available. In a fraction of a second, this feature is able to process hundreds of thousands of different devices, across thousands of Domotz Agents.
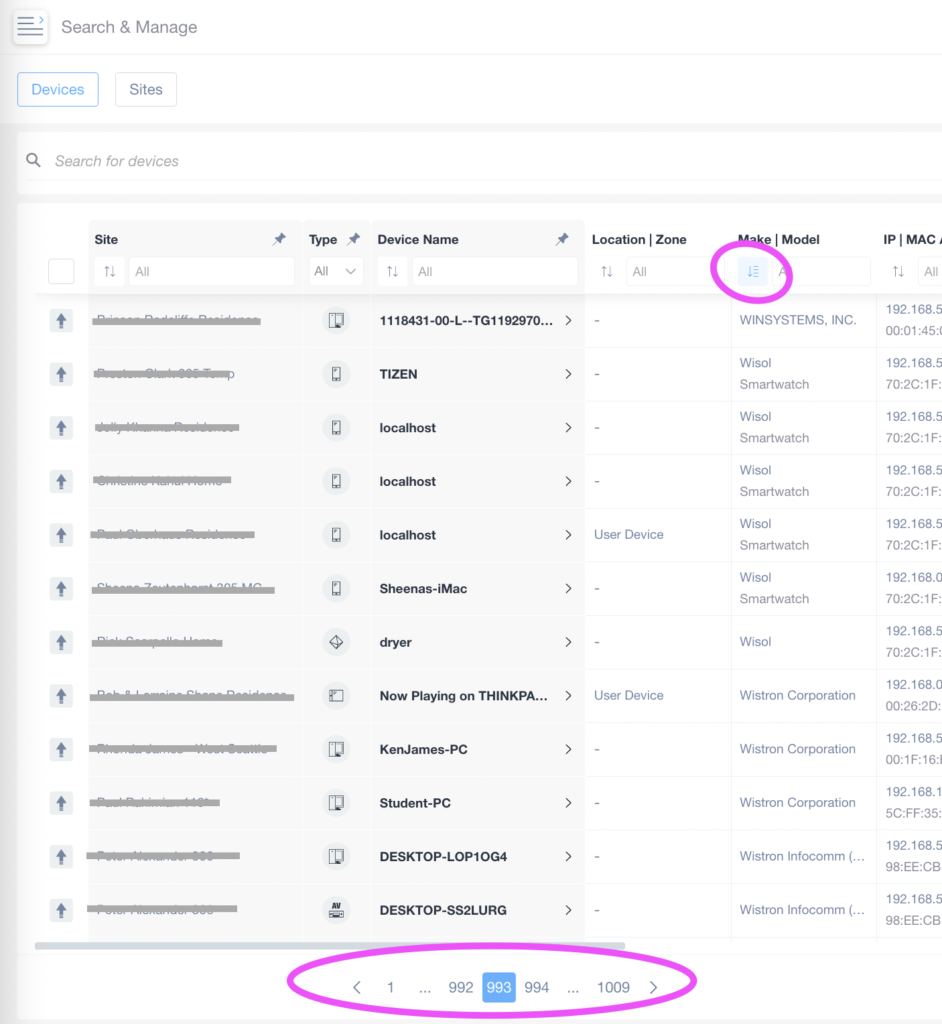
To illustrate this, the above screenshot shows more than 100,000 devices, across 1009 pages with 100 devices displayed per page.
A new sorting and filtering mechanism has been introduced which helps you quickly retrieve any information you need. This is available for all your devices across all your Domotz Agents (Sites).
Additionally, we’ve built a similar mechanism that allows you to search across hundreds of thousands Sites (Domotz Agents).
Furthermore, new fields have been added to the Device and Site tables to help you categorize each of them.
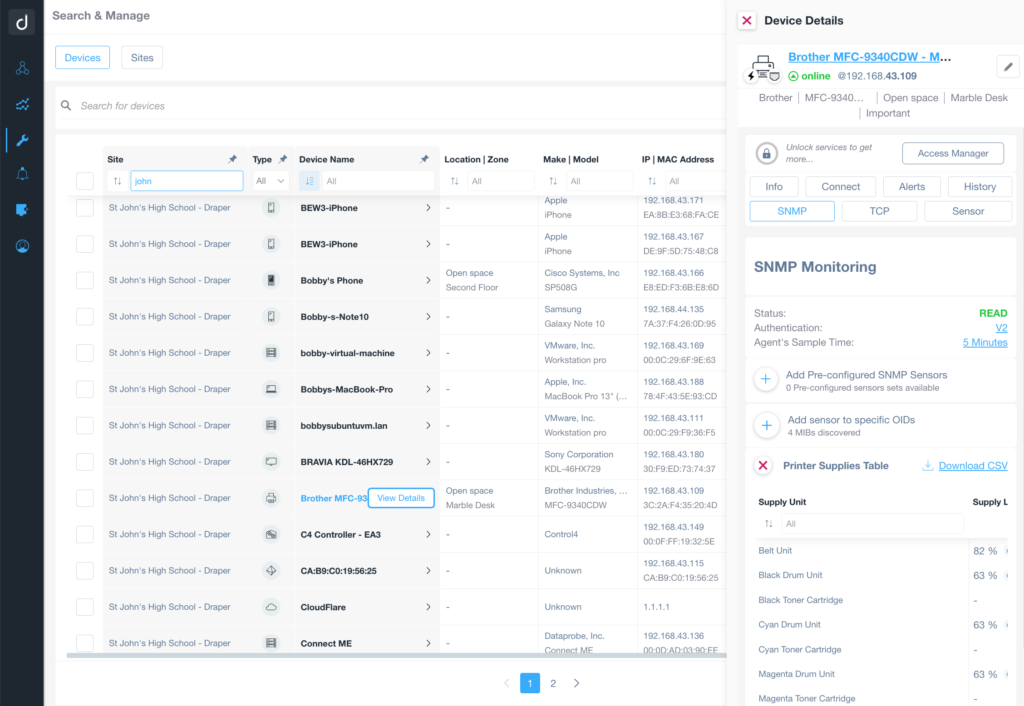
A right tab has been added to each device view, so that you can easily access the details for each device directly from the Search & Manage view.
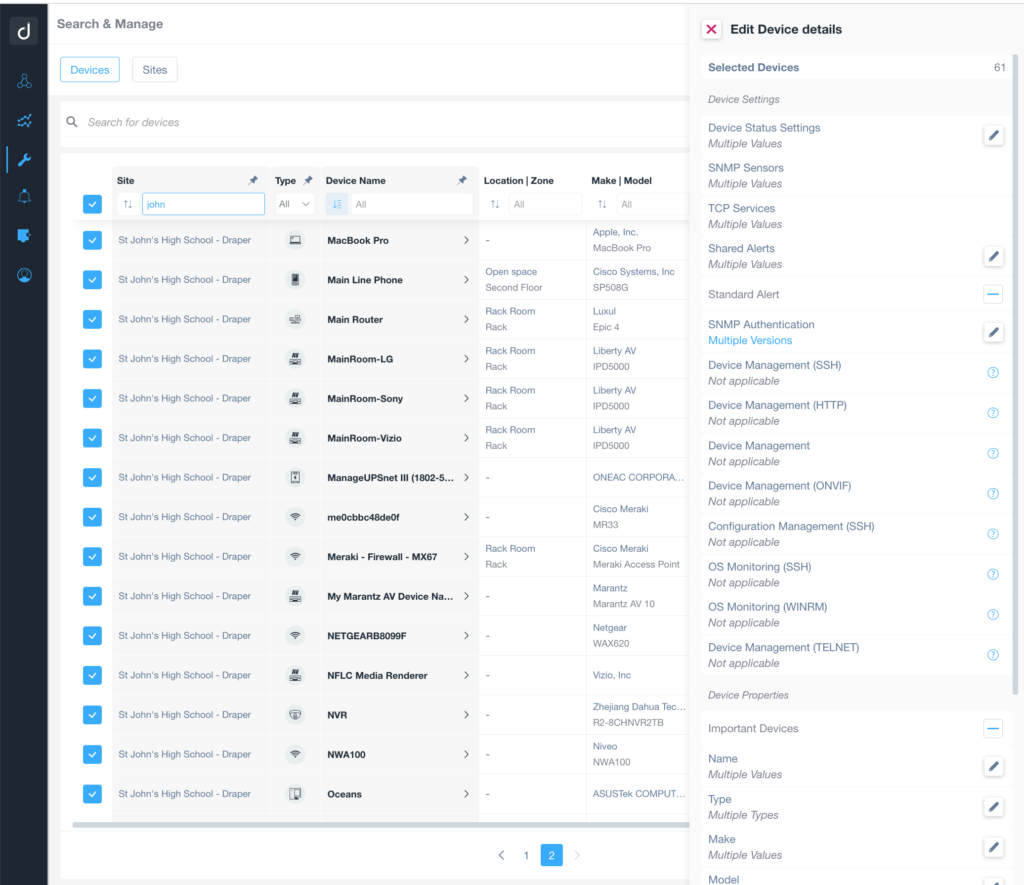
Additionally, we’ve added a multi-select capability which provides easy to access functions (right tab). This means that you can quickly perform configuration actions (or review them) on hundreds of devices in a few simple clicks.
Extended Device Port scanning
We’ve extended the available services reported in the Device Details. Domotz Agent is now able to scan a larger number of both TCP and UDP ports and display the details of this.
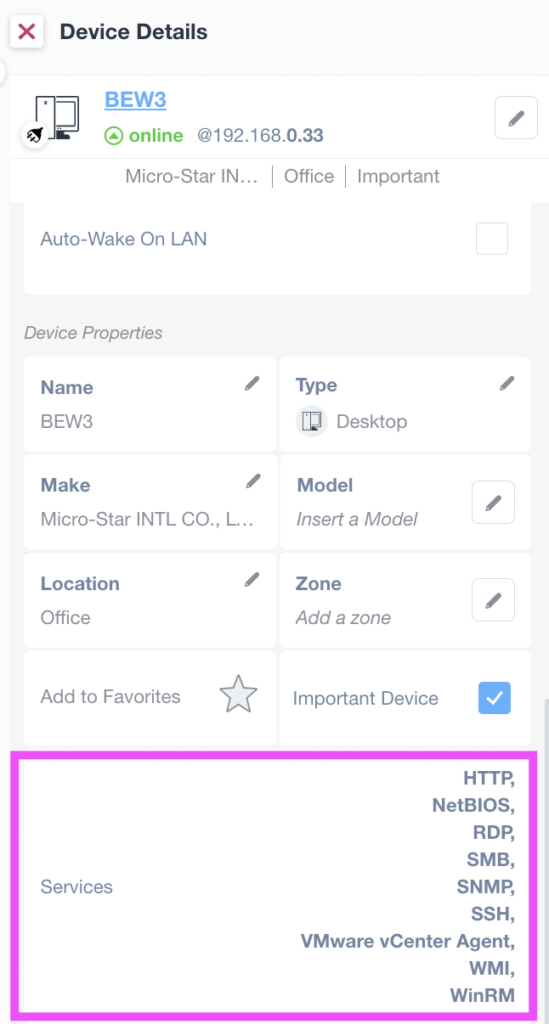
This is the complete list of the default service ports scanned by Domotz on each IP device discovered.
TCP ports:
      - 21    #FTP
      - 22    #ssh
      - 23    #telnet
      - 25    #SMTP
      - 53    #DNS
      - 79    #Finger
      - 80    #http
      - 110   #Pop3
      - 135   #WMI
      - 139   #Netbios
      - 143   #IMAP
      - 179   #BGP
      - 194   #IRC
      - 220   #IMAP
      - 389   #LDAP
      - 443   #https
      - 445   #SMB
      - 465   #SMPT SSL
      - 548   #AFP (Apple Filing Protocol)
      - 587   #smtp
      - 625   #Open Directory
      - 902   #VMware vCenter Agent
      - 993   #IMAP
      - 995   #Pop3
      - 1433  #Microsoft SQL
      - 3000  #domotz
      - 3306  #MySQL
      - 3389  #rdp
      - 5000  #UPnP
      - 5432  #Postgres
      - 5900  #vnc
      - 5985  #WinRM
      - 8000  #alternate HTTP
      - 8001  #alternate HTTP
      - 8080  #alternate HTTP
      - 8888  #alternate HTTP
      - 9389  #Active Directory
      - 27017 #MongoDB
UDP ports:
      - 53    #dns
      - 67    #dhcp
      - 69    #tfpt
      - 123   #ntp
      - 161   #snmp
Open Monitoring Tables in a new window
You can now open a Monitoring Table in a new window. This means that you can view your tables on a dedicated display, like on an NOC center, for instance.
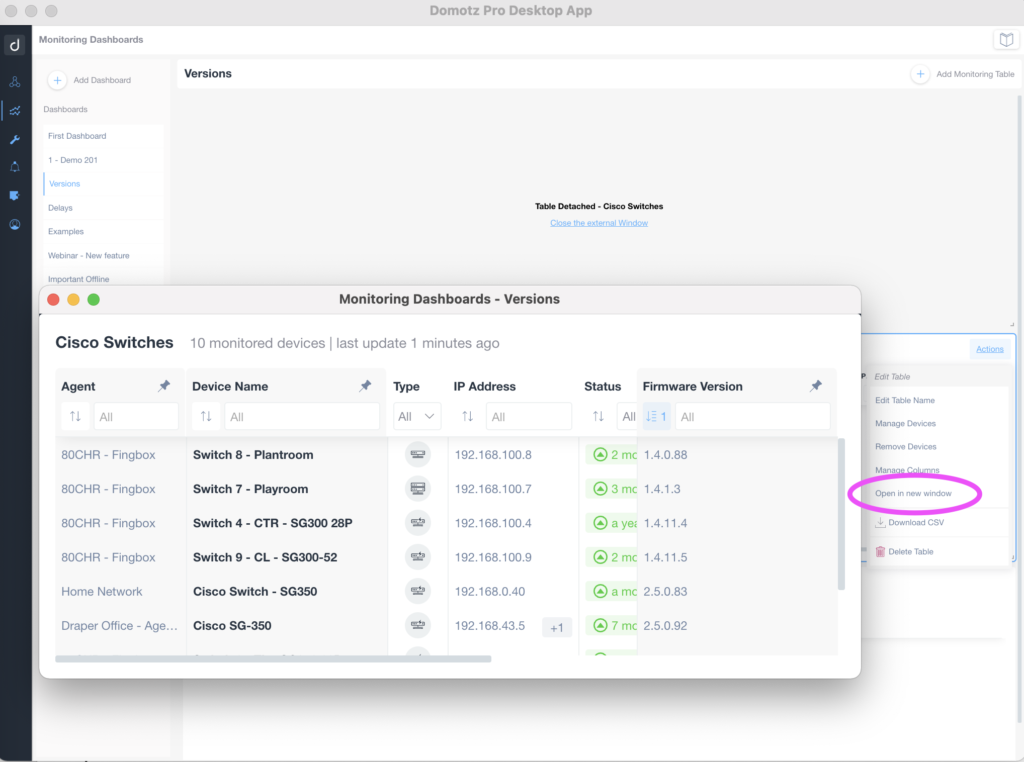
Each Monitoring Table can be opened in a new window which means that you can view them in different displays or monitors.
To maximize the usage of the available space, each popped out Monitoring Table is self-contained. Additionally, this eliminates wasted space on the top and left side bar.
Re-Ordering Monitoring Dashboards
You can now re-order your Monitoring Dashboards. Just drag and drop each “Dashboard” in the position you want it to appear.
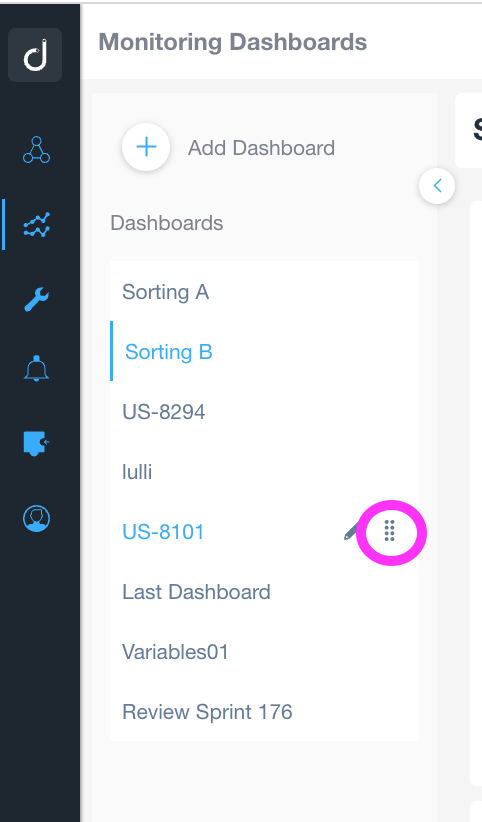
For instance, you can organize and re-organize your Dashboards even after they’ve all been created.
Squadcast
Domotz can now send notifications directly to the Squadcast ticketing system.
This integration was developed by the Squadcast team leveraging Domotz’s generic WebHook capabilities. If you need any assistance, contact the Squadcast support team.
OS Monitoring basic data in Public API
The Device Details data retrieved through the Public API now reports the following basic OS Monitoring variables:
- Name
- Version
- Build
The OS Name is also available as a possible name for a device in the Device Details tab (App and WebApp).
iDRAC support
The OS Monitoring feature now supports iDRAC devices via SSH. Each iDRAC machine can be “unlocked” in Domotz so that it is able to read OS information from the system.
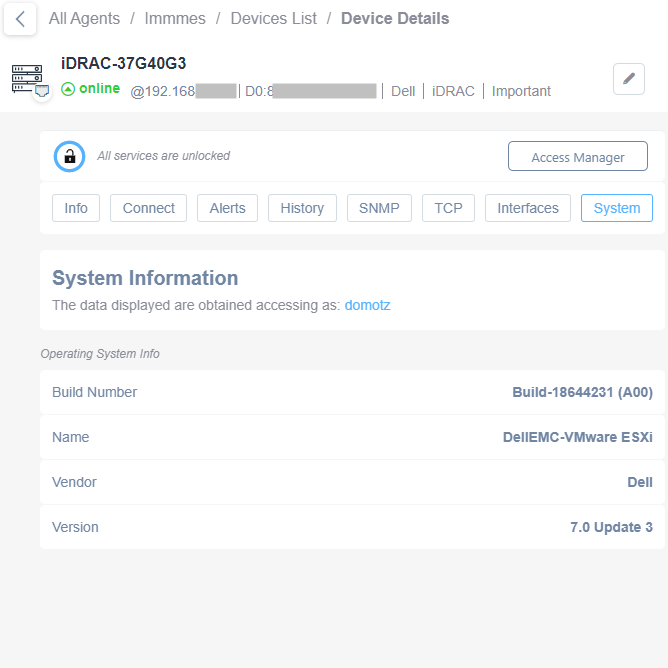
For more information, visit OS Monitoring feature in the user guide.
Larger networks detection
Domotz App and WebApp now notifies you if a Domotz Agent has been configured on a large network (larger than a /22 subnet mask). In addition, it’ll notify you that you have a larger network to scan but the feature has not yet been enabled.
Configuration Management: HP Aruba Switch (HPE)
You can now automatically backup the running configuration files of your HP Aruba switches (HPE). The result is that you’re always staying on top of changes happening on your network infrastructure devices.
Domotz will keep track of configuration changes over time and notify you if anything changes. In other words, you can easily identify network configuration issues. Additionally, stored backup files or new configuration files can be pushed to network devices directly from Domotz.
Visit Network Configuration Management to learn more.
Additional MIBs
The following MIBs were added to the list of those available on Domotz which means you can now search for these specific OiDs to add as sensors.
- UBNT-UniFi-MIB
Fix
We’ve fixed the following issues on Domotz.
- Public API, ipdevice details now show the discovered Open Ports in the following format:
Previously, open Ports were wrongly reported as “ip_ports” under the “details” section of the Device Details result. Similarly, the “service” was also reported. Therefore, we’ve removed the “service” information because what it reported was just the result of simple mapping (e.g. 80 -> http, 443 -> https, etc.). Furthermore, it was not actually the result of a discovered service.
- Crestron Home SSH command for unlocking functionalities is fixed.
- Agent Dashboard Map with custom logo is fixed.
- When a previously opened ticket was deleted in FreshService, Domotz can now create a new ticket.
- The issue with the Configuration Backup failure requiring subsequent unlock requests has been fixed.
- In certain circumstances, Mobile App Icons weren’t loaded correctly resulting in the display of strange icons.
- External Hostname/IP addresses did not accept valid subdomains with only one letter is fixed.
- When device events occurred, Telegram notifications weren’t formatted well is fixed.
- Remote connections on Android had problems with Basic Auth is fixed.
- DHCP Server IP address list monitoring has been fixed.
- Domotz Overview Map was not centered.
Known limitations
- Monitoring Dashboards are currently limited to Monitoring Tables as Widgets. This means that they do not report some variables (e.g. the ones created by the Custom Drivers) within the Monitoring Tables.
- VPN on demand is not currently supported on Luxul Router based Agents. We’ll add this capability as soon as Luxul’s team provides us with the required API resources.
- Devices with multiple network interfaces (multiple MAC addresses) can’t be merged into a single device. This affects some types of switches which appear as multiple instances on Domotz when VLANs are configured.
- The static IP address on the Domotz Box cannot be configured before configuring the Agent.
- HCP cannot be leveraged on additional VLANs on the Domotz Box.
This release notes changelog covers what’s changed in the Domotz Pro service since previous Release Notes. Furthermore, these changes include Domotz Pro cloud, Domotz Agent and Domotz Pro App.