
Domotz allows to define alerts at a network level (related to general problems of the network) and at device Level. This article shows how to work with Network Alerts. Please refer to Device Alerts to see how to work with alerts at a device level.
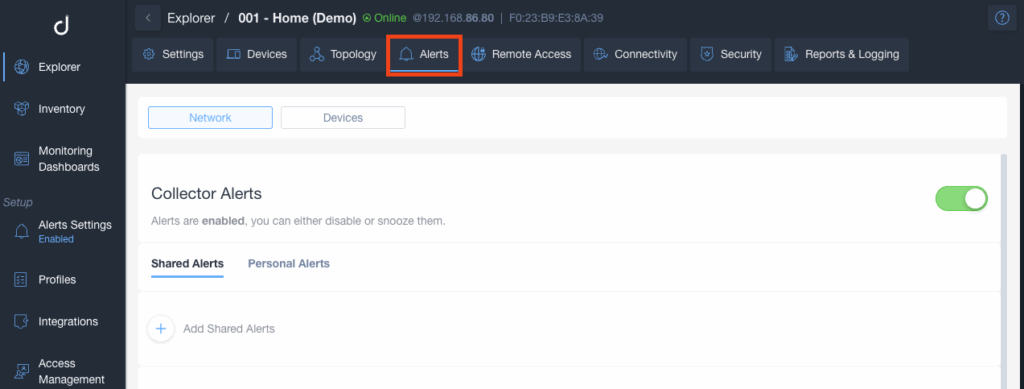
Network Event Alerts can be configured from the Collector Alerts section:
Accessing and Configuring Alerts in a Dashboard
1. Navigate to the "Alerts" tab located in the main menu bar at the top of the dashboard. This tab allows you to manage notification settings.
2. Within the "Alerts" section, you can switch between "Network" and "Devices" views using the corresponding buttons. Choose the appropriate setting based on what you want to monitor.
3. The "Collector Alerts" section displays the status of alerts. These alerts are currently enabled, but you can disable or snooze them as needed.
4. Under "Collector Alerts," there are two tabs: "Shared Alerts" and "Personal Alerts." Use these tabs to organize and view your alerts.
5. To add a new alert, click on "Add Shared Alerts" within the "Shared Alerts" tab. This option allows you to create and configure alerts shared with other users.
Personal and Shared Alerts
Domotz supports two types of alerts: Personal Alerts and Shared Alerts.
- Personal Alerts are tied to an individual user and notify only that user based on their personal alert preferences.
Personal Alerts
Personal Alerts are delivered only to your account email address or to your mobile device via push notifications.
Managing Collector Alerts in a Network Dashboard
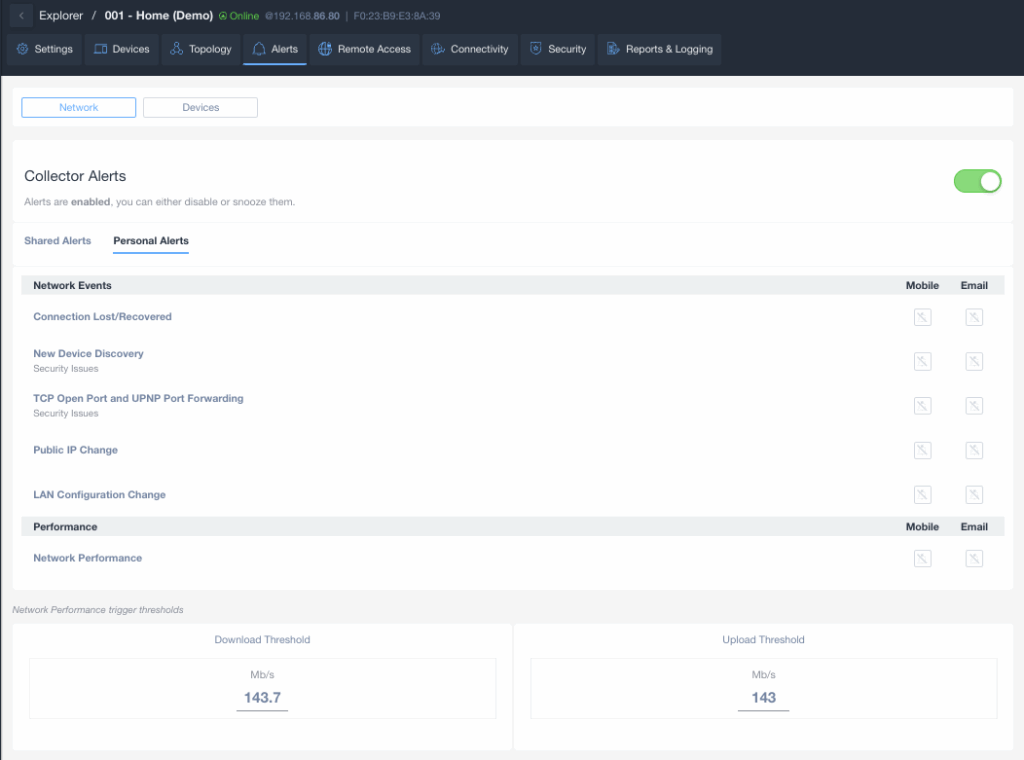
1. Navigate to the 'Alerts' section from the top navigation bar in the network dashboard.
2. Choose between 'Network' and 'Devices' tabs based on your alert preference.
3. In the 'Collector Alerts' area, ensure alerts are turned on using the toggle switch.
4. Under 'Network Events,' select alert types such as 'Connection Lost/Recovered,' 'New Device Discovery,' 'TCP Open Port and UPNP Port Forwarding,' 'Public IP Change,' and 'LAN Configuration Change.'
5. Adjust notification settings for each alert type by enabling mobile or email notifications using the corresponding icons.
6. In the 'Performance' section, you can manage 'Network Performance' alerts.
7. View or set the 'Download Threshold' and 'Upload Threshold' values under 'Network Performance trigger thresholds' to 143.7 Mb/s.
Personal Alerts Events Types
The available Personal Alerts for a Network are the following:
- Connection Lost / Connection Recovered
- New Device Discovery
- TCP Open Port and UPnP Port Forwarding
- Public IP Change
- LAN Configuration Change (Network Gateway, DNS, and DHCP Server monitoring)
- Network Performance (Download and Upload speed thresholds)
Shared Alerts
Shared Alerts are delivered to a contact channel. A Shared Alert is a predefined profile that allows you to associate a selected set of events (network or device events) with your preferred notification channel.
A contact channel can be a PSA or ticketing system, a webhook, an integrated platform, or a distribution list of email addresses. For instructions on how to create a Shared Alert profile, please refer to Shared Alerts and Ticketing Systems.
When you create a Domotz account, a default Network Monitoring Shared Alert profile is automatically created and applied to all Collectors. This profile ensures that critical network-level events are monitored and notified from the moment your Collector comes online.
The default Network Monitoring profile includes the following events:
- Connection Lost
- Connection Recovered
- Public IP Change
- TCP Open Port and UPnP Port Forwarding
Configuring Collector Alerts
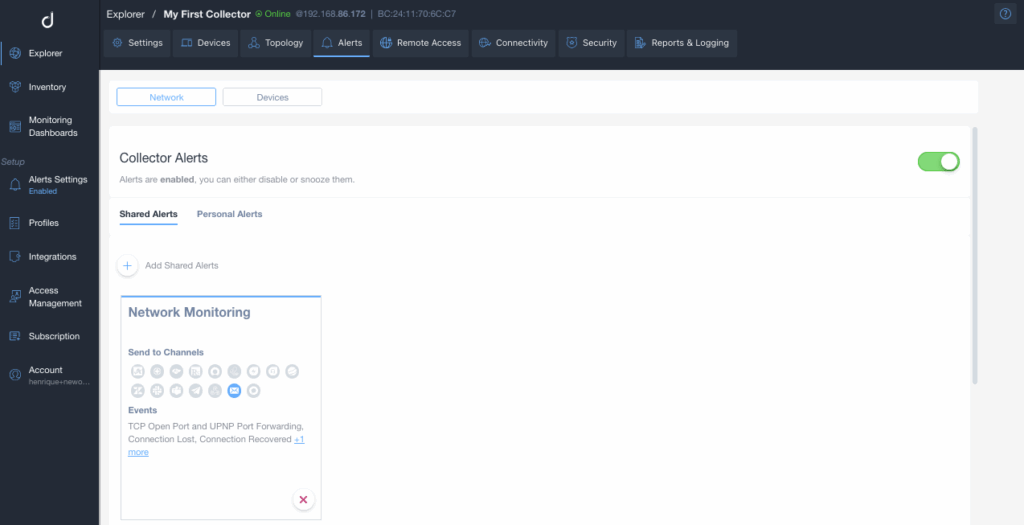
1. Ensure you are in the "Alerts" section within the software's interface.
2. The "Collector Alerts" toggle is set to enabled, indicated by the green switch on the right side. Alerts can be disabled or snoozed if needed.
3. Under "Shared Alerts," you will see a button to add new shared alerts.
4. A specific alert titled "Network Monitoring" is configured. It includes options to send notifications to various channels. Icons represent each channel, such as email or other communication platforms.
5. The "Events" section lists monitored activities like TCP Open Port and UPNP Port Forwarding, Connection Lost, and Connection Recovered.
6. Additional event details can be accessed by clicking the "more" link. You can remove this alert by selecting the red X button.
Shared Alerts Event Types
The available Shared Alerts for a Network are the following:
- Connection Recovered
- Connection Lost
- Speed Test Threshold (Download and Upload speed thresholds)
- Device Discovery
- Public IP Change
- LAN Configuration Change (Network Gateway, DNS, and DHCP Server monitoring)
- TCP Open Port and UPNP Port Forwarding
- Feature Discovery
Please refer to Device Alerts to know more about alerts at a device level.
Network Connection Lost Explanation
The Connection Lost alert will only activate if the Collector fails to establish contact with our Cloud for a minimum of 8 minutes.
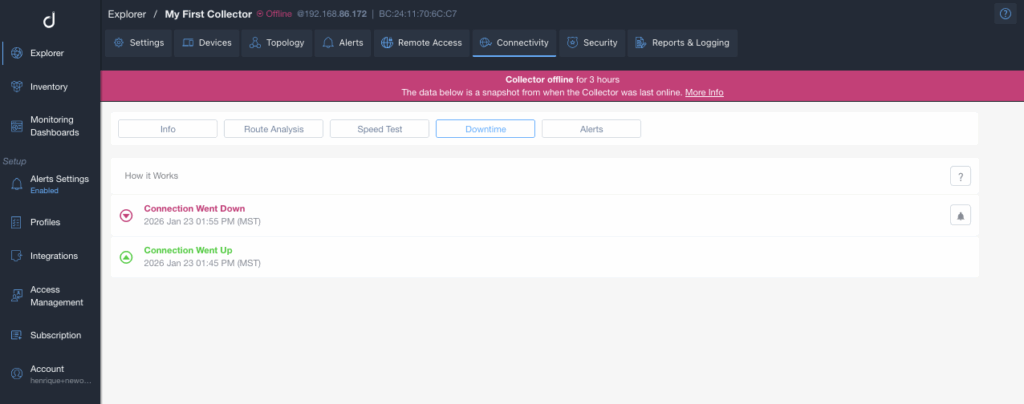
In the Collector Downtime tab (Webapp → Explorer → Connectivity section → Downtime tab), when you see a bell icon (🔔) next to a disconnection event, it indicates that the event triggered an alert from the cloud perspective. These events are identified as Collector Connection Lost alerts.
This means there was a disruption in the connection between the Collector and the Domotz cloud service lasting at least 8 minutes.
On the other hand, entries considered as Simple Disconnections are routine disconnection events that don’t trigger alerts (these didn’t last for at least 8 minutes). These events might indicate temporary disruptions in the Collector connectivity but are not considered critical, so they will not trigger an alert.
The bell icon (🔔) serves as a clear visual indicator for events considered Connection Lost; entries without it are considered Simple Disconnections and will not trigger an alert.
Network Monitoring Dashboard with Downtime Alerts
1. The top section displays the status of "My First Collector," showing it is offline for 3 hours, along with its IP and MAC addresses.
2. Tabs available: "Info," "Route Analysis," "Speed Test," "Downtime," and "Alerts." The "Downtime" tab is selected.
3. A notification bar highlighted in pink indicates the collector is offline and that the data is a snapshot from the last online session.
4. Under "Downtime," it lists connection events:
- "Connection Went Down" on January 23, 2026, at 01:55 PM (MST).
- "Connection Went Up" on January 23, 2026, at 01:45 PM (MST).
5. A side menu on the left provides navigation to sections like "Explorer," "Inventory," "Monitoring Dashboards," "Alerts Settings," "Profiles," and more.