
To help with Domotz onboarding, this article covers the top tips and tricks for using our software. Here’s our list of the most frequent topics raised by our users during their Domotz onboarding process.
VLANs wrongly entered as “Routed Networks”
Do not use “Configure Routed Networks Scan” for VLANs. The routed network scan is intended for site-to-site VPN or similar connections (Layer 3 – scans). When you configure a routed network, you will only see IP Address information, as routed networks do not pass Layer-2 information, such as MAC Addresses.
Instead, see here how to configure VLANs in Domotz: https://help.domotz.com/user-guide/vlan-network-interface-configuration/
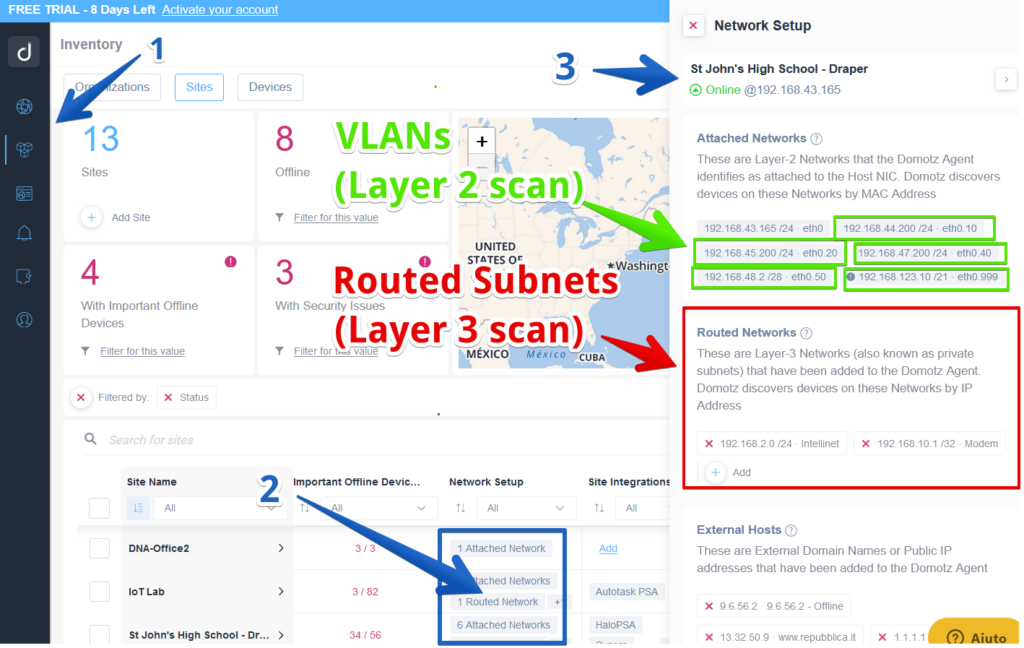
Network Setup Overview in Domotz Software
1. From the left sidebar, click the "Inventory" section, then select the "Sites" tab to view site statistics.
2. In the site list, locate the row for "St John's High School - Draper" to see details.
3. On the right, inspect the "Network Setup" panel. Under "Attached Networks," view the VLANs (Layer 2 networks) identified by MAC addresses listed with their respective IP ranges and interfaces (e.g., eth0.10, eth0.20).
4. Below, under "Routed Networks," examine the routed subnets (Layer 3 networks) listed by IP address and interface types (e.g., Intelinet, Modem). Use these to understand how networks are organized and connected in the Domotz Agent.
Kindly be aware that if you have set up VLANs as routed networks, Domotz will be unable to retrieve MAC addresses from your devices. As a result, it will lack the ability to classify them based on brand, model, or type, and those devices may also be excluded from the Network Topology.
References:
Automated Discovery and Inventory – Domotz Help Center
Configure VLANs in Domotz – Domotz Help Center
Incorrect Network Topology
After deploying Domotz on your network, you may encounter situations where accessing the network topology screen reveals inaccurate network links, leading to an incorrect topology map display.
To build an accurate network topology map, you must enable SNMP and provide Domotz with the correct SNMP credentials for all your managed switches. Before doing this, make sure you’ve added each switch as a ‘Managed Device’ in Domotz.
To verify that your switches are correctly set up, please inspect the SNMP settings on each of your switches and confirm that the SNMP Management entry in the Insight column is visible without the lock icon:
1) Go to the inventory dashboard in the ‘Devices’ section:
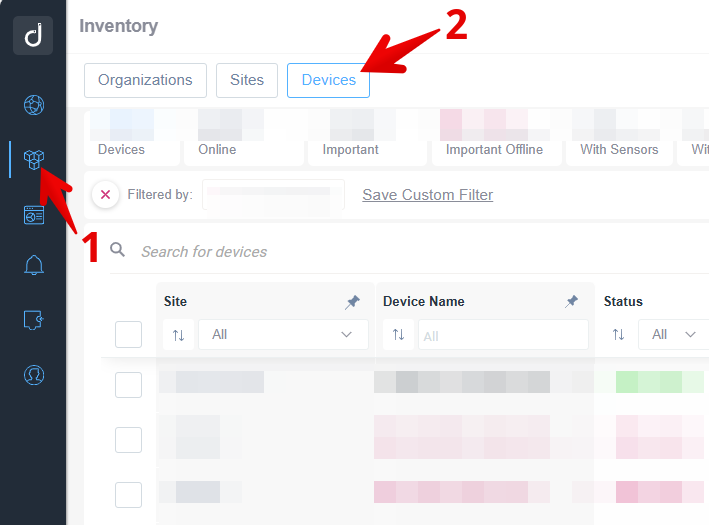
Navigating to the Devices Inventory Section
1. In the left-hand sidebar, select the inventory icon to access inventory options.
2. In the main menu, click on the "Devices" tab to view the list of devices.
3. Use the search bar labeled "Search for devices" to find specific devices by name.
4. Refine the search results using the filters available for "Site," "Device Name," and "Status" by selecting the desired options from the dropdown menus.
2) Filter the devices as detailed in the following screenshot (remember that if you have not set those devices as ‘Managed’ in Domotz you won’t see them in the Inventory dashboard):
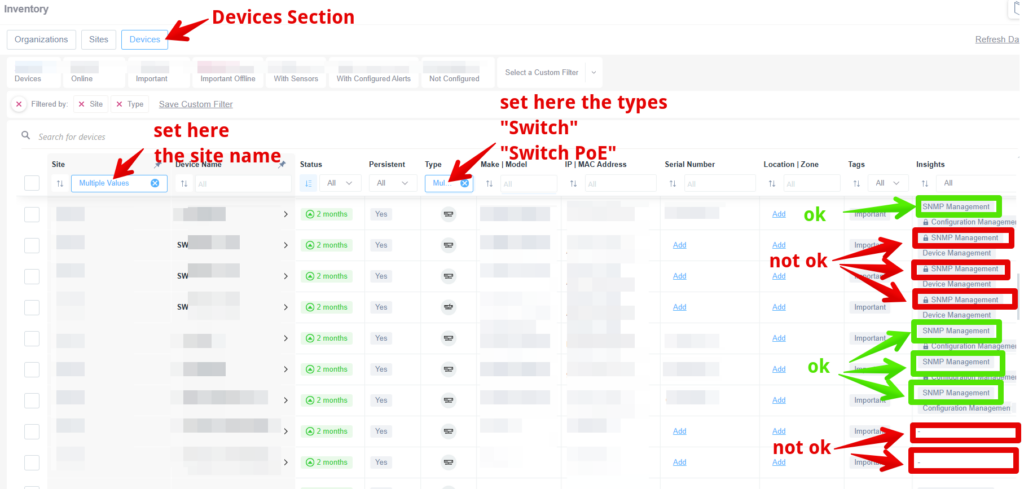
Managing Devices in the Inventory Section
1. Navigate to the "Devices" section in the inventory by clicking on the "Devices" tab at the top.
2. Set the site name using the dropdown labeled "Site" at the beginning of the device list.
3. Specify the device types using the "Type" dropdown. Select options such as "Switch" or "Switch PoE".
4. Check the "Insights" column on the right to confirm device management statuses. Green highlights indicate "OK" status with descriptions like "SNMP Management" and "Configuration Management". Red highlights indicate "not ok" status and may require attention.
If you need instructions on how to configure SNMP on your switches please see here:
https://help.domotz.com/onboarding-guides/how-to-get-started-with-domotz/#htoc-setting-up
and here:
https://help.domotz.com/tips-tricks/how-to-set-custom-snmp-credentials-in-domotz/
Set Collector Location on the Map
By default, Domotz uses ISP localization to determine an Collector’s location. To make the Collector’s location accurate on the map, you can set the Collector’s address. In the Domotz application, select your Collector> Settings > Customer > Basic Informaton > Location.
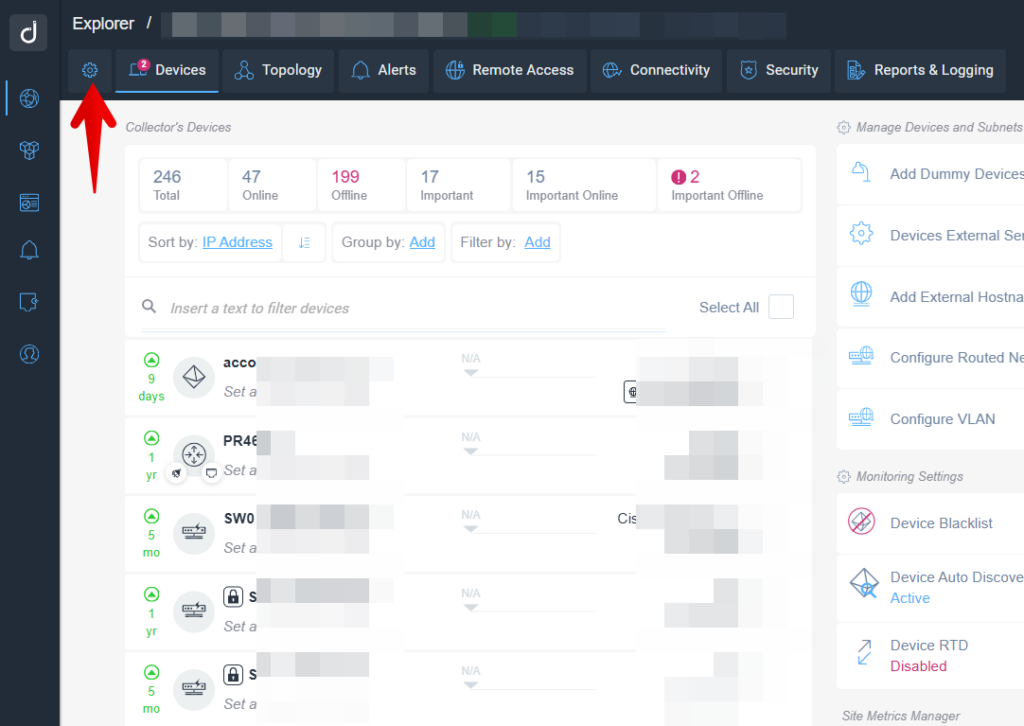
Dashboard Navigation and Device Management
1. To access the device management section, select the "Devices" tab in the navigation bar at the top of the dashboard.
2. The "Collector’s Devices" section shows device statistics, including the total number of devices, online and offline status, and important devices.
3. Use sorting and filtering options for devices by IP Address, Add, and other criteria.
4. Use the search bar to filter specific devices by entering text.
5. On the right, manage devices and subnets using options like "Add Dummy Devices," "Add External Hostnames," and "Configure VLAN."
6. Monitoring settings allow you to manage the device blacklist and auto-discovery features.
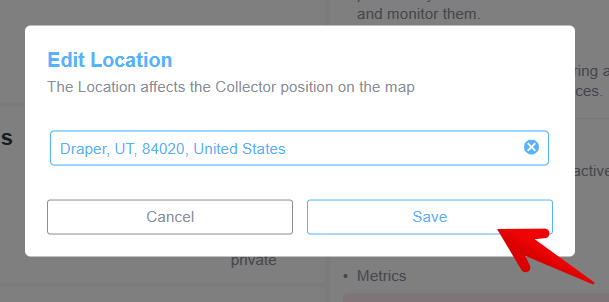
Edit Location Dialog Box
1. Enter the desired location in the text field, such as "Draper, UT, 84020, United States."
2. Choose "Save" to confirm and apply the new location, which will affect the Collector's position on the map.
3. Select "Cancel" to dismiss the dialog without making changes.
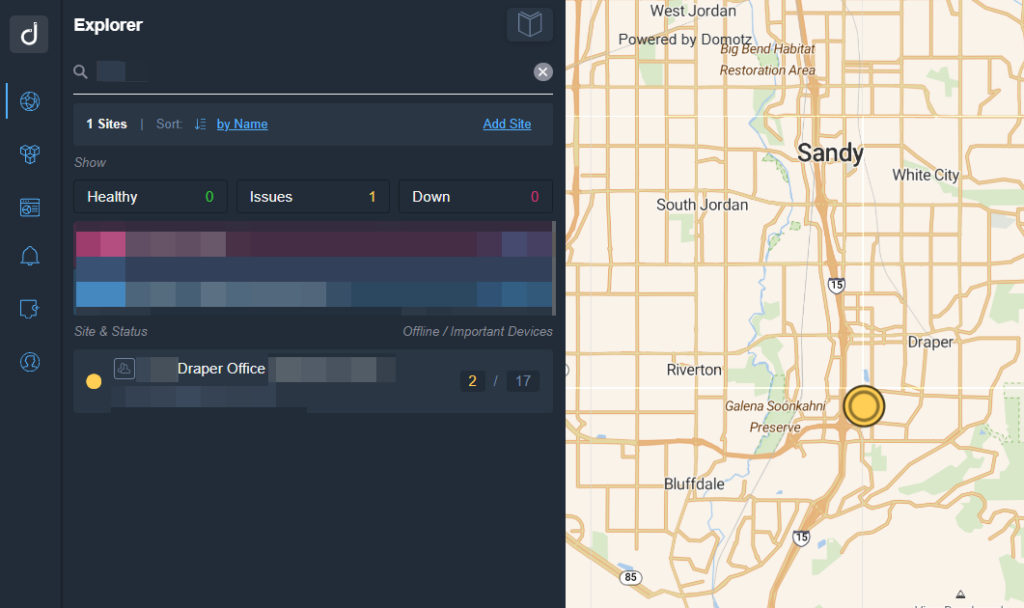
Network Monitoring Dashboard Overview
1. The dashboard displays monitoring information for different sites.
2. On the left panel, under "Explorer," it shows site status categories: "Healthy," "Issues," and "Down," with corresponding counts (0 healthy, 1 issue, 0 down).
3. Below the categories, specific sites like "Draper Office" are listed with their status indicators.
4. A yellow circle next to "Draper Office" indicates an issue.
5. On the right side, a map of the Sandy area is shown, highlighting the location with a marked point.
6. Use the map for geographical context and to identify where the site issues are occurring.
Unlock Devices
You may need to unlock a device to gather more information from a it. A device with a lock icon indicates that more data may be available. Unlock devices with a lock icon with the required credentials (SSH, HTTP, HTTPS, WinRM). This is necessary for firewalls, switches, and APs. Optional for servers, workstations, PDU/UPS, IP cameras, and others.
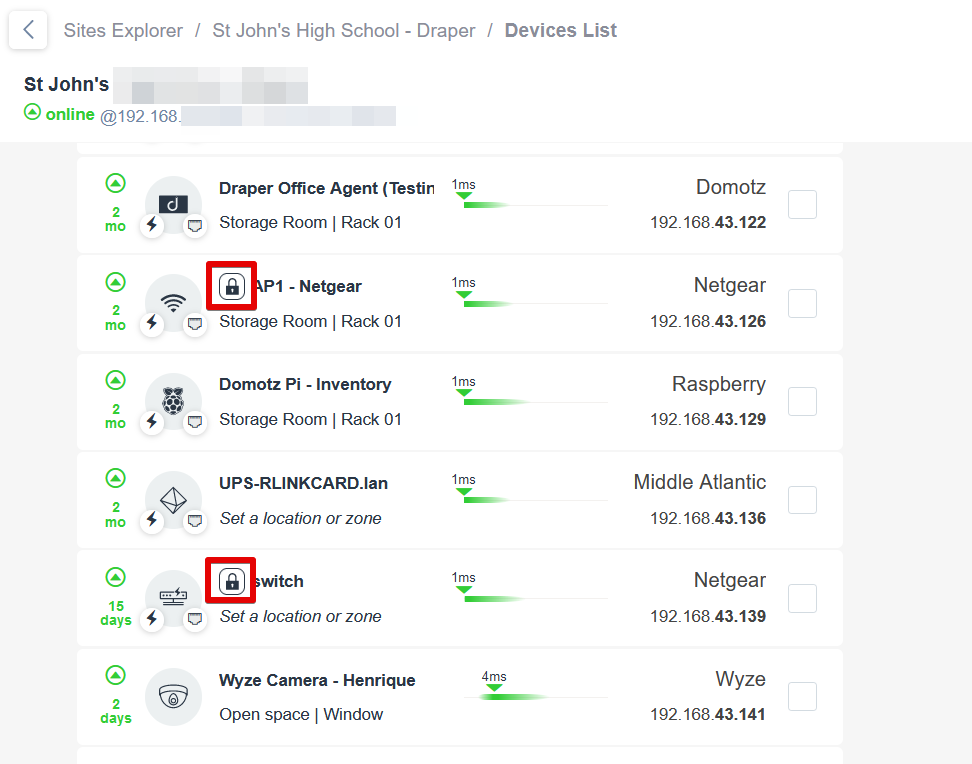
Devices List Overview with Lock Icons
1. The list displays various devices within the "St John's High School - Draper" network, indicating their current status.
2. Each entry includes the device name, location (such as "Storage Room | Rack 01"), and manufacturer.
3. The connectivity status is shown with a green online indicator, and a response time (e.g., "1ms").
4. IP addresses are provided for each device (e.g., "192.168.43.122").
5. Two devices, "AP1 - Netgear" and "Switch", display a lock icon, indicating restricted access or configuration protection.
6. Unlocked devices show additional details such as last seen time, ranging from days to months.
Unlock/Management can also be performed also from the Inventory dashboard by checking the “Insights” column:
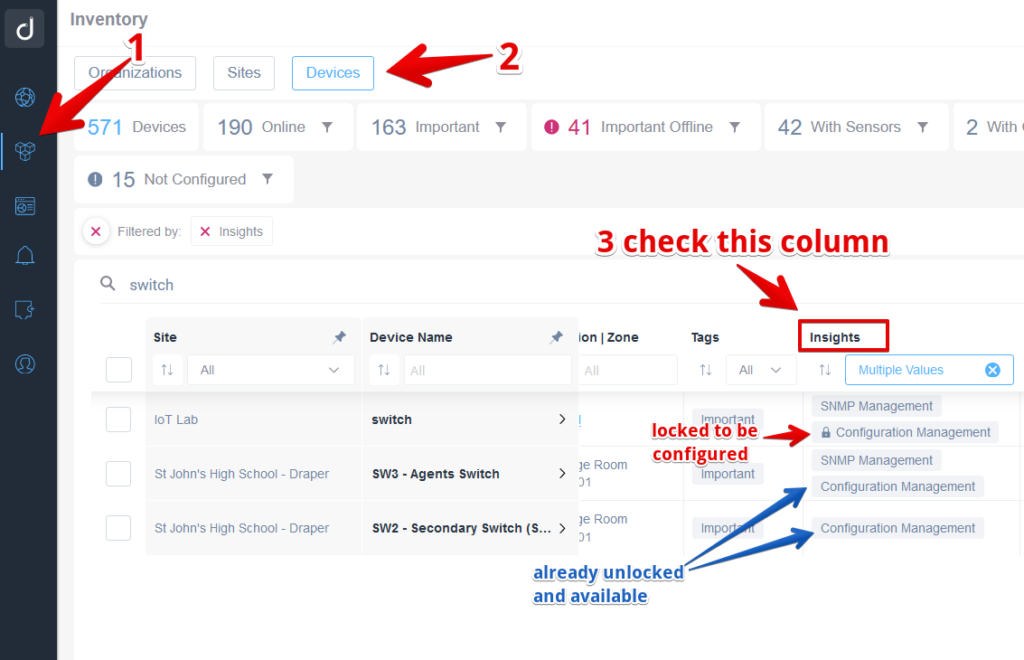
How to Access Device Insights in Inventory
1. Select "Devices" from the top menu to filter the inventory by devices.
2. Look at the "Devices" section to see statistics, including total devices, online devices, important devices, important offline devices, devices with sensors, and devices with other attributes.
3. Examine the "Insights" column in the device list. This column shows the status of each device in terms of management and configuration.
4. Look for entries labeled "Configuration Management" to find devices that need configuration.
5. Devices with "SNMP Management" are already configured and available.
Use this information to manage and configure the listed devices as required.
References:
Unlock Domotz OS Monitoring feature – Operating System Monitoring
Network Configuration Management – Domotz Help Center
SNMP
Enable the SNMP service on your switches, servers, and devices.
If you use standard community strings (public, private), Domotz will automatically start building your network topology:
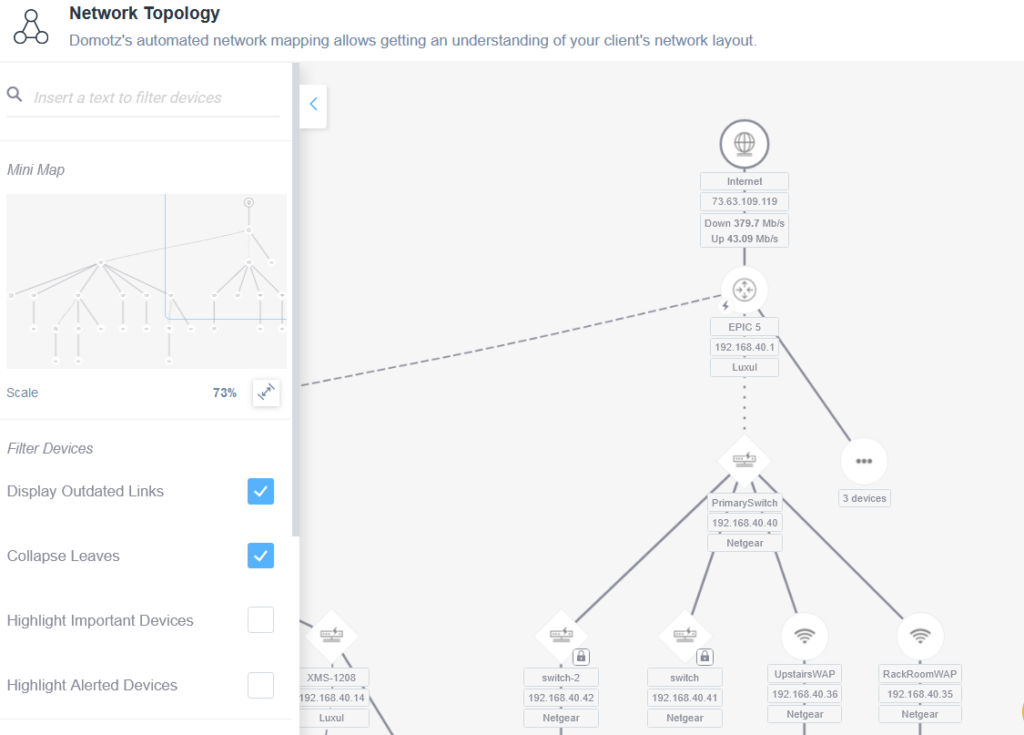
Network Topology Display in Domotz
1. The left panel contains options for filtering the network topology. Use the "Insert a text to filter devices" field to search for specific devices.
2. A mini map visualizes the network layout. Use the "Scale" option to adjust the view percentage.
3. Under "Filter Devices," there are checkboxes for "Display Outdated Links" and "Collapse Leaves," which are currently checked. Uncheck to hide outdated connections or expand all branches.
4. Additional options include "Highlight Important Devices" and "Highlight Alerted Devices," which are unchecked. Check these to emphasize key or flagged devices.
5. The right section shows a detailed network topology with nodes and connections. It starts with an "Internet" node, flowing to "EPIC 5" and branching out to "PrimarySwitch" and various connected devices including "switch-2," "switch," "UpstairsWAP," and "RackRoomWAP." Each device displays its IP address and manufacturer.
and start populating the “Insights” column in the “Inventory view”:
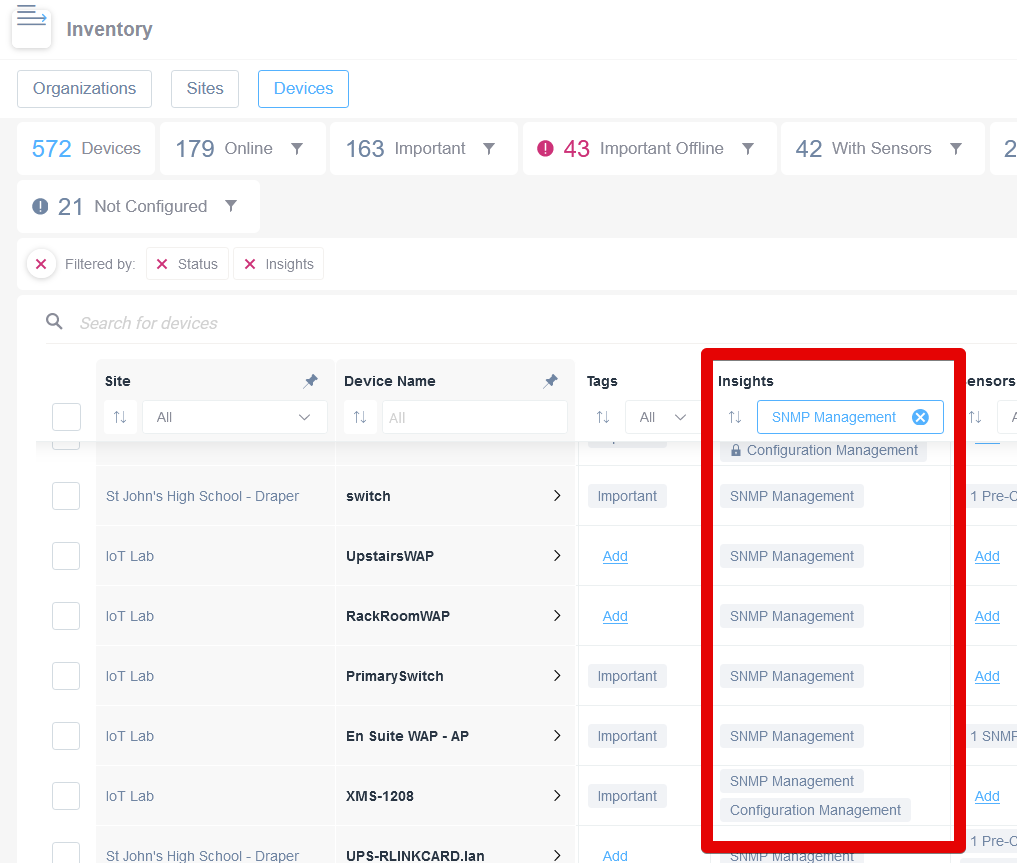
Device Inventory Filtering by Insights
1. Access the Inventory section and select the Devices tab to view devices.
2. Notice the header displaying summary information: 572 Devices, 179 Online, 163 Important, 43 Important Offline, 42 With Sensors, and 21 Not Configured.
3. Use the "Filtered by" section to apply filters. In this case, the filter for Insights is set to "SNMP Management."
4. Check the list of sites and device names displayed. Each site shows a corresponding device name.
5. Observe the Insights column, which includes tags like "SNMP Management" and "Configuration Management" to categorize devices based on their management insights.
Apply the insights filter to streamline device management tasks efficiently.
If you configured SNMP with custom SNMP credentials, check out this article instead: https://help.domotz.com/user-guide/how-to-set-custom-snmp-credentials-in-domotz/
A device will be “SNMP enabled” once you see the SNMP status set as READ:
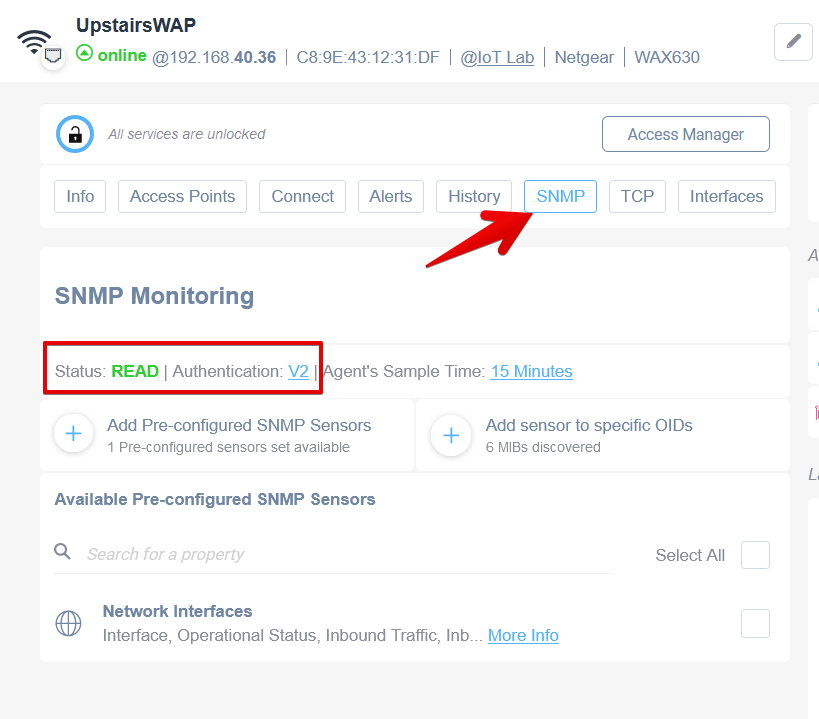
SNMP Monitoring Section in a Network Management Interface
1. Navigate to the SNMP tab in the network management interface to access SNMP monitoring settings.
2. The SNMP Monitoring section displays the current status, authentication, and sample time:
- Status: Indicates "READ," showing the SNMP service is operational.
- Authentication: Displays "V2," signifying the SNMP version in use.
- Agent's Sample Time: Set to "15 Minutes," determining the frequency of data sampling.
3. Options are available to add sensors:
- "Add Pre-configured SNMP Sensors" button lets you add pre-configured sensors. One set is available.
- "Add sensor to specific OIDs" button lets you add sensors to specific Object Identifiers. Six MIBs are discovered.
4. Available Pre-configured SNMP Sensors section is present, with a search functionality to find specific sensor properties.
Typically, network infrastructure devices (switches, firewalls, WAPs) are the only ones that require unlocking. Servers, workstations, and other devices only need to be unlocked if you want to extract additional information Domotz doesn’t automatically pull from the device.
You can add SNMP sensors to devices to get information Domotz does not automatically extract. Domotz will also provide pre-configured SNMP sensor templates to add to each device.
Please see our article on pre-configured sensors.
If you have multiple devices of the same type and you would like to monitor the same sensors, check out this article to see how to export/import them in bulk: https://help.domotz.com/user-guide/inventory/#htoc-export-import-device-settings-and-properties
References:
Setting up SNMP on Network Managed switches
How to set custom SNMP credentials in Domotz
Setting up Alerts
Navigate to Alerts Settings in the left sidebar. Click Connect Account next to any 3rd party tools you would like to integrate with (ticketing systems, PSA tools, messaging tools, etc.). Click Create a Shared Alert, select your contact channel, and select the events for which you would like to receive alerts. To apply the Shared Alert to your networks and devices, you can use the Inventory dashboard or select an Collector > Collector Settings > Apply the Shared Alert to your devices and the network.
Consider setting up alerts for your Domotz Collector as a great place to start for creating your first alert. Here is more information about this: https://help.domotz.com/user-guide/how-to-get-started-with-domotz/#htoc-setting-up-your-first-domotz-alert
After setting up your first alert for your Domotz Collector, you can create other shared alerting profiles to monitor your devices. To understand better the various alert event types and how to use them, please refer to this article: https://help.domotz.com/user-guide/shared-alerts-events-list-explained/
References:
Setting up your first Domotz Alert: monitor your Domotz Agent (and therefore your network)
Creating a Custom SNMP Alert – Create custom alerts for SNMP sensors
Shared Alert Events for Network Monitoring and Management
Monitoring Dashboards
Navigate to Monitoring Dashboards in the left sidebar. Here you can create dashboards and tables to monitor devices and sensors across all agents in one place.
References:
Custom Monitoring Dashboards and Monitoring Tables
Documentation Tools and Custom Integrations
Navigate to Integrations in the left sidebar. Here you can connect and learn more about the documentation tools Domotz has integrations with and how to connect the systems. This is also where you can use our Custom Integrations feature.
How to disable Important Device Classification
By default, Domotz will automatically classify devices as Important or not. You may not want newly discovered devices to be automatically classified, and you can disable this feature.
Visit Domotz Portal > Settings > Disable Automatic Important Device Classification. Domotz automatically classifies devices as important but may prefer to specify manually if devices should be tagged as important devices.
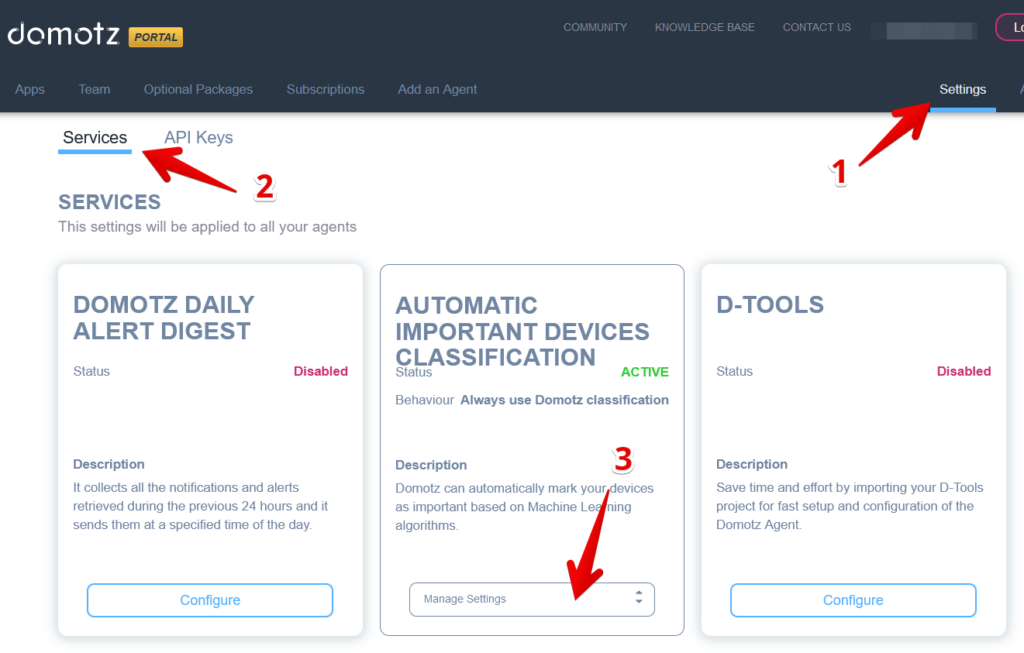
Accessing and Managing Services in Domotz
1. Go to the "Settings" tab located at the top right of the Domotz Portal interface.
2. Select "Services" from the options under the main navigation.
3. In the "Services" section, you can manage different services such as "Domotz Daily Alert Digest," "Automatic Important Devices Classification," and "D-Tools."
- Check the status of each service (e.g., Disabled, Active).
- Use the "Configure" button to set up or modify services.
- For "Automatic Important Devices Classification," adjust settings using the "Manage Settings" dropdown.
These steps help customize how services are applied to all your agents.
Move Agent from one Host to Another
Please visit the following page for more information: https://help.domotz.com/monitoring-management/move-domotz-to-new-hardware/