
We are thrilled to share the latest news, improvements, and updates about Domotz.
This month, we are rolling out new features, enhancements, SNMP templates, and integration scripts.
We’re also working on adding new information and details in the Collector Settings section. This month, you’ll see a significant improvement regarding the Documentation and Data Aggregation Platform.
We highly value your feedback and encourage you to contact our support team at support@domotz.com for any comments, questions, or suggestions you may have.
New Features
Added support to Secret Text/Password parameters on Integration Scripts
We have enhanced our Integration Scripts feature by supporting Secret Text/Password parameters. Previously, you could only use text, numbers, or lists for custom scripts.
Now, with this update, you can securely pass sensitive information as secret text, enhancing the flexibility and security of custom integrations. This new capability allows for more robust and secure script execution, ensuring sensitive data is handled appropriately within custom automation workflows.
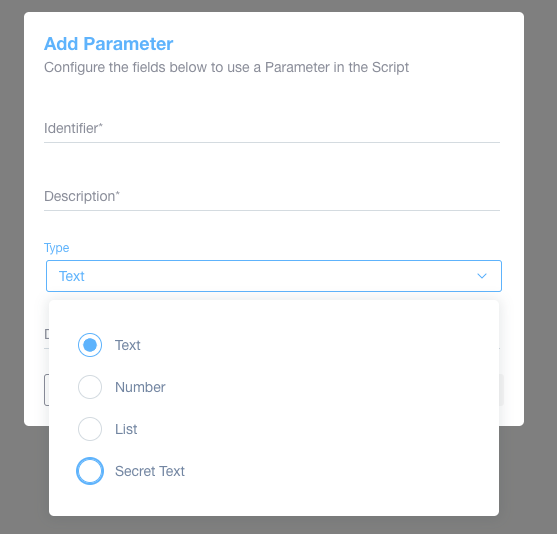
Adding a Parameter in a Script
1. Enter an identifier in the "Identifier" field, which is required.
2. Provide a description in the "Description" field, also required.
3. Choose a type from the "Type" dropdown menu. Options include "Text," "Number," "List," and "Secret Text."
4. After selecting the appropriate type, proceed with additional configurations as needed.
Enhanced Booster Packs available to increase capacity
Starting this month, we have introduced updates to our Booster Packs, which allow for enhanced monitoring capabilities.
You can now enable up to /16 subnet monitoring for attached networks and VLANs by adding up to 6 Booster Packs. Additionally, you can expand their plans by adding up to 20 units directly from the application. This update follows the release of the Collector Settings, providing more extensive monitoring of resources and ensuring greater network visibility and management efficiency.
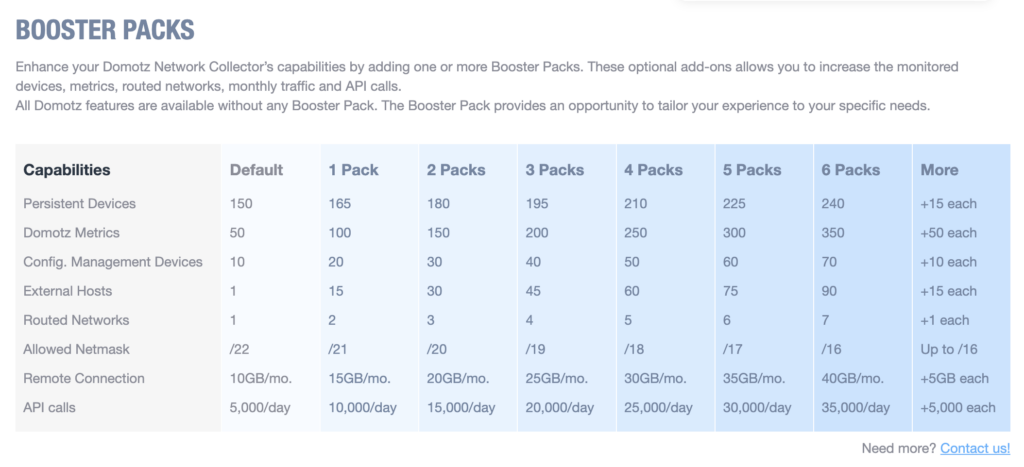
Booster Packs Overview for Domotz Network Collector
1. **Capabilities Increase**: Adding booster packs enhances your Domotz Network Collector by increasing various capabilities such as persistent devices, metrics, and routed networks.
2. **Default Capabilities**: Without booster packs, capabilities include 150 persistent devices, 50 Domotz metrics, and 1 external host. Remote connection is capped at 10GB per month, with 5,000 API calls per day.
3. **Incremental Increases**:
- **1 Pack**: Raises persistent devices to 165, Domotz metrics to 100, and remote connection to 15GB/month with 10,000 API calls/day.
- **2 Packs**: Boosts capabilities to 180 persistent devices, 150 metrics, and a remote connection limit of 20GB/month.
- **3 Packs**: Further increases allow for 195 persistent devices and API calls reach 20,000/day.
- **4 Packs**: Supports 210 persistent devices, with metrics at 250 and remote connection at 30GB/month.
- **5 Packs**: Allows for 225 persistent devices, 300 metrics, with 35GB/month for remote connection.
- **6 Packs**: Maximum increases to 240 persistent devices and 350 metrics, providing 40GB/month for remote connection.
4. **Additional Information**: Beyond six packs, each additional pack adds specific increments to capabilities such as +15 more persistent devices and +5GB/month remote connection. For expanded needs, a contact link is provided.
You can easily check limits and metrics on our booster pack dedicated page.
Display Network Collector Monitoring Mode on Sites Inventory Dashboard
Starting this month, you can instantly see the Network Collector Monitoring Mode in the Sites Inventory Dashboard.
This enhancement provides a clear view of each network collector’s monitoring mode. By making this information readily accessible in the Site section, Domotz ensures you can quickly identify and address any specific monitoring needs, thereby enhancing overall network visibility.
Improvements
Added Documentation & Data Aggregation Platform in the Collector Settings Section
We are extending the Collector Settings information that you can set up while configuring it.
This month, we’ve added the Documentation & Data Aggregation Platform section.

Collector Settings Overview and Monitoring Configuration
1. Basic Information: Shows the Collector Name as "Draper Office," with the location set to "Sofia, Europe." It includes contact info, organization name, and ID details such as "support@domotz.com" and "Domotz Draper."
2. Default Credentials: Displays SNMP Authentication details for user "support@domotz.com" with authentication marked as "xxxxxx."
3. Documentation and Data Aggregation Platform: Features "syncro" with an option to "Link Customer Account."
4. Monitoring Configuration:
- Monitoring Configuration indicates that manual device selection is required for management.
- Monitoring Networks lists "1 Attached Network" and "1 Routed Network."
- Additional Devices section allows for adding external hosts and logical devices with an "Add" option.
5. Licensing and Packaging: Highlights changes starting June 18th, offering information on obtaining booster packs and exclusive pricing through contact details like "sales@domotz.com."
6. Booster Packs: Details that monitoring limits can be increased with booster packs, indicating current limits with "Managed Devices" at 12 and "Metrics" at 285/50.
While configuring your Collector, you can view and manage the already configured integration and choose other available integrations that you may want to install.
Doing this operation is very easy and quick, especially now that you don’t have to leave this section!
Configure VLANs on Collector with proper subnet netmask
Domotz has enhanced its VLAN configuration capabilities on the Collector.
With the latest update, you can configure VLANs with larger subnet netmasks according to their Booster Pack configuration. This improvement allows for more flexible and precise network management, ensuring better organization and enhanced security through advanced VLAN setup directly on the Collector.
This enhancement has been released for Raspberry, QNAP, Ubuntu Core Public Network Collector, Ubuntu Core Boxes, Synology, and NETGEAR Network Collector.
FortiLink devices discovery does not require Routed Network configuration
Domotz has improved its FortiLink devices discovery process, which now no longer requires Routed Network configuration. This enhancement simplifies the setup and management of FortiLink devices, allowing for easier integration and discovery without the need for complex network routing configurations. This update ensures a more streamlined and efficient deployment process, providing you with a more straightforward way to manage your FortiLink devices.
This enhancement has been released for Raspberry, QNAP, Ubuntu Core Public Network Collector, Ubuntu Core Boxes, Synology, and NETGEAR Network Collector.
Add support for VPN on demand on NETGEAR Router
This new feature enhances network security and flexibility by allowing you to establish VPN connections automatically on NETGEAR routers, which is already possible on the other supported architectures.
Integration Scripts
Windows
If you need to monitor firewall rules on Windows machines, this script is the best solution.
By easily applying this script, you can extract the following information about the rules defined on the Windows firewall:
- ID
- Name
- Group
- Direction
- Action
- Enabled
This script uses WinRM protocol and has been validated and tested on Windows 10.
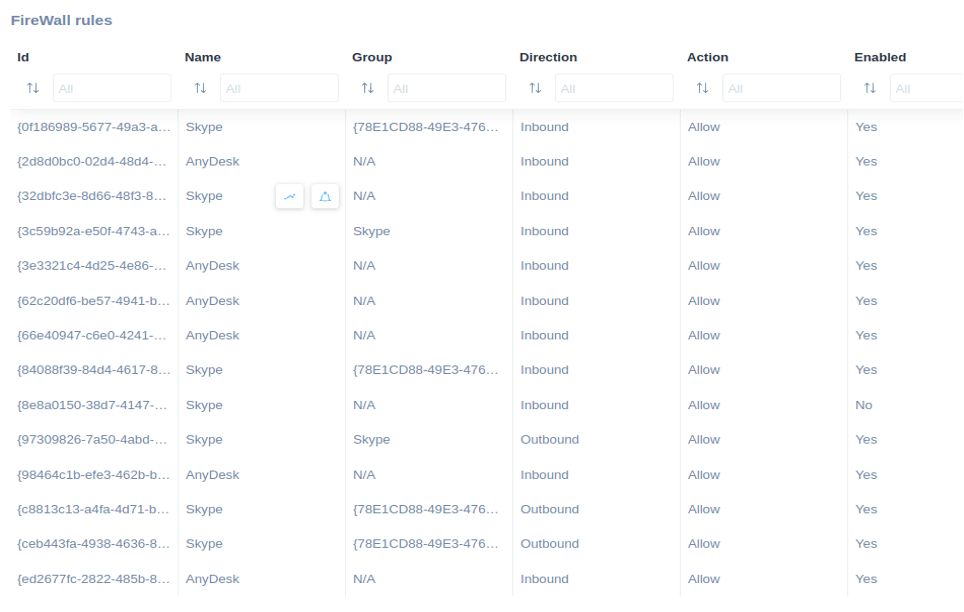
Firewall Rules Table Overview
1. The table lists firewall rules with columns for Id, Name, Group, Direction, Action, and Enabled status.
2. Each row represents a rule, showing unique identifiers under the Id column.
3. The Name column specifies the application, such as Skype or AnyDesk.
4. The Group column shows associated group IDs or "N/A" if not applicable.
5. The Direction column indicates whether traffic is Inbound or Outbound.
6. The Action column shows the rule's action, typically "Allow."
7. The Enabled column denotes if the rule is active, marked with "Yes" or "No."
Cisco Meraki
Simplify the monitoring of channel utilization for Cisco Meraki Access Point devices by using this script.
Monitor the following information by applying the script:
- Network
- Device
- Channel
- Channel Utilization
- Wi-Fi Utilization
- Non Wi-Fi Utilization
The script uses HTTPS protocol and has been validated and tested on Cisco Meraki Dashboard API v1.

Cisco Meraki Channel Utilization Report
1. The status of the channel utilization is marked as "Running." The sample period is set to 10 minutes. There are 3 parameters, and 6 metrics consumed.
2. Channel Utilization details are divided into two sections.
3. The top section lists the following columns: Id, Network, Device, and Channel. Two entries are shown:
- First entry: Id is "domotz_us-mr33-wifi0", Network is "domotz_US", Device is "MR33", and Channel is "wifi0."
- Second entry: Id is "domotz_us-mr33-wifi1", Network is "domotz_US", Device is "MR33", and Channel is "wifi1."
4. The bottom section presents percentage utilization metrics for three types: Channel Utilization, Wifi Utilization, and Non Wifi Utilization.
- First entry: Channel Utilization is 14.3%, Wifi Utilization is 5.6%, Non Wifi Utilization is 8.6%.
- Second entry: Channel Utilization is 3.7%, Wifi Utilization is 3.7%, Non Wifi Utilization is 0%.
5. A "Download CSV" link is available for exporting the data.
ONVIF
Use this script to monitor the Status of video streaming on an ONVIF Camera.
Easily applying this script, you’ll be able to monitor the following information:
- Video profile (ID)
- Streaming status
Please note that the script has been validated and tested on ONVIF camera LI-LIN LD2222.

Camera Streaming Status Dashboard
1. The ONVIF Camera status is displayed as "RUNNING" with a sample period of 5 Minutes.
2. Parameters count is 1, and metrics consumed is 0.
3. The "Video Streaming Status" section lists the IDs and streaming status.
4. Each ID, such as "1-rtsph2641080p," is shown with a streaming status of "OK."
5. A "Download CSV" option is available for obtaining the data in a CSV file.
Hyper-V
Use our custom scripts to improve your monitoring activity. Easily monitor Hyper-V virtualization products using our custom scripts:
- Virtual Machine Snapshots
- Virtual Machines
- Virtual Network Adapters
- Virtual Hard Disks
Hyper-v Virtual Machine Snapshots
Monitor Hyper-V Virtual Machines snapshots using our dedicated script. Get more insights into the latest snapshots of Virtual Machines.
It enables you to monitor the following details:
- VM ID (ID)
- VM name
- Snapshot Name
- Creation Time
- Age
The script has been validated and tested on Windows 10, Windows 2019, and Hyper-V 10.0.19041.1.

Monitoring Hyper-V VM Snapshots
1. The interface displays a list of snapshots taken on Hyper-V virtual machines.
2. The status of the monitoring process is indicated as "RUNNING."
3. Details include the sample period of 5 minutes, 1 parameter, and 4 metrics consumed.
4. The table contains columns with headers: Id, VM name, Snapshot name, Creation time, and Age.
5. Each row in the table provides information about specific snapshots, including their IDs, corresponding VM names, snapshot names, creation times, and ages since creation.
6. Filtering options are available for each column, allowing sorting and filtering by Id, VM name, Snapshot name, Creation time, and Age.
Hyper-v Virtual Machines
Monitor all the Hyper-V virtual machines with our script. You’ll get access to the following information:
- Name
- State
- OS Name
- OS Version
- Memory Size (MB)
- CPU Usage (%)
- Creation Time
- Processors
- Uptime
- Status
The script has been validated and tested on Windows 10 and Windows Server 2019.

View and Monitor Virtual Machines in Windows Hyper-V
1. The interface displays the status of the monitoring system as "RUNNING" with a sample period of 5 minutes and a metrics consumed count of 10.
2. A table lists details of virtual machines under "Virtual machines" with columns for Id, Name, State, OS Name, OS Version, Memory, CPU Usage, Creation Time, Processors, Uptime, and Status.
3. The first entry shows a VM with Id starting with "8f65dfaa" running Windows 10 in an "Off" state. OS Name and Memory show "None", CPU Usage is 0%, and Status is "Operating normally".
4. The second entry for a VM with Id starting with "d35e6474" displays "Running" under State, using Windows 11, with OS Version "10.0.22621". Memory is 2976 MB, CPU Usage at 15%, and Uptime shows as 0 days, 3 hours, and 55 minutes. Status is "Operating normally".
5. Each column allows sorting, as indicated by the sorting icons.
Hyper-v Virtual Network Adapters
Use our script to monitor Hyper-V Virtual network adapters. You’ll be able to access the following information:
- Name
- Switch Name
- Pool
- Cluster Monitored
- Connected
- Bandwidth Percentage
- Deleted
The script has been validated and tested on Windows 10 and Windows Server 2019.

Hyper-V Virtual Network Adapters Dashboard Overview
1. The title "hyper-v virtual network adapters" is displayed at the top.
2. The status section indicates "RUNNING" and provides a sample period of "5 Minutes" along with "Parameters: 1" and "Metrics Consumed: 7".
3. Below, the "Virtual network adapters" section contains a table with columns: Id, Name, Switch Name, Pool, Cluster Monitored, Connected, Bandwidth Percent, and Deleted.
4. The table lists three adapters with respective details:
- First adapter: ID "08f11d67-8853-41d9-...", Name "Network Adapter", Switch Name "ubuntu 20", Pool "N/A", Cluster Monitored "Yes", Connected "Yes", Bandwidth "0", Deleted "No".
- Second adapter: ID "40be1121-df4a-40f4-...", Switch Name "Default Switch", other columns similar to first adapter.
- Third adapter: ID "e4e7c62c-a489-4bca-...", Name "Network Adapter", Switch Name "ubuntu 20", similar to the first with "Yes" for Cluster Monitored and Connected.
5. A link labeled "Download CSV" is available for exporting this data.
Hyper-v Virtual Hard Disks
Access detailed data using our custom script. Monitor the following:
- Name
- Pool Name
- Path
- Attached
- Capacity (GB)
- Controller Number
- Location Number
- Disk Number
- Deleted
The script has been validated and tested on Windows 10 and Windows Server 2019.

Overview of Virtual Hard Drives in Hyper-V
1. The title indicates a focus on managing virtual hard drives within Hyper-V.
2. The status shows "RUNNING," indicating the process is active. The sample period is set to five minutes, with one parameter and nine metrics consumed.
3. A table lists virtual hard drives with columns: Id, Name, Pool, Path, Attach, Capacity, Controller Number, Location Number, Disk, and Deleted.
4. The table contains three entries, each representing a hard drive with unique details like Id, Name (e.g., Hard Drive on SCSI controller), Pool (all marked "Primordial"), and differing paths, capacities (e.g., 200 GB, 127 GB), and locations.
5. Options for downloading the data in CSV format is available on the right.
SonicWall Firewall
You might use this script to monitor the SonicWall firewall product lifecycle and check when a product is approaching the end of support.
You will able to monitor the following:
- ID
- Last Order Day (LOD)
- Active Retirement (ARM)
- One-Year Support Last Order Day
- Limited Retirement Mode (LRM)
- End of Support (EOS)
- Last Order Day (LOD) – Remaining Days
- Active Retirement (ARM) – Remaining Days
- One-Year Support Last Order Day – Remaining Days
- Limited Retirement Mode (LRM) – Remaining Days
- End of Support (EOS) – Remaining Days
The script uses HTTPS protocol and has been validated and tested on SonicWall NSv 270 SonicOS version 7.0.1-5145.

Sonicwall Firewall Product Lifecycle Overview
1. The status of the Sonicwall firewall is "RUNNING."
2. Sample period is shown as 5 minutes, with metrics consumed at 10.
3. A "Download CSV" option is available for exporting data.
4. Variables table includes:
- "End of Support (EOS) - Remaining Days" with 673 days remaining.
- "Last Order Day (LOD)" set for 2022-04-15.
- "Last Order Day (LOD) - Remaining Days" shows 0 days.
- "Limited Retirement Mode (LRM)" scheduled for 2024-04-16.
- "Limited Retirement Mode (LRM) - Remaining Days" with 0 days.
- "One-Year Support Last Order Day" is set for 2025-04-15.
- "One-Year Support Last Order Day - Remaining Days" has 307 days remaining.
5. The "Last change" column indicates all entries were updated 2 minutes ago.
New MIBs
- Add Extreme EXOS MIBs
- Add Checkpoint Devices MIBs
Fixes
- Improve Network Topology fixing some displayed not existing links
- Correct the label when external hosts are not monitored due to exceeded limit
- Fix the issue on the Network Troubleshooting dashboard showing DHCP Requests at 0%
- Fix issue that was automatically re-enabling Configuration Management overnight when it was manually disabled
- Fix unlock issue with Ubiquiti SSH credentials
- Fix an issue that was preventing the Device Types list in the edit modal from appearing in some edge cases
Fixes on Windows Network Collector
- Support newer SSH key exchange algorithms in order to fix device integrations (FortiGate/FortiNet/Watchguard and other brands)
- Fix issue with Network Interfaces traffic not being properly monitored