
To kick off June, here are all the latest features and improvements we’ve added to Domotz:
- We’ve added a new landing page for quick navigation as part of our interface refresh
- Network Configuration Management features are now available for MikroTik firewalls, routers, and switches
- Manual IP scan: Scan and monitor your own list of IP addresses which is very useful for those of you that do not want to scan an entire network
- Export your Network Topology Map data from our Public API
- Automatically close tickets from TCP Port status events
- New logging on Custom Integration executions
- New information for Dell iDrac and HP iLO devices
- Additional MIBs
What’s new
New Landing Page and Dashboard for Quick Navigation
When you log in to Domotz you’ll land on a new “Manage” dashboard which lets you quickly navigate across multiple sites and devices. The new Manage section is the heart of your Domotz experience!
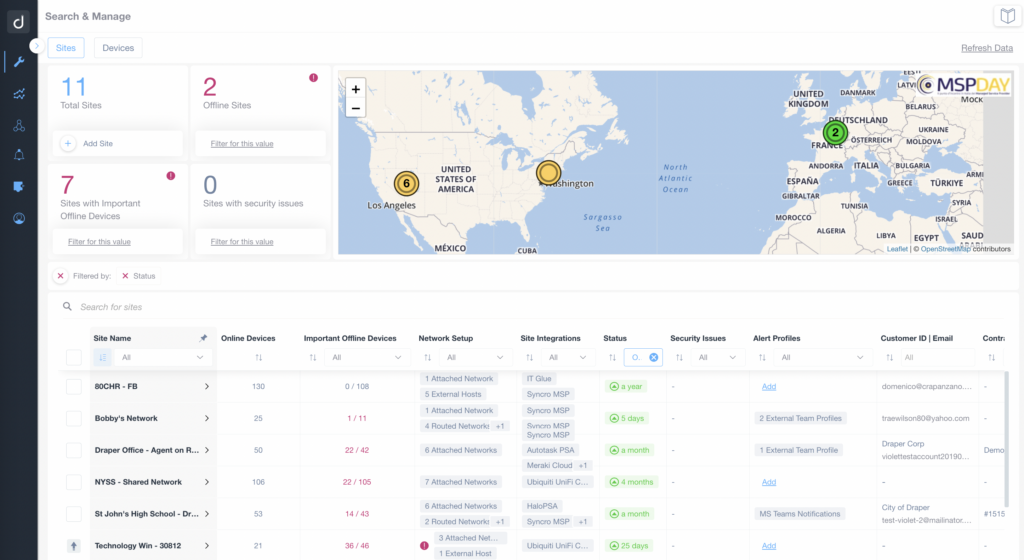
Dashboard Overview for Site and Device Management
1. The left panel displays site statistics: 11 total sites, 2 offline sites, and 7 sites with important offline devices. Each statistic has a "Filter for this value" option.
2. A world map indicates site locations, with marked areas around Los Angeles, Washington, and a European region.
3. Below the map, a table lists site details including:
- Site Name
- Online and Important Offline Devices with respective counts.
- Network Setup details.
- Site Integrations and Status, with indicators for conditions such as "0" or "a year."
- Security Issues and Alert Profiles, with options to "Add."
- Customer ID, Email, and Controls for more actions.
4. Above the table, options are available to refresh data or filter by status.
Furthermore, in this section, you’ll find your site map, be able to perform key actions, and see your dashboards as well as your KPIs. Moreover, this new dashboard allows you to quickly search across thousands of sites and hundreds of thousands of devices. Additionally, you can quickly filter a site for important devices offline, security issues, and more.
We’ve also added network setup information to your Sites including VLANs and attached networks, routed subnets/networks, as well as external hosts.
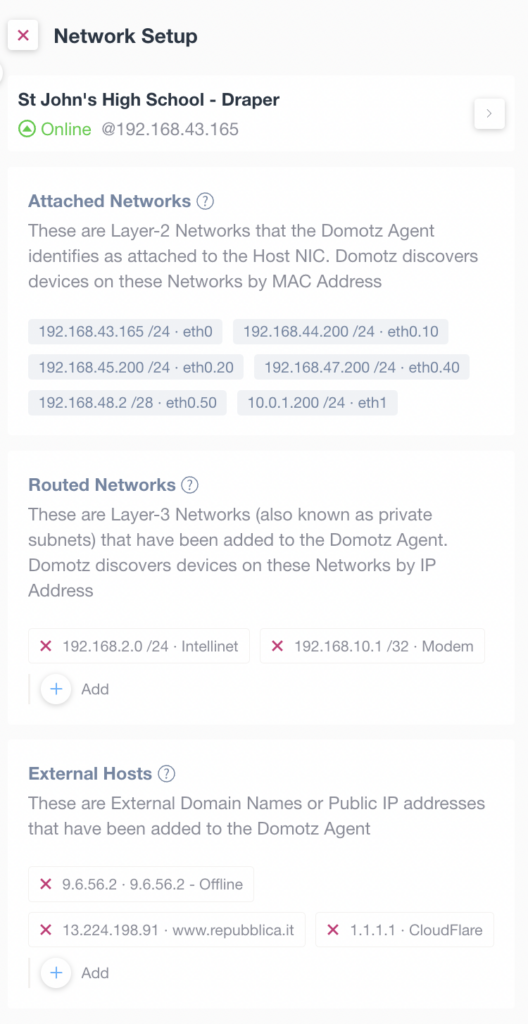
Network Setup Interface
1. The setup is for "St John's High School - Draper" with a status of "Online" at the IP address 192.168.43.165.
2. "Attached Networks" section lists Layer-2 networks detected by the Domotz Agent via MAC address, including:
- 192.168.43.165/24 on eth0
- 192.168.44.200/24 on eth0.10
- 192.168.45.200/24 on eth0.20
- 192.168.47.200/24 on eth0.40
- 192.168.48.2/28 on eth0.50
- 10.0.1.200/24 on eth1
3. "Routed Networks" section shows Layer-3 networks (private subnets) recognized by IP address, including:
- 192.168.2.0/24 labeled as Intellinet
- 192.168.10.1/32 labeled as Modem
- Option to add more networks with an "Add" button.
4. "External Hosts" section includes external domain names or public IPs added to the Domotz Agent:
- 9.6.56.2 labeled as Offline
- 13.224.198.91 associated with www.repubblica.it
- 1.1.1.1 labeled CloudFlare
- Option to add more hosts with an "Add" button.
In the device section on Manage, we’ve added more information that allows you to quickly search for devices with specific configurations or issues. From here you can quickly access multiple functionalities and do many things such as:
- Perform direct remote connections to your preferred services
- Check and execute Round Trip Delay performance tests
- Control the power of a device
- Configure alerts on multiple devices
- Review SNMP, TCP, and other configured sensors (including Custom Drivers and OS Monitoring sensors)
- So much more!
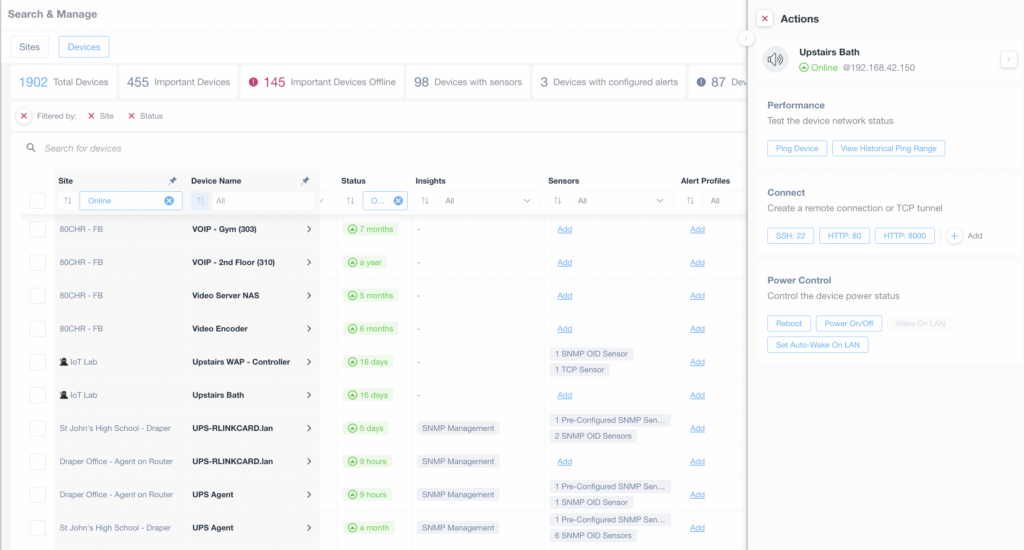
Device Management Interface Overview
1. Navigate to the "Devices" tab to view device details, including total, important, and offline devices.
2. Use the search bar to find specific devices by site or name.
3. The main table displays device information: Site, Device Name, Status, Insights, Sensors, and Alert Profiles.
4. The right sidebar shows detailed actions for a selected device called "Upstairs Bath."
5. Check the device's online status and IP address at the top.
6. Under "Performance," test network status with "Ping Device" or view the history with "View Historical Ping Range."
7. Use "Connect" options to create remote connections or TCP tunnels, with available ports such as SSH: 22 and HTTP: 80.
8. Under "Power Control," manage power status with options to reboot, power on/off, or set "Auto-Wake On LAN."
Manual IP Scan: Scan and Monitor a list of IP Addresses you define
We’ve added a new Manual IP scan. This capability is very important when you only want to scan and monitor a subset of IP addresses on a network. You can now scan and monitor your IP addresses with ease, without affecting the rest of the network.
Configure your Domotz Agent so that it only scans for a defined list of IP addresses across a network and the networks you’ve attached to it.
To configure the Manual IP scan you must start the Domotz Agent with the discovery disabled on all interfaces (via Command-Line). For more information about how to Disable Network Scanning, please visit the following help article: Activation with Network Scanning Disabled
Once the Agent has been activated with Network Scanning disabled, you will be able to define, via our Public API the list of IP addresses that you want to scan and monitor. Learn more in the following help article: Define Agent IP Address scan Policy
The Agent will now start scanning and monitoring only the IP addresses you’ve defined within the Policy. It will not scan the rest of the network.
Network Configuration Management added for MikroTik
Our network configuration management features are now available on MikroTik (RouterOS devices) to help you stay on top of crucial changes happening in your network infrastructure.
You can now automatically backup the running configuration files of your Mikrotik devices. Additionally, Domotz will keep track of the configuration changes over time and notify you if any change occurs to help you easily identify network configuration issues.
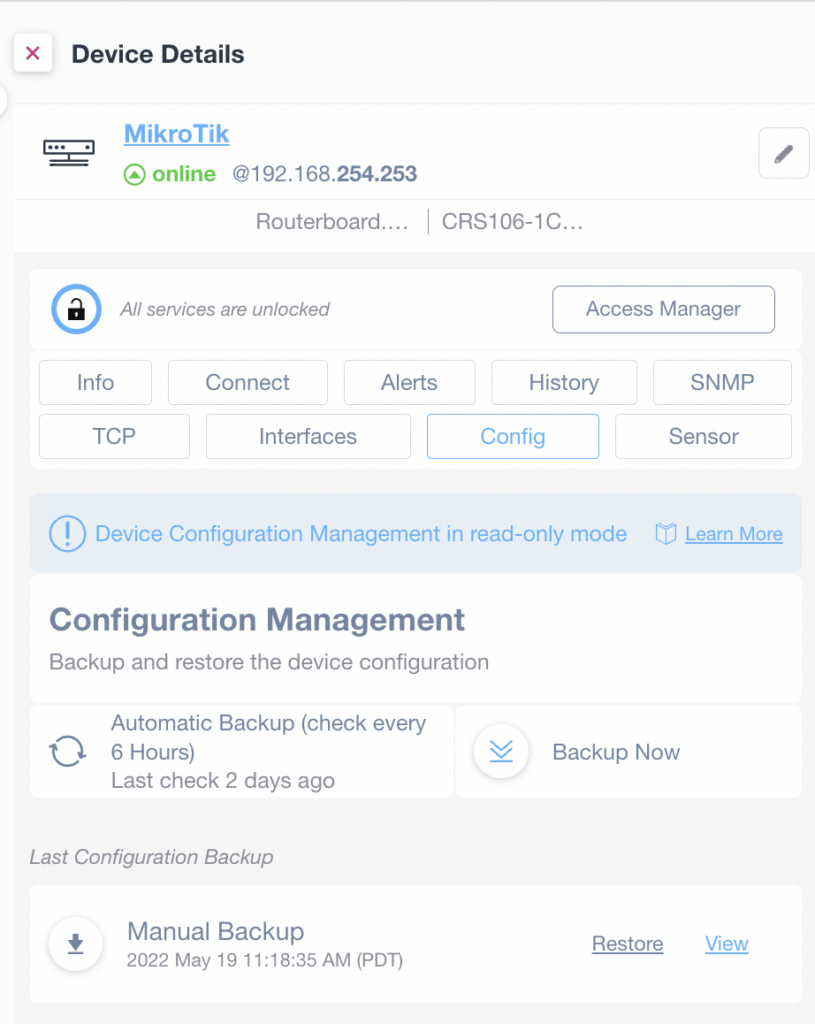
Device Details and Configuration Management Overview
1. The panel displays details for a device named "MikroTik" with IP address 192.168.254.253, which is online.
2. The services are unlocked, and several tabs are available: Info, Connect, Alerts, History, SNMP, TCP, Interfaces, Config, and Sensor.
3. A section for Configuration Management allows backup and restoration of device configurations.
4. There is an automatic backup option, set to check every 6 hours, with the last check 2 days ago.
5. For immediate backup, a "Backup Now" button can be used.
6. The last configuration backup was a Manual Backup on May 19, 2022, at 11:18:35 AM (PDT), with options to restore or view.
Improvements
Ticketing System Integration: TCP Events with auto-close
You can now configure the Domotz integrations with your PSA and Ticketing systems so that the software opens and automatically closes tickets based on TCP monitoring events (related to checking the status of TCP ports).
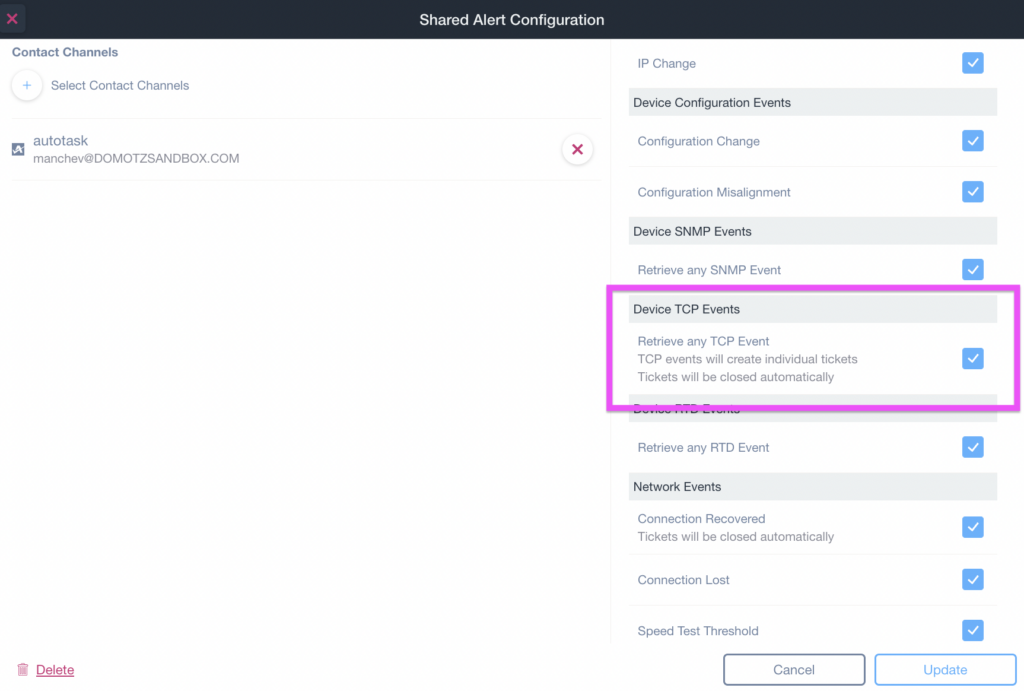
Shared Alert Configuration Settings
1. Navigate to the “Shared Alert Configuration” section.
2. Under “Contact Channels,” ensure the preferred method is selected, such as “autotask” with the associated email manchev@DOMOTZSANDBOX.COM.
3. In the list of alert events on the right, locate “Device TCP Events.”
4. Ensure the option “Retrieve any TCP Event” is checked. This setting will create individual tickets for TCP events, and tickets will be closed automatically.
5. Confirm your changes by clicking the “Update” button at the bottom right.
6. To discard changes, click “Cancel.”
7. To remove the configuration, use the “Delete” option at the bottom left.
By checking the Device TCP Events box, you can configure the Domotz integration with your PSA / Ticketing system to create a new Ticket for each TCP Port it discovers as “not-available” (closed). Furthermore, Domotz will automatically close the Ticket as soon as it discovers the TCP Port is “available” (open).
Extract Network Map Topology definition from Public API
It is now possible to extract a list of nodes and connections directly from the Public API:
You can use and change the information from the API, to create your own customized Network Topology map using the tool of your choice. For example, the following is a dynamic rendering of a network’s topology using the data extracted from Domotz:
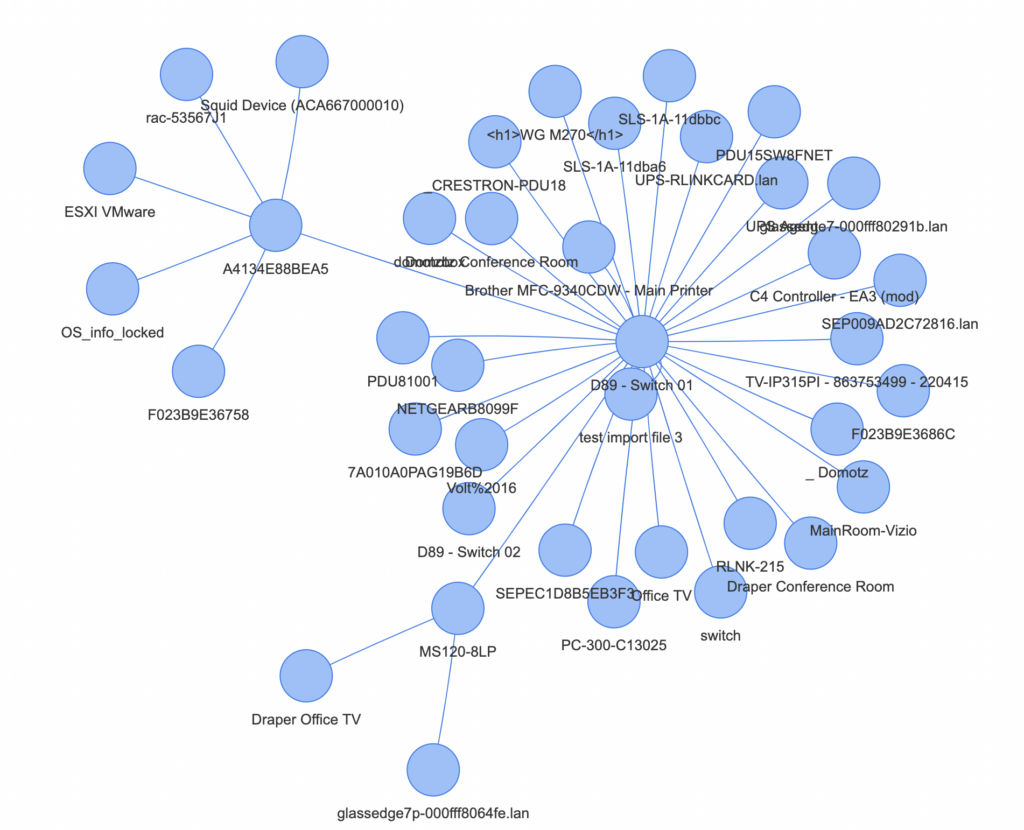
Network Map Overview
1. The central node "A4134E88BEA5" connects to various devices, including "Squid Device," "ESXI VMware," and "OS_info_locked," showing a cluster of ancillary systems.
2. Another central node "D89 - Switch 01" links to multiple devices such as "Main Printer," "Draper Conference Room," and "TV-IP315PI," indicating the switch’s role in managing connections to different network components.
3. Additional connections from "D89 - Switch 02" display linked devices like "PC-300-C13025" and "Office TV."
4. Each line represents a direct network link between nodes, illustrating the interconnectivity and relationships within the network.
Enabled Pagination on Autotask PSA list of Accounts
When mapping Domotz Agents to your Autotask PSA account, we can now retrieve a very long list of PSA Accounts:
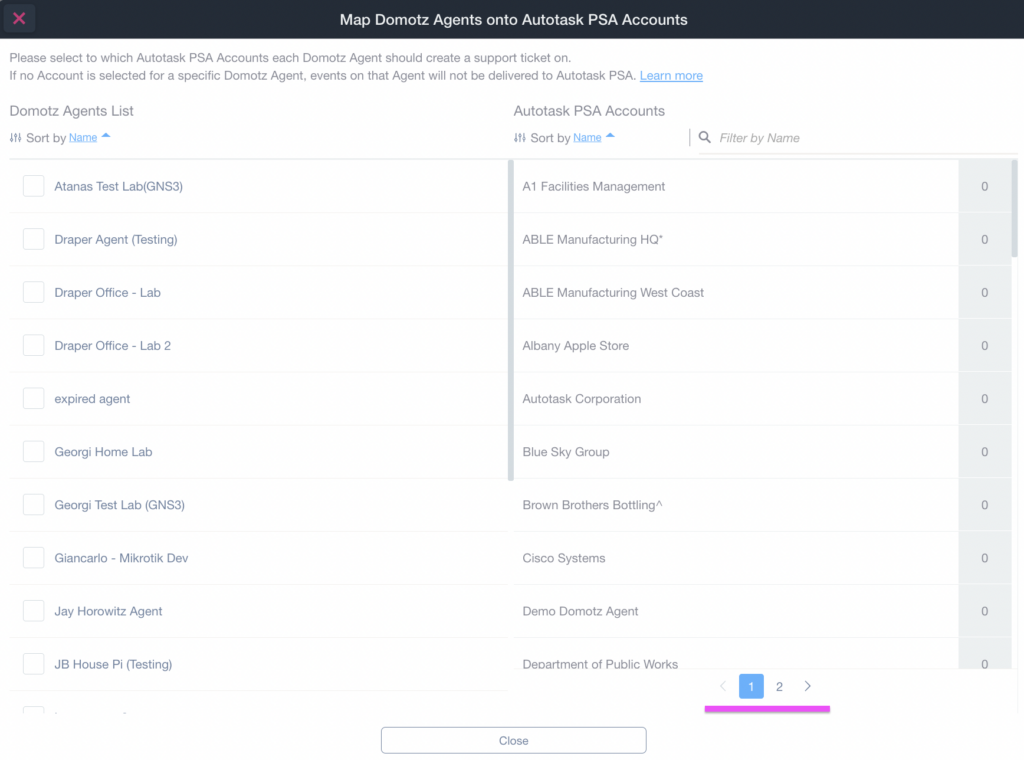
Mapping Domotz Agents to Autotask PSA Accounts
1. Select a Domotz Agent from the left column labeled "Domotz Agents List."
2. Choose an Autotask PSA Account from the right column labeled "Autotask PSA Accounts."
3. Use the "Name" sort option at the top of each list to find entries more easily.
4. Navigate between pages of accounts using the page numbers at the bottom right.
5. Click "Close" at the bottom to finalize your selections.
What’s more, is that you can now map Domotz to Autotask PSA even if there are tens of thousands of Accounts on your list. You can complete the account mapping by searching for the Account name, or by scrolling down the list across multiple pages.
Custom Integration: logging while testing drivers
We’ve added more detailed logging when running a Custom Integration against a device for development and testing purposes.
When a custom driver function is executed on a device from the Editor page, you are now able to see the following:
- the execution outcome (success or failure)
- the resulting variables (if any, in case of success)
- the execution error message reported by the Domotz Agent and the Domotz Cloud (in case of failure)
- The execution logs with the log level (Debug, Info, Warning, Error) for each log
Dell iDrac and HP iLO data
In the OS Monitoring functionality, Domotz now extracts and reports in device details additional parameters for the following two devices:
- Dell iDrac
- HP iLO
You can leverage this functionality to identify the following information:
- Physical Memory
- Physical Disks
- Logical Disks
- System CPU status (Temperature, Cache, Voltage, etc)
- System Board status (Fan, Voltage, Temperature, GPU)
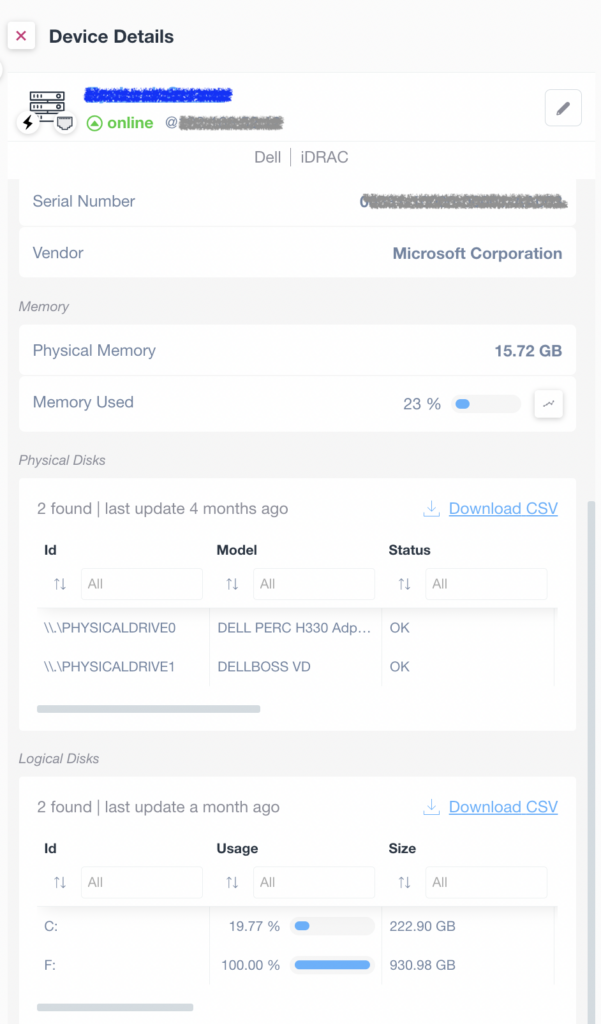
Device Details Overview
1. Device Status: Shows the device label and status as "online."
2. Manufacturer Information: Displays "Dell" and "iDRAC" as the device type and "Microsoft Corporation" as the vendor.
3. Serial Number: The serial number is provided but obscured for privacy.
4. Memory Details:
- Physical Memory is listed as 15.72 GB.
- Memory Used indicates 23%.
5. Physical Disks:
- Two physical drives are listed with IDs, models, and status. Both drives are marked as "OK."
- A download link for a CSV file of the details is available.
6. Logical Disks:
- Two logical disks are shown with ID, usage percentage, and size.
- Usage examples: Drive C is at 19.77% usage with a size of 222.90 GB; Drive F is fully used at 100% with a size of 930.98 GB.
- A link is provided to download the information as a CSV file.
Additional MIBs available in the Domotz Database
Additional MIB files are available for the following devices. Additionally, you can search for their OiDs from Domotz:
- NetAgent UPS modules
- Legrand/Middle Atlantic UPS
- Powersoft AV
- Draytek Vigor Router
- Voltronic/Powershield UPS
Fix
We’ve fixed the following issues:
- Firstly, the Agent was reporting unexpected DHCP servers changes, causing false-positive Alerts
- Agent was performing ONVIF broadcast discovery even if “discovery” was disabled from Domotz App/WebApp
- Agent is now capable of reading 64-bit variables through SNMP
- The issue causing the Middle Atlantic Power Cycle through Domotz overriding PDU cycle time setting has been fixed
- WAN IP Address – when the agent failed to check the WAN IP address, it removed the previous IP address discovered
- Upgraded version for Cisco Meraki API (from v0 to v1)
Known limitations
- Firstly, monitoring Dashboards are currently limited to Monitoring Tables as Widgets. Furthermore, they do not report some variables (e.g. the ones created by the Custom Drivers) within the Monitoring Tables.
- Firstly, Luxul Router-based Agents do not support VPN on demand. To elaborate, we’ll add this capability as soon as Luxul’s team provides us with the required API resources.
- Devices with multiple network interfaces (multiple MAC addresses) can’t be merged into a single device. This affects some types of switches that appear as multiple instances on Domotz when VLANs are configured.
- The static IP address on the Domotz Box cannot be configured before configuring the Agent.
- HCP cannot be leveraged on additional VLANs on the Domotz Box.
To conclude, these release notes cover what’s changed in the Domotz Pro service since the previous Release Notes. Furthermore, these changes include Domotz Pro cloud, Domotz Agent, and Domotz Pro App.
All in all, to learn more, check out our network monitoring software or check out our Know Your Networks Blog.