

Here are the latest features we’ve added to Domotz. Domotz now extracts Operating System information for Windows, macOS and Linux machines. We have introduced the Booster Pack to extend the capabilities offered by the Domotz Agent. SNMP Status and enumerated values are now available. EVO Security can now be used for SSO. Device Uptime is now available within reports. IT Glue links directly from a Device. We’ve also released Configuration Management features for HPE / Aruba networked devices.
What’s new
Operating System Monitoring
Now you can monitor the Operating System information of your Windows, macOS and Linux servers, desktops and laptops:
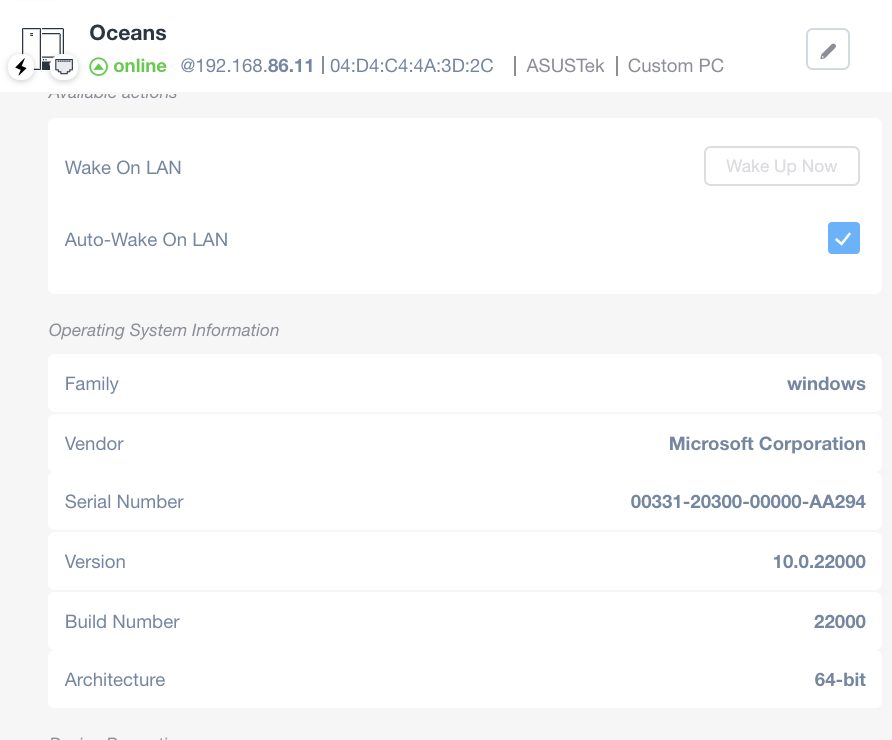
Device Configuration and Operating System Information
1. The device, named "Oceans," is currently online with IP address 192.168.86.11 and a MAC address of 04:D4:C4:4A:3D:2C. It is identified as a custom PC by ASUS Tek.
2. Available actions include "Wake On LAN" and "Auto-Wake On LAN," with the latter option checked.
3. The operating system information lists the following details:
- Family: Windows
- Vendor: Microsoft Corporation
- Serial Number: 00331-20300-00000-AA294
- Version: 10.0.22000
- Build Number: 22000
- Architecture: 64-bit
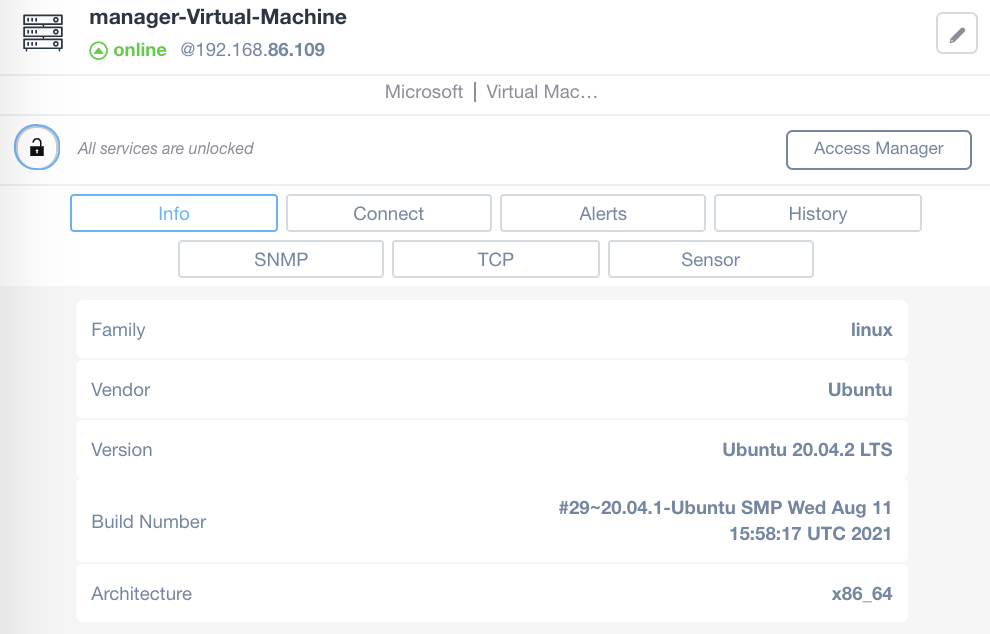
Virtual Machine Info and Status Summary
1. The virtual machine, named "manager-Virtual-Machine," is currently online with the IP address 192.168.86.109.
2. It is indicated that all services are unlocked.
3. There is a button to "Access Manager" for more options.
4. Tabs available for selection include Info, Connect, Alerts, and History. Additional sections include SNMP, TCP, and Sensor.
5. Under the Info tab, details such as Family, Vendor, Version, Build Number, and Architecture are provided.
- Family: linux
- Vendor: Ubuntu
- Version: Ubuntu 20.04.2 LTS
- Build Number: #29~20.04.1-Ubuntu SMP Wed Aug 11 15:58:17 UTC 2021
- Architecture: x86_64
Information about the Operating System like Family, Vendor, Serial and Build Number, Architecture are now extracted from Servers, Desktops, Laptops and Virtual Machines. This feature relies on either SSH or WinRM protocols which can be enabled on your machines. It does not require administrative accounts on the remote machines.
For more information, visit OS Monitoring feature.
Booster Pack
We’ve added Booster Packs, to extend the capabilities of your Domotz Agent.
Domotz Booster Pack gives you more power to serve larger networks through a single Domotz Agent. On top of the capabilities available on any Domotz Agent, the Booster Pack adds the following features:
+1200 Domotz SNMP sensors
+10GB/month Traffic on Remote Connections
+10 External IP Hosts
+4 Subnets
+10,000/day API calls
For more information, visit Booster Pack.
Improvements
SNMP Monitoring: status Discovery
When configuring SNMP credentials on specific Devices, it is now possible to monitor the status of the service directly from the Device Details view. The following statuses are available when adding SNMP monitoring to a device so you can troubleshoot issues faster:
- Checking
- Reading
- Service Not Found
- Unable to read from SNMP service

For more information, visit SNMP status.
SAML 2.0 / SSO – Support for EVO Security
It is now possible to connect EVO Security as an external SAML 2.0/SSO Authentication mechanism to a Domotz account so that your entire team’s authentication can be managed through a centralized platform.

For more information, visit SAML/SSO Authentication – EVO Security.
Agent Collaboration on Company Reports
Users configured as part of the Company structure can now retrieve the list of all Agents configured under the structure, including details about agents that have been shared with internal or external teams.
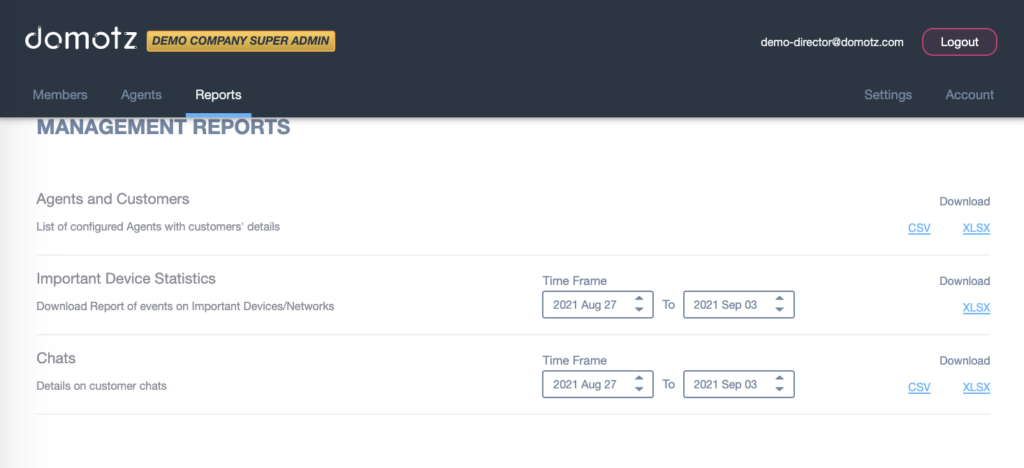
Management Reports Page Overview
1. Navigate to the "Reports" tab in the navigation bar.
2. Under "Management Reports," you will find three sections: "Agents and Customers," "Important Device Statistics," and "Chats."
3. "Agents and Customers" provides a list of configured agents with customer details. Download options are available in CSV or XLSX formats.
4. "Important Device Statistics" allows downloading a report on important devices and networks. Set the "Time Frame" using the date fields and download in XLSX format.
5. "Chats" includes details on customer chats. Set the desired "Time Frame" using the date selections and download in CSV or XLSX formats.
6. Use the "Logout" button for signing out, available on the top right corner alongside account settings.
Team Management within Company structure
Users configured as part of the Company structure can now create additional Teams within the structure directly from the Portal:
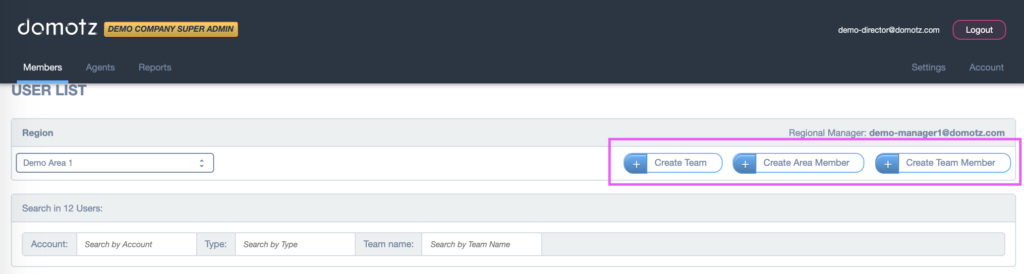
User Management Interface in Demotz Platform
1. At the top of the page, the header displays the user logged in as "demo-director@domotz.com" with an option to log out on the right.
2. The application menu includes "Members", "Agents", and "Reports" tabs for navigation.
3. Below, the "USER LIST" section is visible showing user management fields.
4. "Region" dropdown is set to "Demo Area 1" for filtering users by region.
5. Buttons labeled "Create Team", "Create Area Member", and "Create Team Member" allow for the addition of new teams or members. Use these to input new data as needed.
6. A search bar below allows filtering of users by Account, Type, or Team name to locate specific entries efficiently.
It is also possible to move Agents from one Team to another:
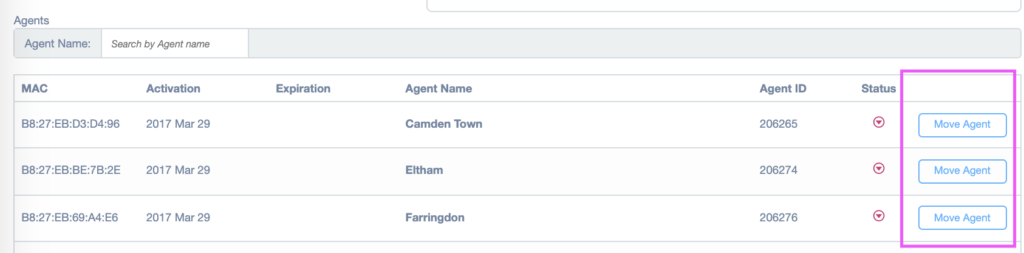
Agent Management Interface
1. The interface displays a table listing agents with columns for MAC address, Activation date, Expiration date, Agent Name, Agent ID, and Status.
2. Above the table, a search bar allows filtering by Agent Name.
3. Each row contains details for an agent, including a unique MAC address and associated data such as activation and expiration dates.
4. The last column includes a "Move Agent" button for each agent, used to transfer an agent to a different status or location.
For more information about Company structure and reports, please contact sales@domotz.com.
Device Uptime in the Monthly PDF Report
The Monthly PDF Report now includes a new column with the uptime percentage of a device during the period of observation:
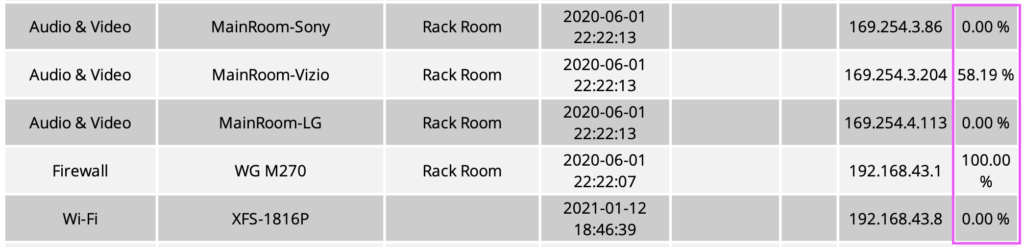
Table showing network devices and their packet loss percentages.
1. The table lists device categories, names, locations, timestamps, IP addresses, and packet loss percentages.
2. For "Audio & Video," devices include "MainRoom-Sony," "MainRoom-Vizio," and "MainRoom-LG," all in "Rack Room," with differing IPs and packet loss percentages of 0.00% and 58.19%.
3. A "Firewall" device, "WG M270," also in "Rack Room," has an IP of 192.168.43.1 and 100.00% packet loss.
4. "Wi-Fi" device "XFS-1816P," in "Rack Room," has an IP of 192.168.43.8 and 0.00% packet loss.
5. Use this information to identify which devices are experiencing packet loss issues.
Device Link to IT Glue
It is now possible to jump directly to IT Glue from the Device Details view of devices connected to an IT Glue Configuration:
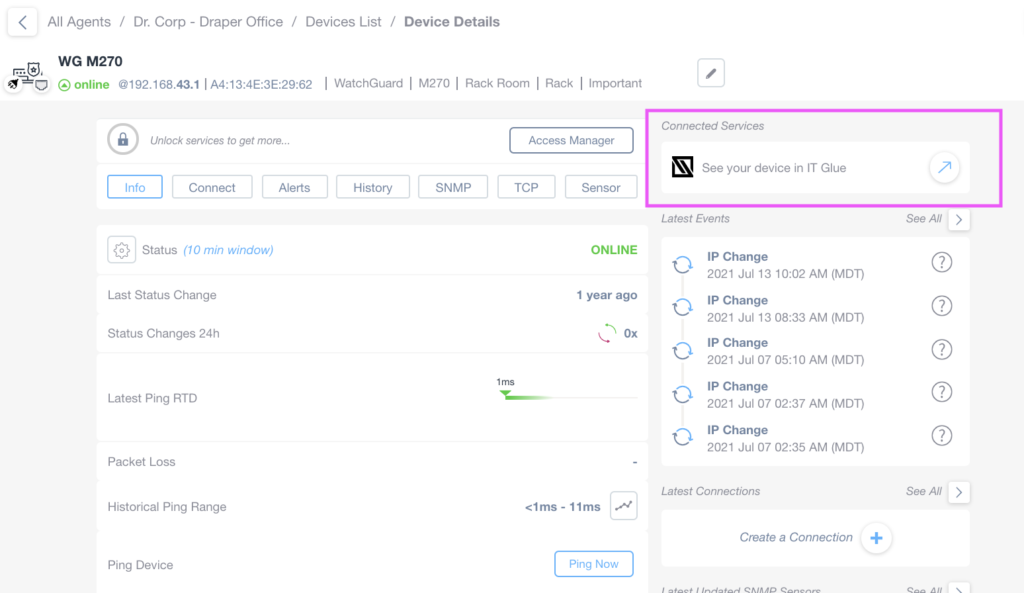
Device Details and Connected Services in IT Management Interface
1. The device, labeled WG M270, is online and connected, displaying IP and MAC addresses.
2. Tabs for accessing device information include Info, Connect, Alerts, History, SNMP, TCP, and Sensor.
3. The status section shows 'online', the last status change was 1 year ago, and includes details on ping responses and packet loss.
4. The "Connected Services" section allows viewing the device in IT Glue.
5. A list of latest events notes IP changes with timestamps.
6. There's an option to create a connection at the bottom of the latest connections section.
For more information, visit IT Glue Integration guide.
Configuration Management: HPE/Aruba
Always stay on top of changes happening on your network infrastructure devices.
With Domotz, you can now automatically backup the running configuration files of your Hewlett Packard Enterprise (HPE) and Aruba Network devices.
Domotz will keep track of the configuration changes over time and notify you if any change occurs. Network configuration issues are easily identified. Store backup files or new configuration files can be pushed to the Network device directly from Domotz.
For more information, visit Network Configuration Management.
Filter for Locked devices
Within the search functionality available in the “Manage” section, it is now possible to filter the devices that need a credential to be set in order to be unlocked:
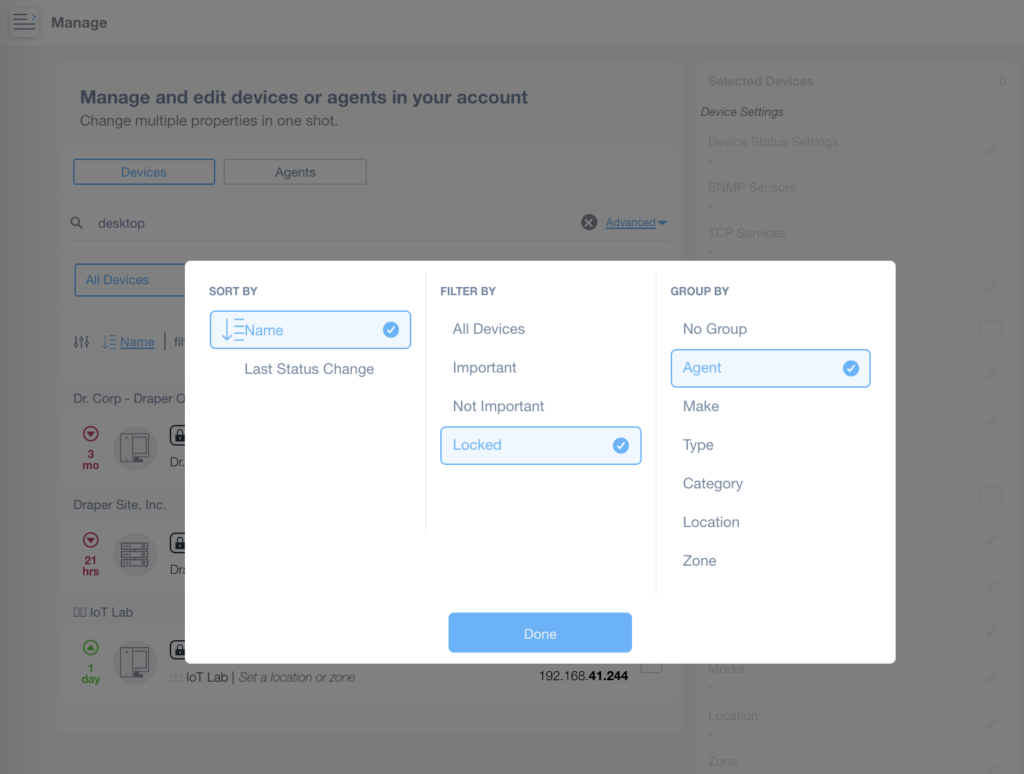
Manage and Customize Device or Agent List
1. At the top, choose between "Devices" and "Agents" to manage specific lists.
2. Use the search bar to find a device or agent by name, like "desktop."
3. In the "Sort By" section, select either "Name" or "Last Status Change" to organize the list.
4. In the "Filter By" section, options allow filtering for "All Devices," "Important," "Not Important," and "Locked" items.
5. Under "Group By," choose how to categorize items, such as by "Agent" or other available criteria like "Make," "Type," "Category," "Location," or "Zone."
6. Click "Done" to apply changes.
Unlocking devices, guarantees that Domotz uses the most advanced driver to exploit the additional functionalities for monitoring those devices (e.g. Configuration Management for Networking devices, OS Monitoring for Windows, macOS and Linux servers and PC, etc).
Topology Map: data from both devices
Within the Topology Map, when both the upstream and downstream devices are reporting statistics for the same physical connection, the graph only shows one connection. Selecting an upstream or downstream connection is now available. You can then select the source of the information reported (either the upstream or the downstream device):
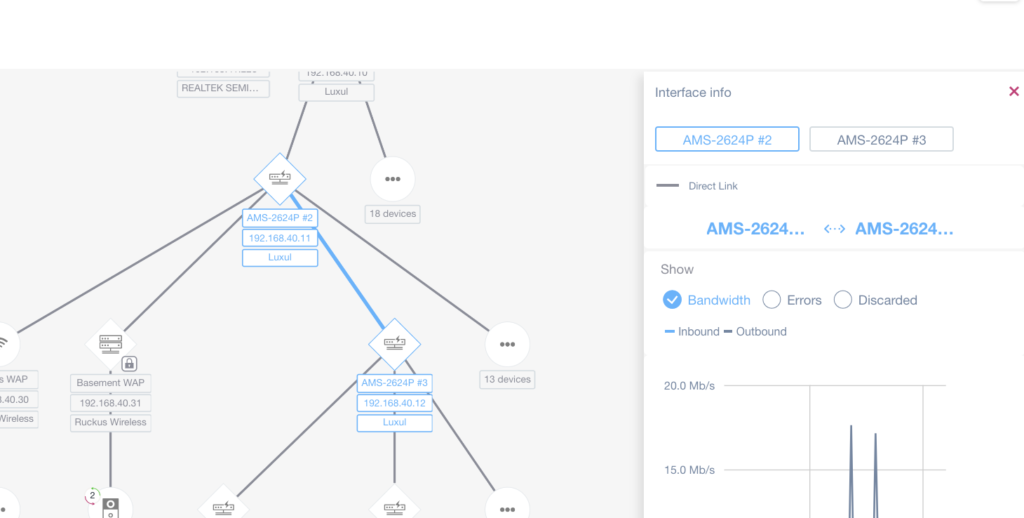
Network diagram showing interface details for AMS-2624P switches.
1. The diagram displays a network structure with AMS-2624P#2 and AMS-2624P#3 switches connected, each showing their IP addresses and labels. AMS-2624P#2 has IP 192.168.40.11, while AMS-2624P#3 has IP 192.168.40.12.
2. The right panel titled "Interface info" provides options to view details for AMS-2624P#2 or AMS-2624P#3. Select tabs to switch between the switch interfaces.
3. Below, select what network data to display: Bandwidth, Errors, or Discarded. The current selection is Bandwidth, shown with a graph of inbound and outbound traffic, with units marked in megabits per second.
Use this panel to analyze the network performance and connectivity details of the selected switch.
For more information, visit Network Topology Map.
SNMP Monitoring: Enumerated values
To make the process of reading data easier, when monitoring enumerated fields through specific OiDs (MIB identification), Domotz now translate the monitored value into enumerated text:
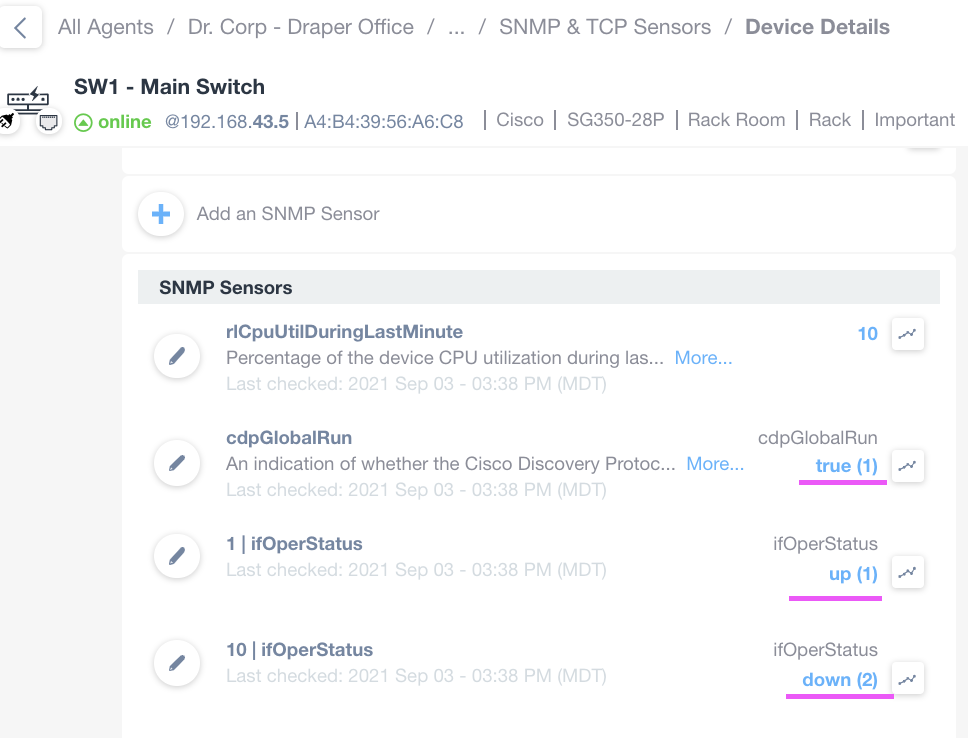
Device Details and SNMP Sensor Information
1. The image displays device details for "SW1 - Main Switch" which is currently online with the IP address 192.168.43.5 and MAC address A4:B4:39:56:A6:C8. The location details indicate the device is a Cisco SG350-28P in the Rack Room.
2. Under "SNMP Sensors," there are several entries:
- **rlCpuUtilDuringLastMinute**: Displays the CPU utilization percentage of the device over the last minute, with a graph link to the right showing the number 10.
- **cdpGlobalRun**: Indicates whether the Cisco Discovery Protocol is enabled, with a status of "true (1)" linked to a graph.
- **1 | ifOperStatus**: Shows operational status with the status "up (1)" linked to a graph.
- **10 | ifOperStatus**: Shows operational status with the status "down (2)" linked to a graph.
3. Each sensor has a last checked timestamp of September 3, 2021, at 03:38 PM (MDT) and includes options to edit the sensor information.
In the above example, the three OiD are reported as the decipher value as extracted from the MIB. The same values are also used when configuring thresholds for the Alerts.
Stacked Switch details
The interface tab for Managed Network Switches now reports additional information when the data is retrieved through a stacked switch. It now reports each port under the physical switch of the stack.
Unifi Controller Port Mapping
Domotz now extracts and connects more information out of Unifi controllers in order to build a more reliable Network Topology map.
Crestron PDU PC-350 support
The new Crestron PDU (family PC-350) is now supported by Domotz so that you can review and control the outlet status directly from the Domotz App/WebApp.
PoE Switch drivers: Luxul SW-510 and SW-610
The new Luxul PoE switches SW-510 and SW-610 are now supported through Domotz, so that they can be controlled via WebApp or App.
Fix
- When receiving an alert for the WAN IP change, sometimes the old IP Address was not populated
- An issue on the TimeZone conversion prevented the display of RTD data for a few days
- Generic PoE driver (based on RFC 3621) was not able to parse some wrongly formatted data
- Kaseya BMS Integration did not support more than 100 Customers (issue resolved)
- Domotz VPN on Demand Virtual Interface (Tun) was reported in the list of scanned devices
- Under specific circumstances, the Windows agent was triggered to continuously restart
- An error preventing the geo-maps to be loaded on iOS devices has been fixed
- Device identification via Bonjour protocol has been fixed
- Users hosting IT Glue instance in the Australian
- Domotz Portal did not allow the selection (for copy) of any text
Known limitations
- VPN on Demand is currently not supported on Luxul Router based Agents. As soon as Luxul’s team provides Domotz with the API resources to make this available, Domotz will add this capability.
- Devices with multiple network interfaces (multiple MAC addresses) can’t be merged into a single device. This affect also some type of switches which appear as multiple instances on Domotz when VLANs are configured.
- The static IP address on the Domotz Box cannot be configured before configuring the Agent.
- DHCP cannot be leveraged on additional VLANs on the Domotz Box.
This change log covers what’s changed in Domotz Pro service since previous Release Notes. These changes include Domotz Pro cloud, Domotz Agent and Domotz Pro App.