
We’re excited to announce some significant upgrades in this release, designed to enhance your experience and make your IT infrastructure monitoring and management even more seamless. This update brings, among others:
- Simplified Network Collector Dashboard.
- New automation and scripts to ingest VMWare ESXi and Palo Alto Firewalls data.
- Integration with Ubiquiti UISP Cloud Console and AirMax.
As always, we value your feedback, so don’t hesitate to reach out to our support team at support@domotz.com with any questions or suggestions.
New features and integrations
New features
Network Collector Dashboard
Let’s jump to the big news.
Our new Network Collector Dashboard brings powerful improvements aimed at simplifying your monitoring and management workflow. With enhanced navigation, you can now manage network collectors and the underlying resources across your network, reducing the time spent managing your collectors.
This streamlined interface improves overall usability, making it easier than ever to manage and monitor your network collectors and provide quicker access to key data. It also provides a more intuitive user experience.

Dashboard Overview of IoT Lab - Domotz B12
1. The left panel displays basic information including:
- Collector Name: IoT Lab - Domotz B12
- Location: UT, United States
- Time Zone: Denver, America
- Customer Info with email, name, and phone numbers
- Contract details with Customer ID and Contract ID
- Organization listed as Nico's Place
2. Below the basic information is the default credentials section for SNMP Authentication showing:
- Version: v2
- Read and Read/Write status: private
3. The right panel features the Monitoring Configuration:
- A summary that all detected devices will be managed automatically.
- Monitoring Networks with a link to Attached Network for detailed configuration.
- Additional Devices section links to Logical Device and External Hosts for management customization.
4. A notice regarding licensing changes effective June 18th, with contact details for support and additional information.
5. The panel concludes with a Collector Overview summarizing device tracking, metric analysis, and configuration management, displaying 113 persistent devices.
Display Important Offline Devices banner on the Devices List
Don’t worry if you usually see the Important Devices Offline information in the Site Explorer. You can access the same information from the Device list.
We added an intuitive alert banner to the Devices tab to give you immediate visibility when critical devices go offline.
With a single click on the embedded link, you automatically filter the device list, allowing you to quickly identify and address any issues before they escalate. This proactive approach helps you take immediate action to minimize downtime and keep your network running smoothly.

Device Management Interface Overview
1. The interface displays a "Device List" section showing devices' online status. Notably, there's an alert labeled "Important Devices Offline" indicating offline devices. Click "click here" to view them.
2. Use the search bar to filter devices by text input.
3. Below are quick-access buttons: "All Devices" showing 139 devices, "Online" displaying 122 devices, and "Offline" showing 17 devices.
4. Additional features include sorting by "IP Address," filtering devices, and grouping by "No Group."
5. The right panel, "Manage Devices and Subnets," includes options to:
- Add Dummy Devices
- Manage Devices' External Services
- Add External Hostname/IP
- Configure Routed Networks Scan
- Configure VLAN
Each feature has corresponding icons for actions.
Integration with Ubiquiti UISP Cloud Console and AirMax devices
Our latest integration with the Ubiquiti UISP Cloud Console and AirMax Point-to-Point Radio devices provides clearer visibility into network structure.
The enhancement allows the extraction of device information like Name, Model, and Firmware version, in addition to how they are connected to each other.
Use Public IP addresses on Routed Networks, IP List and Range configuration
We’ve introduced support for Public IP addresses on routed networks, IP Lists and Range configurations.
This feature is a powerful addition for those needing to monitor public-facing IPs, offering greater control and visibility over their networks. Additionally, it enhances flexibility for network monitoring.
It’s now available for selected customers. If you’re interested in learning more, please reach out to our experts by email at sales@domotz.com.
Automation and Scripts
Domotz Collector
Rely on Domotz scripts to ingest more data about:
- Diagnostic Data
- Resources
- CPU Information
Diagnostic Data
Use this script to dynamically create a table to monitor the following information:
- Actual Discovery Counter
- Missed Discovery Counter
- Errir Count
The script uses the HTTP protocol and has been validated and tested on Domotz collector 6.1.0-b001.
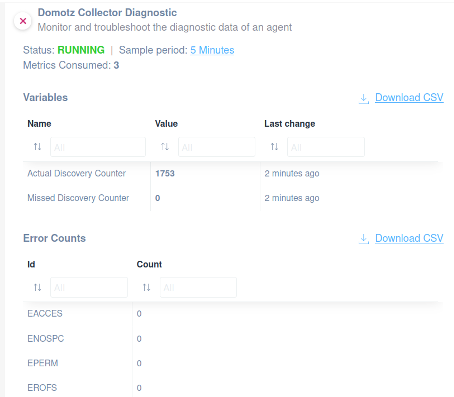
Domotz Collector Diagnostic Interface
1. The page title is "Domotz Collector Diagnostic" with a brief explanation stating it is for monitoring and troubleshooting diagnostic data of an agent.
2. The status is "RUNNING" with a sample period of "5 Minutes" and "Metrics Consumed: 3".
3. The "Variables" section lists two items:
- "Actual Discovery Counter" with a value of "1753" and a last change noted as "2 minutes ago".
- "Missed Discovery Counter" with a value of "0", also updated "2 minutes ago".
4. The "Error Counts" section displays error IDs and their counts:
- "EACCES" with a count of "0".
- "ENOSPC" with a count of "0".
- "EPERM" with a count of "0".
- "EROFS" with a count of "0".
5. There are options to download the data as CSV files next to the "Variables" and "Error Counts" sections.
Resources
Applying the Domotz collector resources script, you’ll be able to extract information regarding the following:
- Status
- Mode
- Platform
- Architecture
- Agent Version
- Node Version
- System Uptime
- Process Uptime
- Load Average 1 min
- Load Average 5 min
- Load Average 15 min
- Free Mem
The script uses the HTTP protocol and has been validated and tested on Domotz collector 6.1.0-b001.
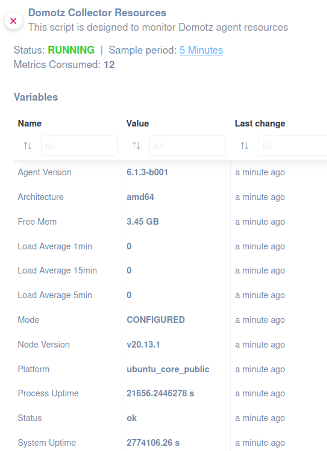
Domotz Collector Resources Metrics
1. The script is designed for monitoring Domotz agent resources.
2. Status: RUNNING, indicating active operation.
3. Sample period: 5 Minutes, specifying how frequently data is collected.
4. Metrics Consumed: 12, showing the number of metrics used.
5. Variables are listed in three columns: Name, Value, and Last change.
6. Agent Version is 6.1.3-b001, updated a minute ago.
7. Architecture is amd64, updated a minute ago.
8. Free Mem is 3.45 GB, with recent update.
9. Load Average (1min, 5min, 15min) values are all 0.
10. Node Version is v20.13.1.
11. Platform is ubuntu_core_public.
12. System Uptime shows significant runtime at 2774106.26 seconds.
CPU information
This script helps you monitor the CPU information of the Domotz collector. Using this script, you’ll be able to extract this information:
- Model
- Speed
- User Time
- Nice Time
- Sys Time
- Idle Time
- IRQ Time
The script uses the HTTP protocol and has been validated and tested on Domotz Collector 6.1.0-b001.
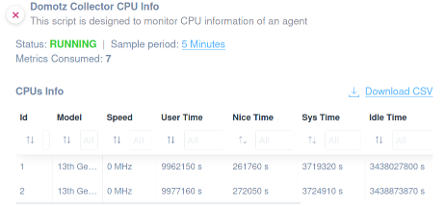
Monitoring CPU Information with Domotz Collector
1. The top section displays the script purpose: monitoring CPU information of an agent.
2. The status is shown as "RUNNING," with a sample period of 5 minutes and metrics consumed as 7.
3. Under "CPUs Info," there is a table with columns for Id, Model, Speed, User Time, Nice Time, Sys Time, and Idle Time.
4. The table includes two entries. The first has Id 1, Model "13th Gen," Speed "0 MHz," with various time values listed. The second entry is similar with slight variations in the time values.
5. A "Download CSV" link is available to export the data.
VMware ESXi and vCenter
VMware ESXi Firewall
This script helps you monitor the firewall configuration of your VMware ESXi host by providing comprehensive details about its firewall rules.
The following information can be monitored:
- Name
- ls Required
- Port
- Direction
- Protocol
- Associated Service
- Is Enabled
The script uses HTTPS protocol and has been validated and tested on ESXi 8.0.0.
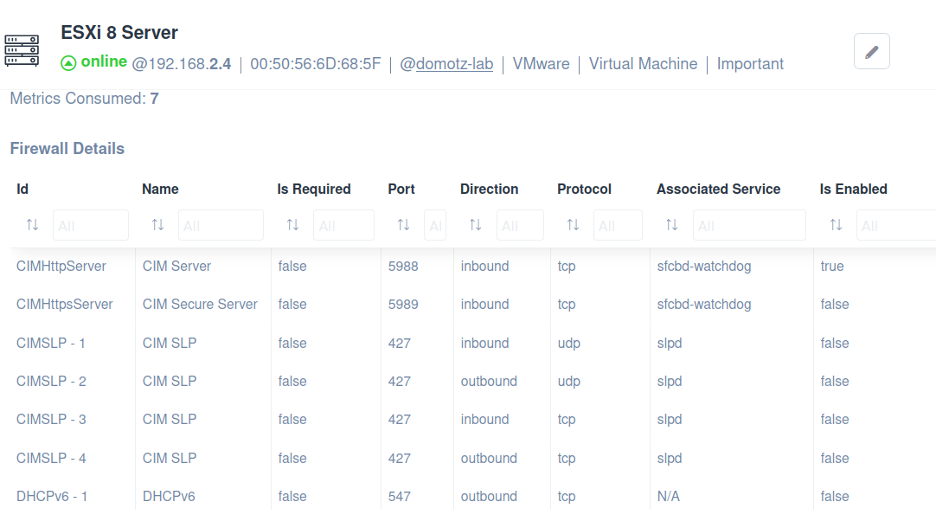
ESXi 8 Server Firewall Configuration Details
1. The server is identified as "ESXi 8 Server," currently online with an IP address of 192.168.2.4.
2. Firewall details are displayed in a table format, including the following columns:
- **Id**: Identifies each service, such as CIMHttpServer, CIMSLP-1, etc.
- **Name**: Describes the service name, for instance, CIM Server and DHCPv6.
- **Is Required**: Indicates whether the service is required, mostly labeled "false."
- **Port**: Specifies the port number used by the service, such as 5988 and 427.
- **Direction**: Shows traffic direction, either "inbound" or "outbound."
- **Protocol**: Lists the protocol used, either "tcp" or "udp."
- **Associated Service**: Details the associated service, like sfcbd-watchdog or slpd.
- **Is Enabled**: Displays whether the service is enabled, with "true" or "false" for each entry.
VMware ESXi Network Details
This script helps you monitor the network configuration of your ESXi host by providing detailed information.
The following information can be monitored:
- Name
- Overall Status
- Accessible
- Virtual Machines
The script uses HTTPS protocol and has been validated and tested on ESXi 8.0.0.
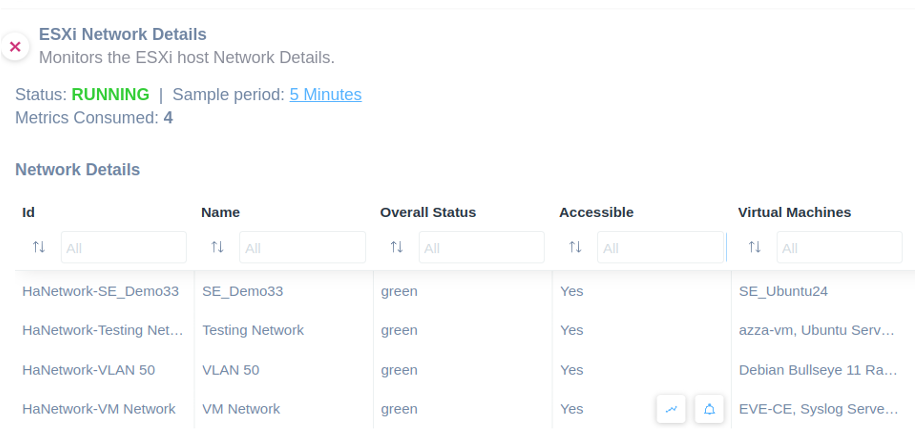
ESXi Network Details Monitoring Overview
1. The section titled "ESXi Network Details" contains information for monitoring the ESXi host network details.
2. Status of the monitoring is indicated as "RUNNING" in green.
3. The sample period is set to "5 Minutes."
4. The number of metrics consumed is listed as "4."
5. The "Network Details" table has columns for Id, Name, Overall Status, Accessible, and Virtual Machines.
6. Each column allows filtering with text boxes for specific entries.
7. Data entries show networks with their Id, Name, overall status as "green," accessibility marked as "Yes," and associated virtual machines listed, such as "SE_Ubuntu24" and others.
VMware ESXi Datastore
This script helps you monitor the datastores on your VMware ESXi host. It provides general information about the available datastores.
The following information can be monitored
- Name
- Accessible
- Capacity (GB)
- Free Space (GB)
- Uncommitted Space (GB)
- Type
- URL
- Virtual Machines
The script uses HTTPS protocol and has been validated and tested on ESXi 8.0.0.
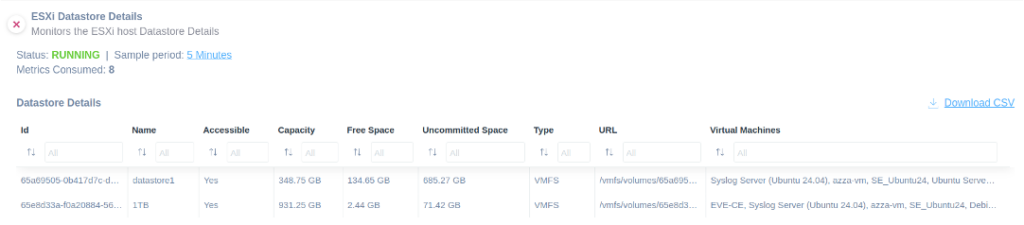
ESXi Datastore Details Overview
1. The page title indicates the section for monitoring ESXi host datastore details.
2. Status is shown as "RUNNING," and the sample period is set to "5 Minutes."
3. Total metrics consumed is recorded as 8.
4. The table titled "Datastore Details" contains several columns: Id, Name, Accessible, Capacity, Free Space, Uncommitted Space, Type, URL, and Virtual Machines.
5. The first row lists a datastore with Id "65a69505-0b417d7dc," Name "datastore1," marked as "Accessible" with "Yes," a "Capacity" of "348.75 GB," and "Free Space" of "134.65 GB."
6. Additional row details include "Uncommitted Space" of "685.27 GB," "Type" as "VMFS," "URL" "/vmfs/volumes/65a69505-0b41...", and linked "Virtual Machines" like "Syslog Server (Ubuntu 24.04)."
7. The second row presents another datastore with Id "65e8d33a-f0a20884-56," displaying different capacity and usage metrics.
8. A "Download CSV" option is available for exporting the datastore details.
VMware ESXi Network DNS Configuration
This script helps you monitor the network DNS configuration of your ESXi host by providing detailed information.
The following information can be monitored
- DHCP Enabled
- Host Name
- Domain Name
The script uses HTTPS protocol and has been validated and tested on ESXi 8.0.0.
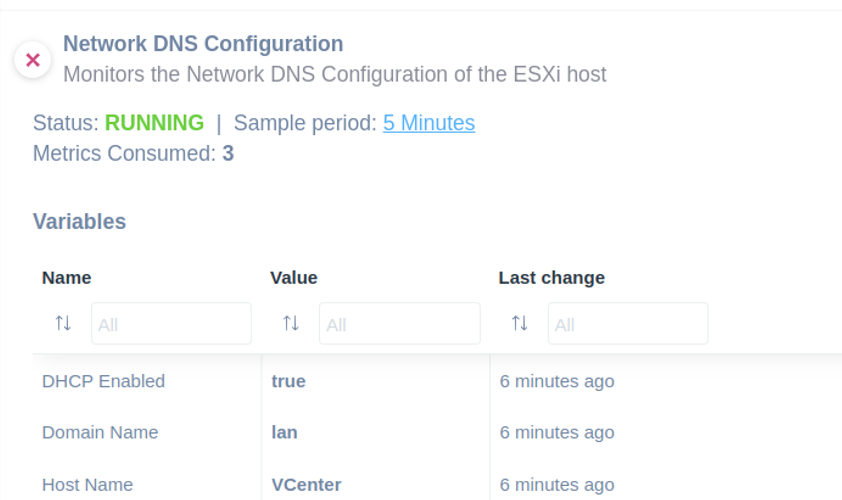
Network DNS Configuration Panel Overview
1. The title, "Network DNS Configuration," indicates a monitoring system for the DNS configuration of an ESXi host.
2. The current status is labeled "RUNNING," with a sample period set to "5 Minutes."
3. The metrics consumed are displayed as "3."
4. Under "Variables," a table lists details such as:
- "DHCP Enabled" with a value of "true," last changed "6 minutes ago."
- "Domain Name" with the value "lan," last changed "6 minutes ago."
- "Host Name" shows "VCenter," also updated "6 minutes ago."
5. Columns in the table include categories for "Name," "Value," and "Last change," with filters available for each column.
VMware ESXi Network Port Group Configuration
This script provides comprehensive details about your VMware ESXi host’s network port group configuration, helping you monitor it.
The following information can be monitored
- Allow Promiscuous
- MAC Address Changes
- Forged Transmits
- NIC Teaming Policy
- Reverse Policy
- Notify Switches
- Rolling Order
- Check Speed
- Speed
- Check Duplex
- Full Duplex
- Check Error Percentage
- Error Percentage
- Check Beacon
- Active NIC
- Checksum Offload
- TCP Segmentation
- Zero Copy Transmission
- Shaping Policy Enabled
- Port Group Name
- VLAN ID
- vSwitch Name
- Security Policy
- NIC Teaming Policy
- NIC Teaming Failure Criteria
- Offload Policy
- Shaping Policy
- MAC Address
The script uses HTTPS protocol and has been validated and tested on ESXi 8.0.0.

ESXi Network Port Group Configuration Overview
1. The title of the page is "ESXi Network Port Group Configuration".
2. Status is indicated as "RUNNING" with a sample period of "5 Minutes".
3. There are two entries in the "Network Port Group Configuration" table:
- The first entry is labeled "Management Network" with a VLAN ID of 0, a MAC Address starting with "00:50:56:51" and ending with "b3". Certain policies such as "Allow Promiscuous" are set to false.
- The second entry is designated "VM Network" also with a VLAN ID of 0, a MAC Address starting with "00:0c:29:c5" and ending with "d2". The "Allow Promiscuous" policy is similarly set to false.
4. Both entries have specific configurations for policies like "Forged Transmits", "Reverse Policy", and "Notify Switches".
5. Options to download the configuration table as a CSV file are provided at the upper-right corner of the table.
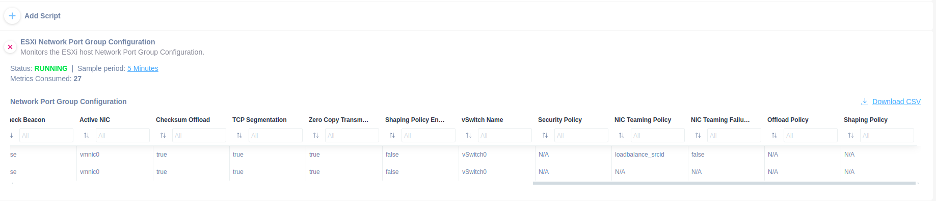
ESXi Network Port Group Configuration Overview
1. To add a script, click the "Add Script" button at the top.
2. Review the ESXi Network Port Group Configuration details:
- Status is indicated as RUNNING.
- Sample period is set to 3 minutes.
- Number of monitors connected is 27.
3. Analyze the Network Port Group Configuration table:
- Columns include Kick Beacon, Active NIC, Checksum Offload, TCP Segmentation, Zero Copy Transmission, vSwitch Name, Shaping Policy Enabled, Security Policy, NIC Teaming Policy, NIC Teaming Failover, Offload Policy, and Shaping Policy.
- Data for two rows is displayed:
- First row: Kick Beacon "52", Active NIC "vmnic0", Checksum Offload "true", TCP Segmentation "true", Zero Copy Transmission "true", vSwitch Name "vSwitch0".
- Second row: Kick Beacon "53", Active NIC empty, Checksum Offload "true", TCP Segmentation "true", Zero Copy Transmission "false", vSwitch Name "vSwitch0".
4. Download the configuration data as a CSV file using the "Download CSV" link.
VMware ESXi Virtual Machines
This script helps you monitor the virtual machines’ configuration of your VMware ESXi host by providing comprehensive details about its virtual machines.
The following information can be monitored:
- Name
- Power State
- Guest Full Name
- Guest OS ID
- Number of CPUs
- Memory (MB)
- Memory Usage (MB)
- VMware Tools Status
- VMware Tools Version Status
- VMware Tools Running Status
- VM Path Name
- Host
- Maximum Memory Usage (MB)
- Maximum CPU Usage (MHz)
- Template
- Number of Ethernet Cards
- Number of Virtual Disks
The script uses HTTPS protocol and has been validated and tested on ESXi 8.0.0.
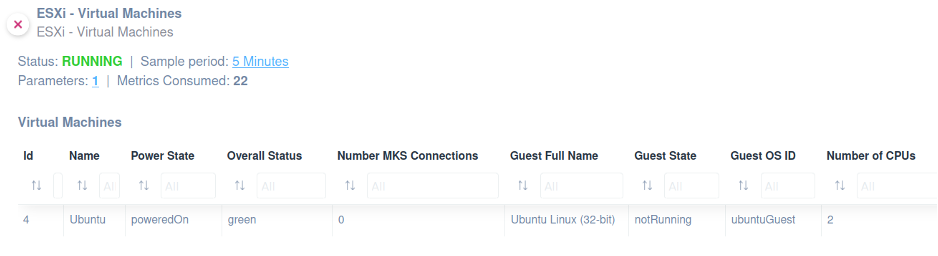
Overview of Virtual Machines in ESXi Panel
1. The panel displays information about virtual machines under the "ESXi - Virtual Machines" section.
2. The status is marked as "RUNNING," with a sample period of 5 minutes.
3. It lists parameters and metrics, showing 1 parameter and 22 metrics consumed.
4. In the "Virtual Machines" table, columns include: Id, Name, Power State, Overall Status, Number MKS Connections, Guest Full Name, Guest State, Guest OS ID, and Number of CPUs.
5. One virtual machine entry is shown:
- Id: 4
- Name: Ubuntu
- Power State: poweredOn
- Overall Status: green
- Number MKS Connections: 0
- Guest Full Name: Ubuntu Linux (32-bit)
- Guest State: notRunning
- Guest OS ID: ubuntuGuest
- Number of CPUs: 2
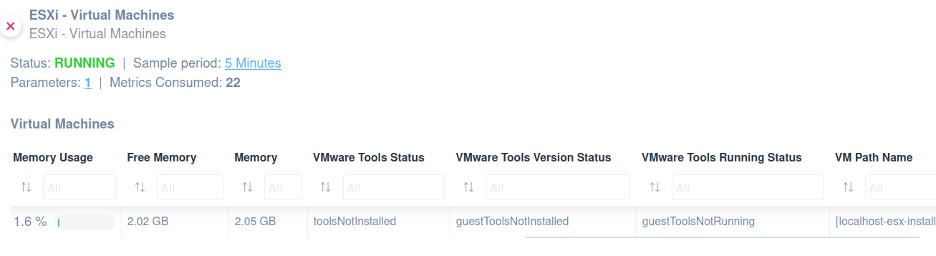
ESXi Virtual Machines Overview
1. The status of the virtual machine is displayed as "RUNNING," with a sample period of 5 minutes.
2. The parameters monitored include one parameter and 22 metrics consumed.
3. Under "Virtual Machines," information is provided in columns: "Memory Usage," "Free Memory," "Memory," "VMware Tools Status," "VMware Tools Version Status," "VMware Tools Running Status," and "VM Path Name."
4. Memory usage shows 1.6%, with 2.02 GB free and 2.05 GB total memory.
5. VMware Tools status indicates "toolsNotInstalled," "guestToolsNotInstalled," and "guestToolsNotRunning."
6. The VM path name is specified as "[localhost-esx-install-]."
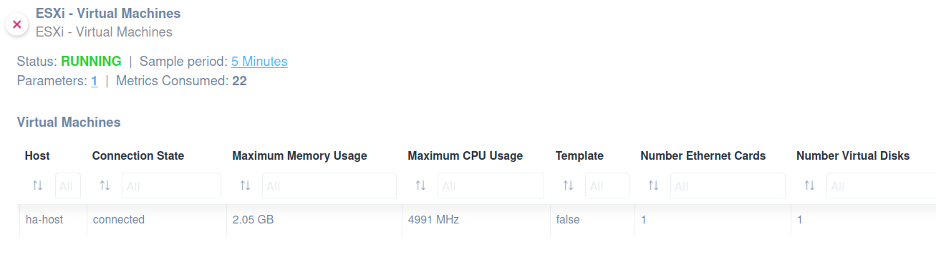
ESXi Virtual Machines Overview and Metrics
1. The status of the ESXi virtual machines is displayed as "RUNNING."
2. The sample period is set to 5 minutes, indicating the data refresh interval.
3. Parameters show a count of 1, while metrics consumed amount to 22.
4. Under "Virtual Machines," details for each host are provided:
- Host: "ha-host"
- Connection State: "connected"
- Maximum Memory Usage: "2.05 GB"
- Maximum CPU Usage: "4991 MHz"
- Template: "false"
- Number of Ethernet Cards: "1"
- Number of Virtual Disks: "1"
5. Each column allows filtering options, indicated by input fields labeled "All."
VMware ESXi Network Virtual Switch Configuration
This script helps you monitor the network virtual switch configuration of your ESXi host by providing comprehensive details.
The following information can be monitored:
- Virtual Switch Name
- Virtual Switch Key
- Number of Ports
- Number of Available Ports
- MTU
- Port Group
- Physical NIC
- Specified Number of Ports
- Bridge NIC Device
- Beacon Interval
- Allow Promiscuous
- MAC Changes
- Forged Transmits
- NIC Teaming Policy
- Reverse Policy
- Notify Switches
- Rolling Order
- Failure Criteria Check Speed
- Failure Criteria Speed
- Failure Criteria Check Duplex
- Failure Criteria Full Duplex
- Failure Criteria Check Error Percent
- Failure Criteria Percentage
- Failure Criteria Check Beacon
- Active NIC
- Checksum Offload
- TCP Segmentation
- Zero Copy Transmit
- Shaping Policy Enabled
The script uses HTTPS protocol and has been validated and tested on ESXi 8.0.0.
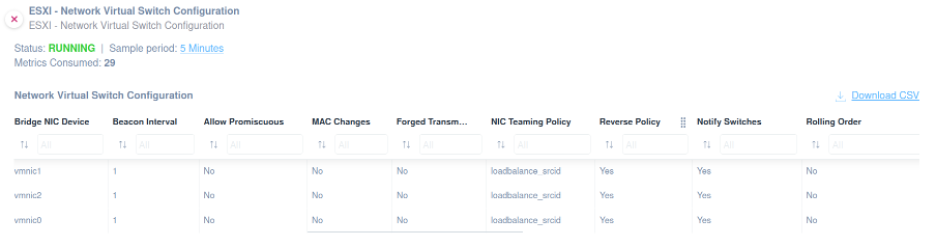
ESXi Network Virtual Switch Configuration Overview
1. The page shows the status of the ESXi Network Virtual Switch Configuration as "RUNNING," with a sample period of 5 minutes and 29 metrics consumed.
2. Three network interface controllers (NICs) are listed: vmnic1, vmnic2, and vmnic0.
3. For each NIC, the following configurations are displayed:
- Beacon Interval: Set to 1 for all NICs.
- Allow Promiscuous: Set to "No" for all NICs.
- MAC Changes: Set to "No" for all NICs.
- Forged Transmissions: Not visible in the image.
- NIC Teaming Policy: Uses "loadbalance_srcid" for all NICs.
- Reverse Policy: Set to "Yes" for all NICs.
- Notify Switches: Set to "Yes" for all NICs.
- Rolling Order: Set to "No" for all NICs.
4. A download option for saving the configuration as a CSV file is available on the right.
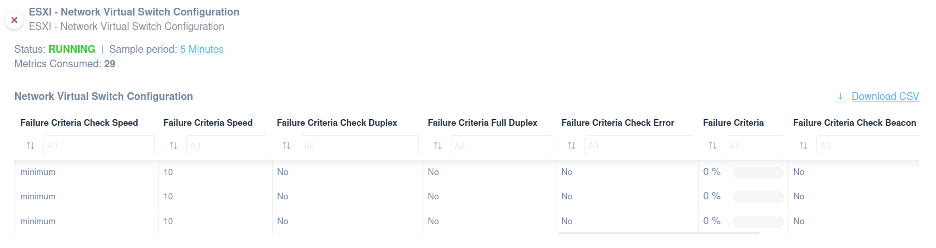
ESXi Network Virtual Switch Configuration Overview
1. The title indicates the configuration of the ESXi Network Virtual Switch.
2. Status shows "RUNNING" with a sample period of 5 minutes and 29 metrics consumed.
3. The section provides configuration criteria with columns for Speed, Duplex, Error, and Beacon checking.
4. Under "Failure Criteria Check Speed," listed values are all set to "minimum."
5. "Failure Criteria Speed" for entries is set to 10.
6. "Failure Criteria Check Duplex" and "Failure Criteria Check Error" are both marked as "No."
7. "Failure Criteria" and "Failure Criteria Check Beacon" display percentages as "0%."
8. A "Download CSV" option is available to export the data.
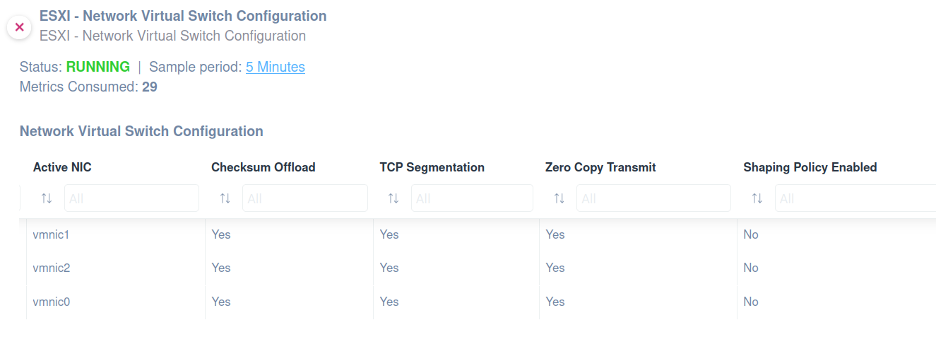
ESXi Network Virtual Switch Configuration Dashboard
1. The dashboard displays the ESXi Network Virtual Switch Configuration status. It shows that the status is "RUNNING" with a sample period of "5 Minutes" and "29" metrics consumed.
2. A table outlines the configuration details for Active NICs, including:
- NIC names: vmnic1, vmnic2, vmnic0.
- Each NIC has settings with "Yes" under Checksum Offload, TCP Segmentation, and Zero Copy Transmit.
- "Shaping Policy Enabled" is set to "No" for all NICs.
Use this information to verify and review network configuration and performance settings for each NIC.
VMware vCenter Host List
You can use this script to retrieve a comprehensive list of hosts available within a VMware vCenter server. It extracts detailed information about each host present.
You’ll be able to monitor the following information:
- Name
- Model
- Operating System
- CPU
- Processors
- Cores
- Memory
- Memory Usage
- CPU Usage
- Power State
- Connection State
- Status
- Uptime
The script uses HTTP protocol and has been validated and tested on VMware vCenter 8.0.2.
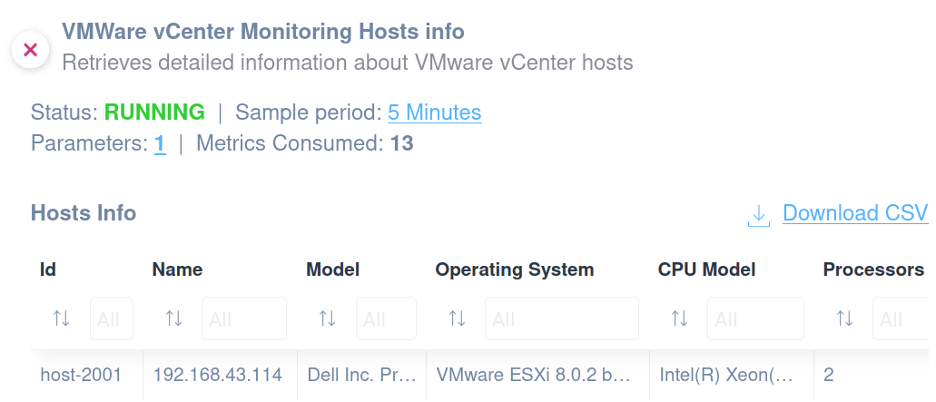
VMware vCenter Monitoring Hosts Info
1. The interface displays monitoring details for VMware vCenter hosts.
2. Current status is "RUNNING."
3. The sample period is set to "5 Minutes."
4. Displays "Parameters: 1" and "Metrics Consumed: 13."
5. A table labeled "Hosts Info" lists details, including:
- "Id" with example entry "host-2001."
- "Name" with IP "192.168.43.114."
- "Model" identifies as "Dell Inc. Pro."
- "Operating System" specifies "VMware ESXi 8.0.2."
- "CPU Model" shows "Intel(R) Xeon…"
- "Processors" shows a count of "2."
6. An option to "Download CSV" is available for exporting data.
Palo Alto Firewall
To backup the configuration of Palo Alto Firewall you might use our script which uses HTTPS as a communication protocol.
The script has been validated and tested on Palo Alto Version 10.1.0.
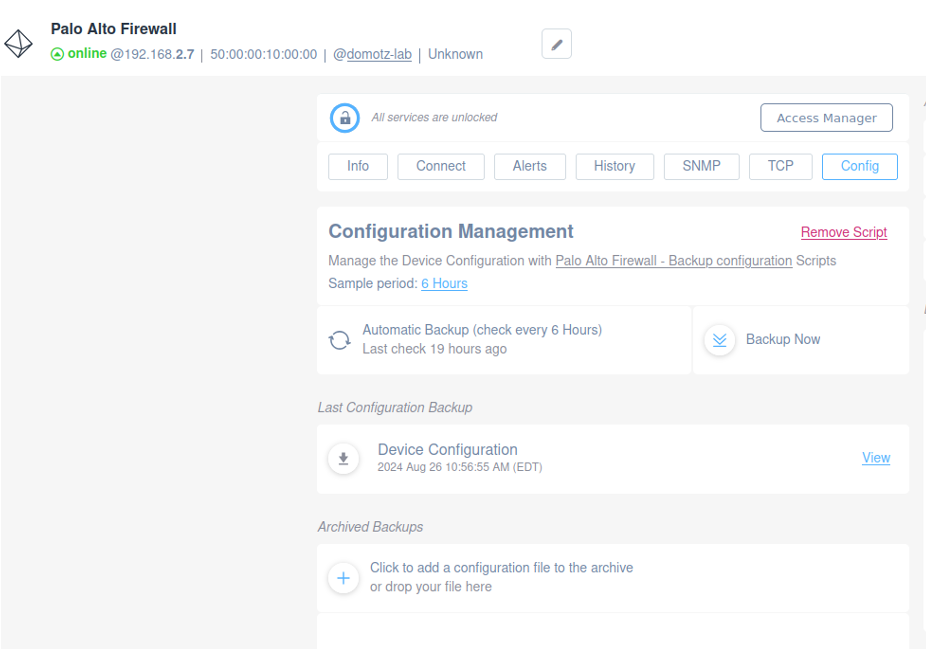
Palo Alto Firewall Configuration Management Interface
1. The top section indicates the Palo Alto Firewall status as online with an IP address of 192.168.2.7.
2. Buttons available for various actions include Info, Connect, Alerts, History, SNMP, TCP, and Config.
3. In the Configuration Management section, manage device configurations through linked options: Palo Alto Firewall and Backup configuration.
4. Set backup frequency with "Sample period: 6 Hours" and enable automatic backups, which have a status of "Last check 19 hours ago."
5. Initiate a manual backup using the "Backup Now" button.
6. Under Last Configuration Backup, view the most recent backup with details, including the date, time, and a View link.
7. For archived backups, there's an option to add a configuration file to the archive by clicking or dragging files into the designated area.
Enhancements
Improved network topology tree
We’ve enhanced the Network Topology map to provide better visibility for users. Now, connections flow neatly downward, avoiding confusing intersections and clutter. This update makes it easier to read and understand your network tree at a glance, improving overall clarity.
Performance improvements
The fetching of Device SNMP information on the Device Detail page is now faster, providing you with quicker insights and overview into device health.
Cresnet, Zigbee and D-Tools changes
Along with the improvements to the UI, from now on, all information related to Cresnet and Zigbee links will be found in the Device list section. Once you’re in, look at the right column under the section “Manage Devices and Subnets”.
In addition, we removed the D-Tools Integration from the WebApp/Desktop App but is still available through the Domotz Mobile App (iOS/Android).
Network Collector Updates
We recently rollout different platform updates and related improvements:
Snap Linux
Last Version 6.2.0-b001
- Upgrade NodeJS to v20
- Expose Collector Settings on local Status HTTP API
- Add system uptime and OS-free memory info to Collector Local Status HTTP API
- Fix the issue during Network Collector installation using the wrong location coordinates
- Fix the issue on Cisco C2960S configuration backup not working due to KEX
Domotz Box, Luxul, Synology, Netgear Router, QNAP, Raspberry, Docker, Netgear
Last Version 6.1.2-b001
- Use Cloud Geo-localization service to identify installation coordinates
- Support Cloud configuration to disable remote command execution
- Expose Collector Settings on local Status HTTP API
- Add system uptime and OS-free memory info to Collector Local Status HTTP API
- Fix the issue during Network Collector installation using the wrong location coordinates
- Fix issue with Speed Test execution
- Fix the issue preventing the discovery of available SNMP MIBs in some edge cases where MIB cache file appeared to be corrupted
Windows
Last Version 6.0.5-b001
- No updates
New MIBs
- Raritan
- PEPXIM
- ControlByWeb
Fixes
- Fix issue on Status for Devices discovered via DHCP (without IP Address), also erroneously increasing the number of Persistent Devices
- Fix issue for Devices without IP Address displaying a “.” in the Devices List
- Fix issue preventing Field Operator users to access the Privacy Policy document
- Fix issue on SNMP metrics historical charts not working updating the X axis as expected when zooming in
- Fix issue on Collector Settings/Location configuration, changing it did not update position on the Sites Explorer map
- Fix issue during Network Collector installation using the wrong location coordinates
- Fix issue with Speed Test execution
- Fix issue preventing to discover available SNMP MIBs in some edge cases where MIB cache file appeared to be corrupted
- Fix issue on Collector Settings Location property that was not correctly updating the Collector position on the Sites Explorer map (partial fix, map needs refresh to update)
- Fix issue on Inventory Dashboard that was breaking the UI when the header was expanded
- Fix issue on Public API not returning the correct Device Type ID on Device object