
September is here and with the changing leaves we bring you new changes to Domotz including an advanced NETGEAR integration for switches, access points and routers. Here’s what’s new on Domotz this month.
- Advanced NETGEAR integrations for switches, routers and access points
- Monitor the TLS/SSL Certificates of your sites
- Specify a Session Duration when logging in via SAML
- Configuration Management for Dell OS6 Switches
- Creating Monitoring Dashboards and Tables is now easier than ever
- Inventory now shows the Team names of the Agent owner
What’s new
Advanced NETGEAR Integration and Features
In partnership with NETGEAR, we’ve released an advanced NETGEAR integration for the following devices:
- Orbi Pro
- Insight WAPs
- Managed Switches
Orbi Pro
Thanks to the new NETGEAR integration, you can now unlock advanced functionalities on the Orbi Pro, to retrieve additional information from the device.
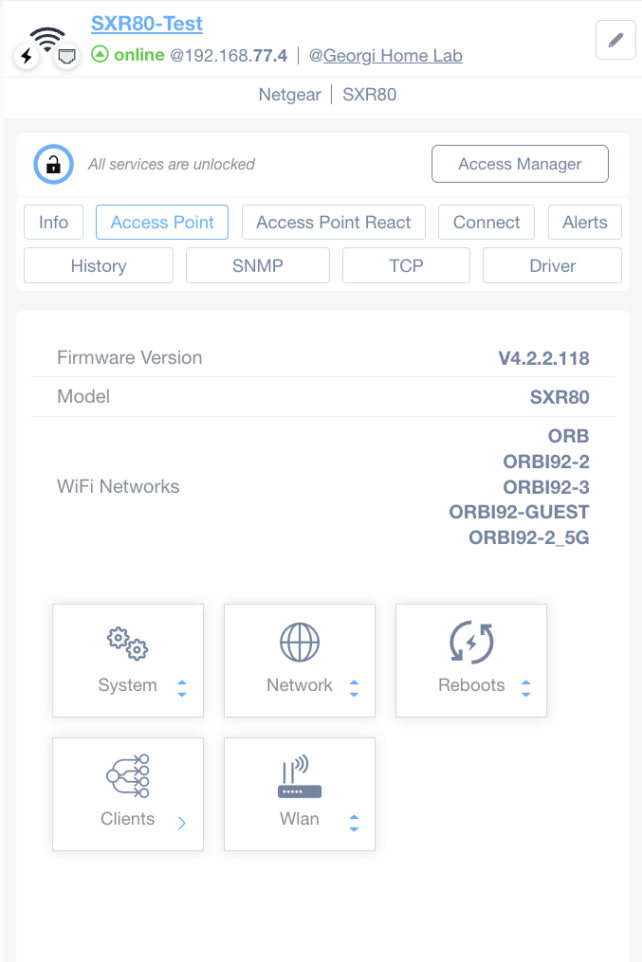
Netgear Router Access Point Settings Overview
1. The page displays the status of a Netgear SXR80 router, labeled as "SXR80-Test," with the router being online at IP address 192.168.77.4 within the "Georgi Home Lab."
2. A series of tabs are available for navigation: Info, Access Point (currently selected), Access Point React, Connect, Alerts, History, SNMP, TCP, and Driver.
3. The "Access Point" tab displays the firmware version as V4.2.2.118 and the model as SXR80.
4. Listed WiFi networks include ORBI92-2, ORBI92-3, ORBI92-GUEST, and ORBI92-2_5G.
5. Below the WiFi networks, there are buttons for System, Network, Reboots, Clients, and WLAN, each with a dropdown or selection option for further configuration.
Specifically, you can view and check on the following information:
- Firmware Version
- WiFi Networks configured on the Orbi Pro
- System resources
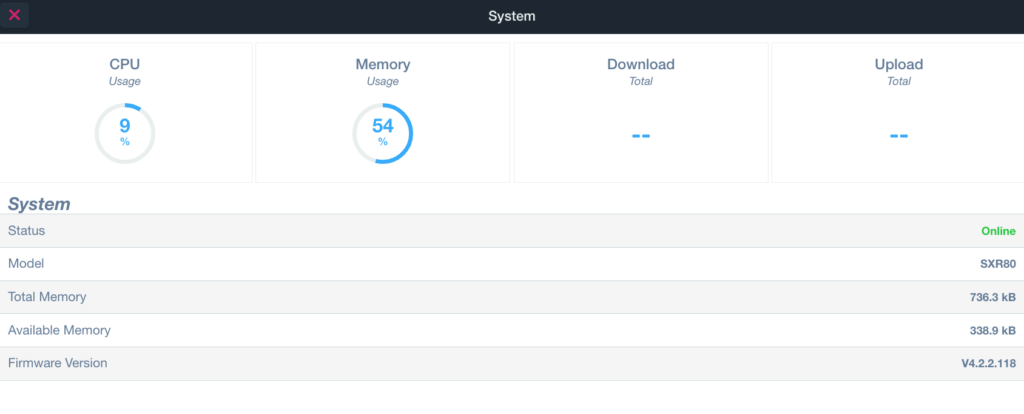
System Overview Panel
1. CPU Usage: Displays the current CPU usage at 9%.
2. Memory Usage: Shows the current memory usage at 54%.
3. Download and Upload Totals: Both values are currently unavailable, indicated by dashes.
4. System Information Section:
- Status: The system status is 'Online.'
- Model: The model number is 'SXR80.'
- Total Memory: Total memory capacity is 736.3 kB.
- Available Memory: Available memory is 338.9 kB.
- Firmware Version: The firmware version is 'V4.2.2.118.'
- WiFi Clients connected to the system (with a breakdown per SSID and Channel information)
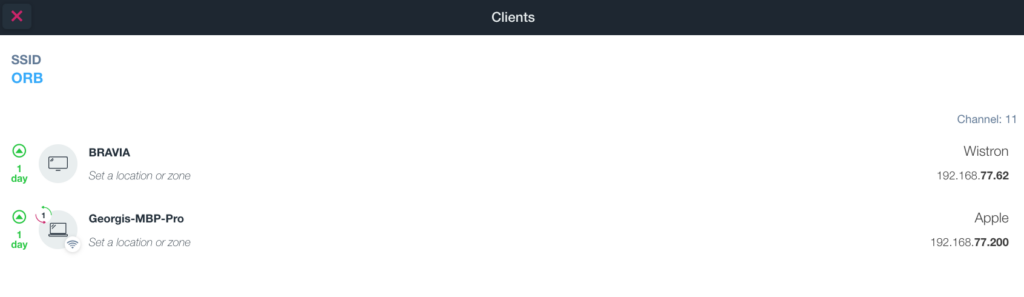
Client Devices Connected to Wi-Fi Network
1. View a list of devices connected to the Wi-Fi network labeled “ORB”. Each device shows its connection time, manufacturer, and IP address.
2. The device “BRAVIA” is connected for 1 day without a specified location or zone. It is manufactured by Wistron with the IP address 192.168.77.62.
3. The device “Georgis-MBP-Pro” is also connected for 1 day, with a location or zone not set. It is an Apple device with the IP address 192.168.77.200.
4. The network is on Channel 11, which can be relevant when troubleshooting connectivity issues.
- SSID configured on the WLAN with details for each one
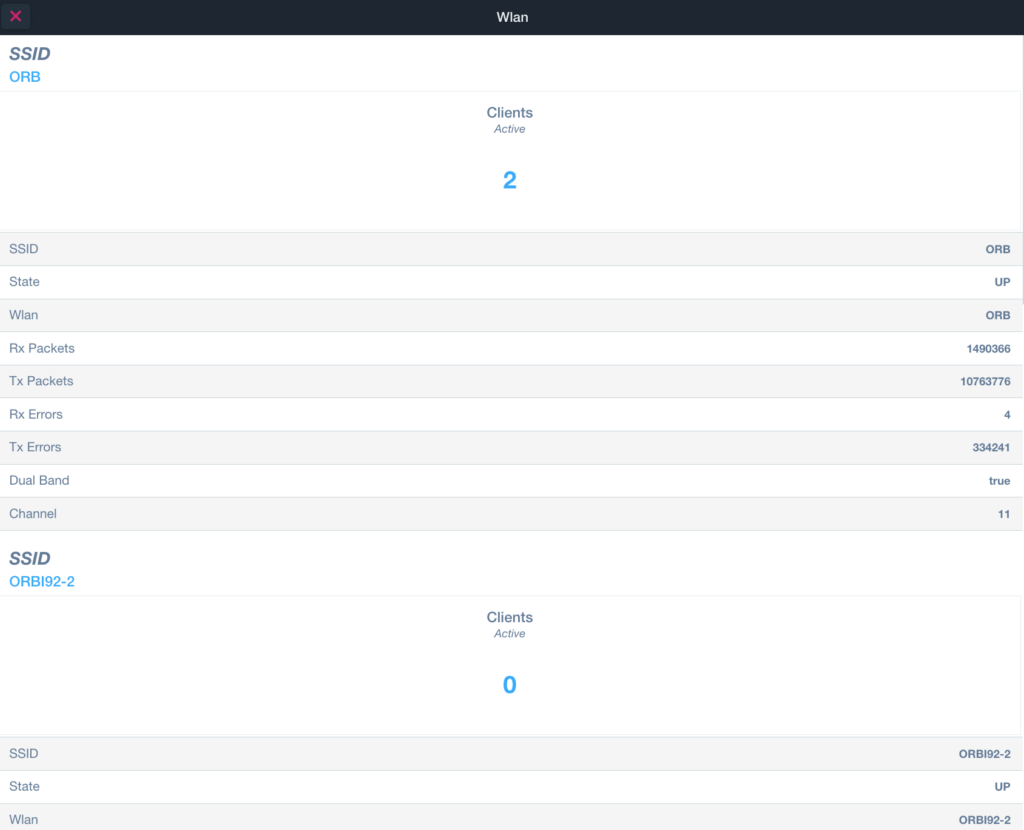
Wi-Fi Network Status Overview
1. The screen displays status information for two Wi-Fi networks. Each section is labeled with "SSID" followed by the network name.
2. The first section is for SSID "ORB" with 2 active clients. Key data includes:
- State: UP
- Network ID (Wlan): ORB
- Received packets (Rx Packets): 1,490,366
- Transmitted packets (Tx Packets): 10,763,776
- Receive errors (Rx Errors): 4
- Transmit errors (Tx Errors): 334,241
- Dual Band: true
- Channel: 11
3. The second section is for SSID "ORBI92-2" with 0 active clients. Key data mirrors the first section with appropriate values for this network:
- State: UP
- Network ID (Wlan): ORBI92-2
Use this information to monitor network performance and troubleshoot connectivity issues based on client activity and error metrics.
Furthermore, we’ll continue to enrich the information we extract from the device.
Insight WAPs
Similarly to the Orbi Pro integration, you can also unlock advanced functionalities on the Insight WAPs (e.g. WAX620). Moreover, the new NETGEAR integration enables you to retrieve additional information from these devices.
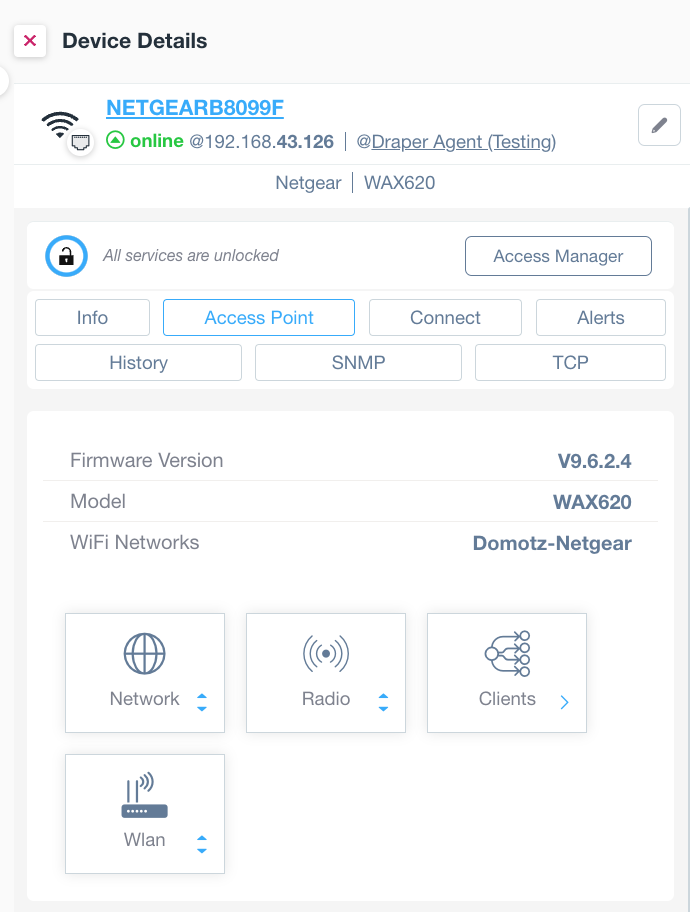
Netgear Device Access Point Details
1. The top section displays the device name "NETGEARB8099F," its online status, IP address "192.168.43.126," and the associated agent "@Draper Agent (Testing)."
2. The device is identified as "Netgear WAX620."
3. Below, tabs are available for "Info," "Access Point," "Connect," "Alerts," "History," "SNMP," and "TCP." The "Access Point" tab is selected.
4. The access status is shown as "All services are unlocked," with an option to open the "Access Manager."
5. Firmware Version is "V9.6.2.4," and Model is "WAX620."
6. Under "WiFi Networks," the network is listed as "Domotz-Netgear."
7. Four icons denote sections for "Network," "Radio," "Clients," and "Wlan." Each icon has a dropdown menu for further options.
To elaborate, you can now get the following information:
- Firmware Version
- WiFi Networks configured on the Insight WAP
- Network configurations, including information on the Mesh network
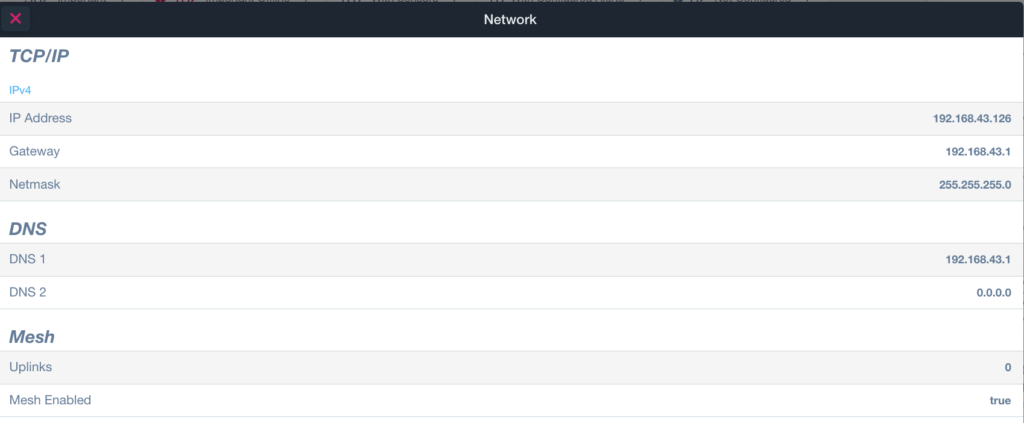
Network Settings Overview
1. Under "TCP/IP," the IP Address is set to 192.168.43.126, the Gateway to 192.168.43.1, and the Netmask to 255.255.255.0. These define the network configuration for accessing and communicating within the local network.
2. In the "DNS" section, DNS 1 is configured as 192.168.43.1 and DNS 2 as 0.0.0.0. These addresses are used for domain name resolution on the network.
3. The "Mesh" settings show "Uplinks" at 0, and "Mesh Enabled" is true, indicating that mesh networking is active, but no uplinks are identified.
- Radio signal with levels
- SSID’s configured on the WLAN with details for each one
Managed Switches
You can now unlock advanced functionalities on NETGEAR Managed PoE Switches (e.g. M4250, M4300, M4500). Thanks to the new NETGEAR integration, you can retrieve additional information about these devices and perform further actions on them.
Firstly, you can now retrieve the entire list of devices connected to each port of the switch, review the traffic on the switch port (including packets lost and errors) and control the PoE status of the port itself:
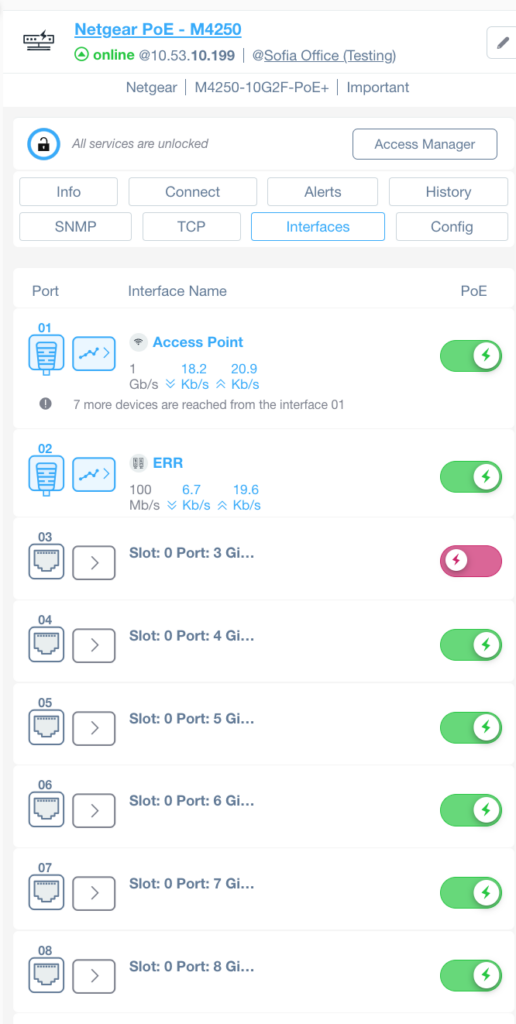
Netgear PoE Interface Overview
1. The header displays the device name "Netgear PoE - M4250," its status as "online," and its IP address "10.53.10.199." A location, "@Sofia Office (Testing)," is indicated.
2. Above the interface list, a section confirms "All services are unlocked," with an "Access Manager" button available.
3. Several tabs are present for navigation: Info, Connect, Alerts, History, SNMP, TCP, Interfaces (currently selected), and Config.
4. The interfaces are listed below:
- Port 1 is labeled "Access Point" with speeds of 1 Gb/s, 18.2 Kb/s, and 20.9 Kb/s. A note indicates that 7 more devices are connected through this interface, with PoE enabled.
- Port 2 is labeled "ERR," with speeds of 100 Mb/s, 6.7 Kb/s, and 19.6 Kb/s, and PoE is enabled.
- Ports 3 to 8 are generically labeled (e.g., "Slot: 0 Port: 3 Gi"), showing PoE status. Port 3's PoE is disabled, while Ports 4 to 8 have PoE enabled.
Secondly, Domotz now includes Network Configuration Management support (configuration file backup, versioning control and restore) for these new models of Managed Switches.
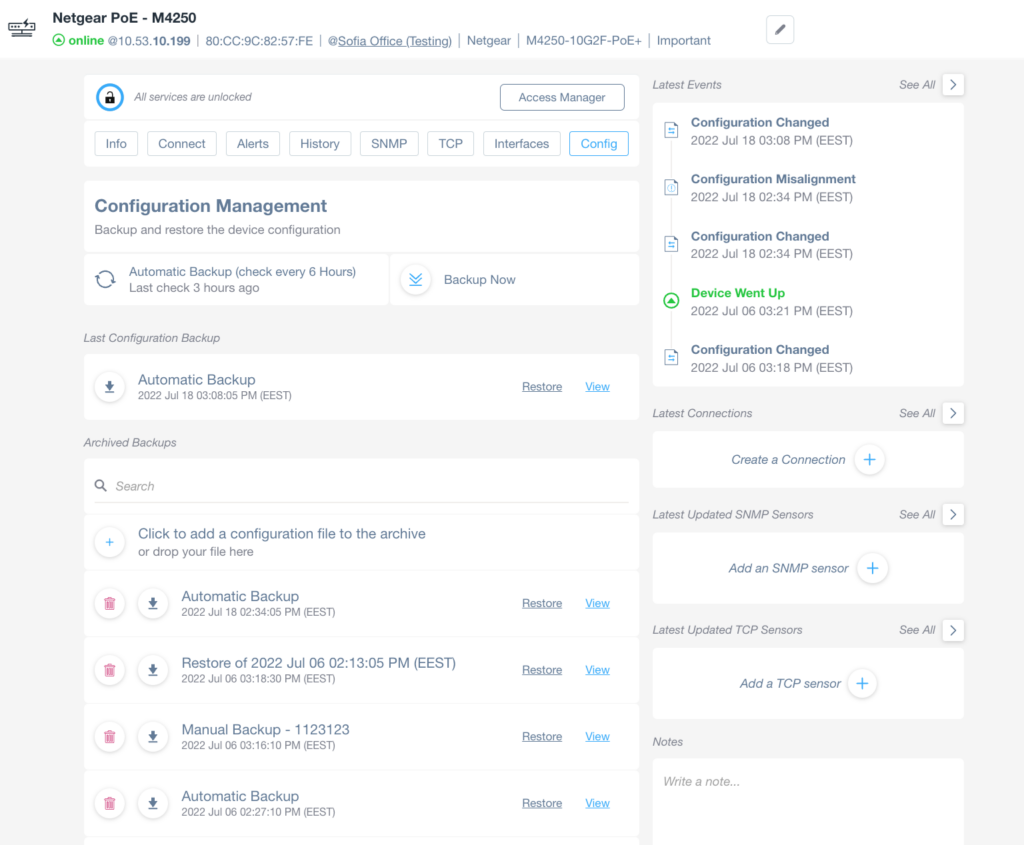
Device Configuration Management Dashboard
1. The dashboard displays the Netgear PoE device status, showing it is online at IP address 10.53.10.199.
2. Access Configuration Management through the "Config" tab for backup and restore options.
3. The current automatic backup is set to check every 6 hours, with the last check 3 hours ago.
4. Under "Last Configuration Backup," view details of the most recent automatic backup from July 18, 2022, with options to restore or view.
5. In "Archived Backups," add a configuration file by clicking to upload or drag and drop directly. Previous backups listed include automatic and manual types, each with restore and view options.
6. The "Latest Events" section displays recent device activities, such as configuration changes and status updates.
7. "Latest Connections," "Latest Updated SNMP Sensors," and "Latest Updated TCP Sensors" offer quick options to create or add new connections or sensors.
8. A "Notes" section is available for writing additional information.
Furthermore, you can choose to configure Domotz to automatically check for any difference in the configuration / setting files, and get notified if something changes. This helps with visibility on unexpected changes which could signify a security risk.
Additionally, you can compare different versions of the configuration files, and restore the previous version of the configuration file if necessary.
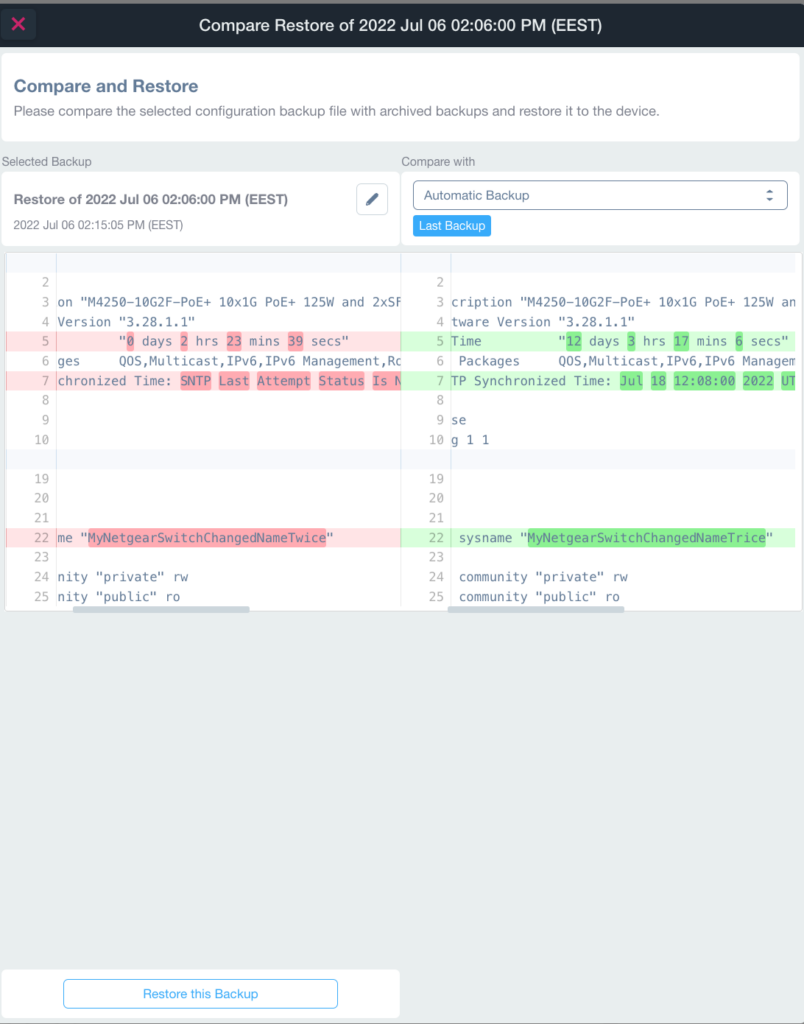
Compare and Restore Configuration Backup
1. The "Compare and Restore" section helps you compare a selected configuration backup with archived backups.
2. The selected backup is titled "Restore of 2022 Jul 06 02:06:00 PM (EEST)" with a timestamp from "2022 Jul 06 02:15:05 PM (EEST)."
3. The "Compare with" dropdown lets you select between "Automatic Backup" and "Last Backup."
4. Two columns display differences between backups in a side-by-side format.
5. Notable differences highlighted include specific time settings, SNTP synchronization, and system name changes.
6. The bottom of the screen shows a "Restore this Backup" button to apply the selected configuration.
Lastly, you can now upload your own (new) version of the Configuration File on the Managed Switch directly from Domotz.
For more information about the settings to enable the Configuration Management in the NETGEAR Managed Switches, please visit this guide.
TLS/SSL Certificate Monitoring
We now include TLS/SSL Certificate Monitoring. Through our Custom Integration Drivers framework you can now monitor the validity of your TLS/SSL Certificates on your websites and other servers.
Monitor your TLS/SSL Certificate, including issuer, validity and remaining days. TLS/SSL Certificate monitoring is available for websties and other services on internal and external hosts.
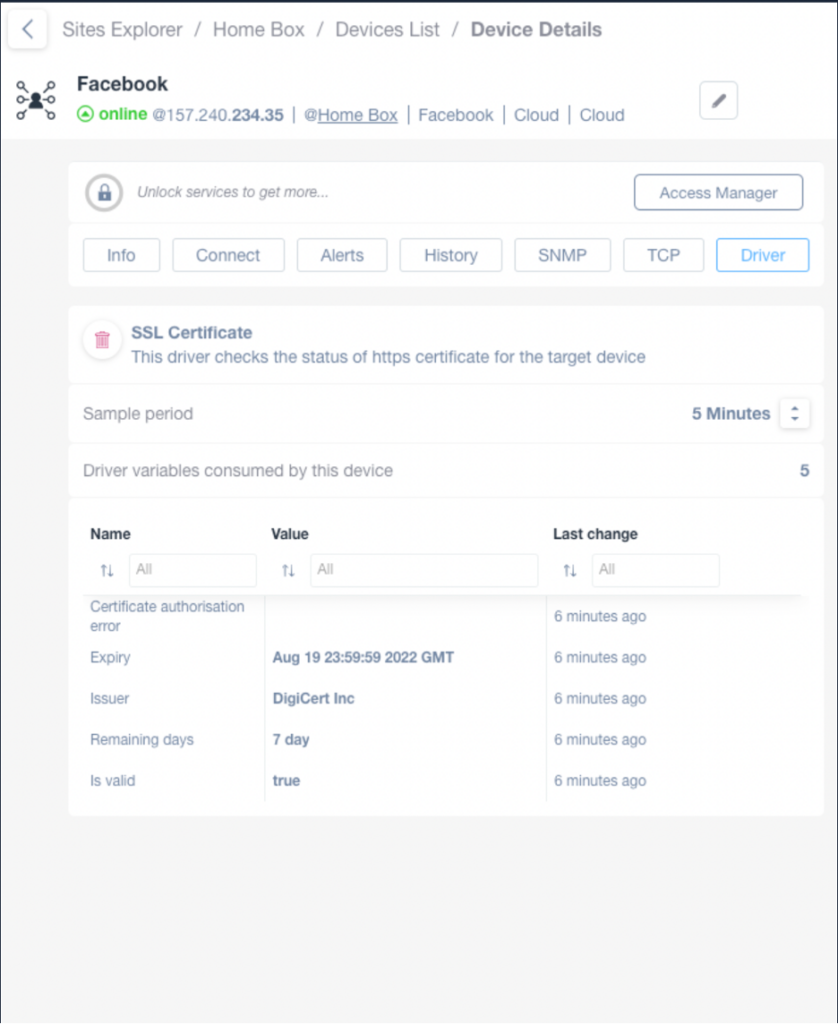
Device Details and SSL Certificate Status Overview
1. At the top, navigate to the "Device Details" section for Facebook, showing the device is online with the IP address 157.240.234.35. Access links to previous sections like Sites Explorer, Home Box, and Devices List.
2. Below, choose from several options for detailed information: Info, Connect, Alerts, History, SNMP, TCP, and Driver. Click "Driver" to access specific driver-related data.
3. The SSL Certificate section provides details on the HTTPS certificate status. The sample period is set to every 5 minutes.
4. The table lists driver variables consumed by the device:
- "Certificate authorisation error" shows no entry.
- "Expiry" indicates August 19, 2022, at 23:59:59 GMT.
- "Issuer" is DigiCert Inc.
- "Remaining days" lists 7 days.
- "Is valid" shows true.
5. The "Last change" for each entry occurred 6 minutes ago.
Here’s what you can do with this new integration:
- Monitor the status of your TLS/SSL Certificate
- Monitor the validity of the TLS/SSL Certificate
- Keep track of the issuer for any TLS/SSL Certificate you manage
- Be ready to issue new TLS/SSL Certificate
For more information, please visit Monitor TLS/SSL Certificate Validity through Domotz.
Improvements
Session Duration within SAML/SSO
You can now configure a Session Duration (pre-defined timeout) which defines how long the token for authenticating on Domotz is valid. The Session Duration setting takes into account the last activity on Domotz. In other words, the token remains valid for the defined Session Duration after the last activity.
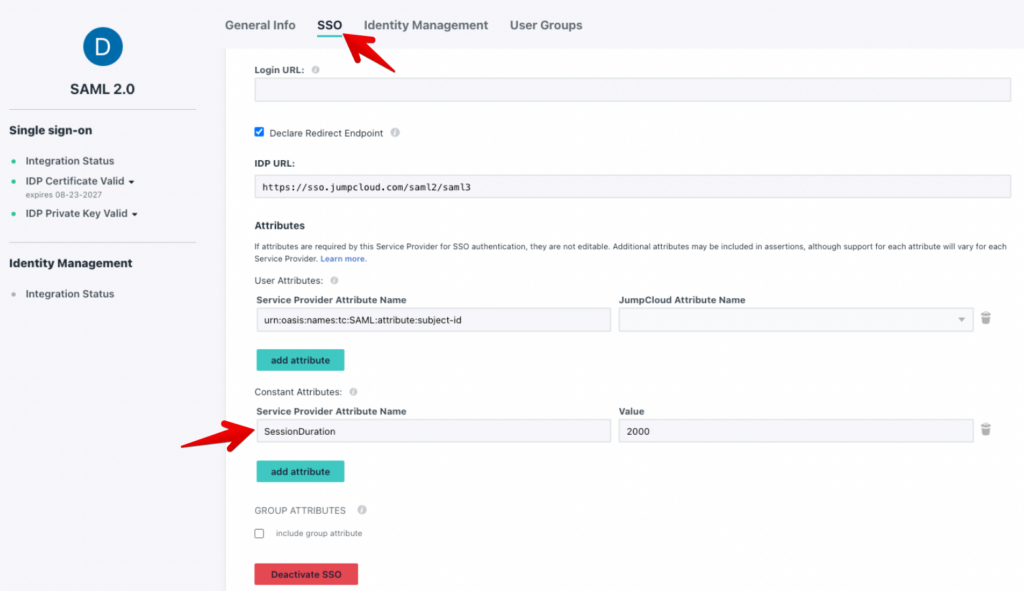
SSO Configuration for SAML 2.0
1. Navigate to the "SSO" tab in the Help Center under the SAML 2.0 section.
2. Verify the "Declare Redirect Endpoint" option is checked.
3. Ensure the correct IDP URL is entered in the field provided.
4. Under "Attributes," in the "User Attributes" section, add necessary attributes by specifying the "Service Provider Attribute Name" and selecting the "JumpCloud Attribute Name" from the dropdown.
5. In the "Constant Attributes" section, ensure "Service Provider Attribute Name" is set to "SessionDuration" with the "Value" set to 2000.
6. Use the "add attribute" button to include additional attributes if required.
7. If managing group attributes, check the "include group attribute" option.
8. Use the "Deactivate SSO" button to disable single sign-on if necessary.
For instance, if you configure a Session Duration for 2 days, the token for authenticating into Domotz will be valid for the 2 days after the last operation within Domotz.
After the 2 days, you’ll need to get a new valid token (by logging into the SAML/SSO system).
For more information, visit the user guide.
Network Configuration Management added for Dell OS6 Switches
Our network configuration management features are now available on Dell OS6 switches to help you stay on top of crucial changes happening in your network infrastructure.
You can now automatically backup the running configuration files of your Dell OS6 devices.
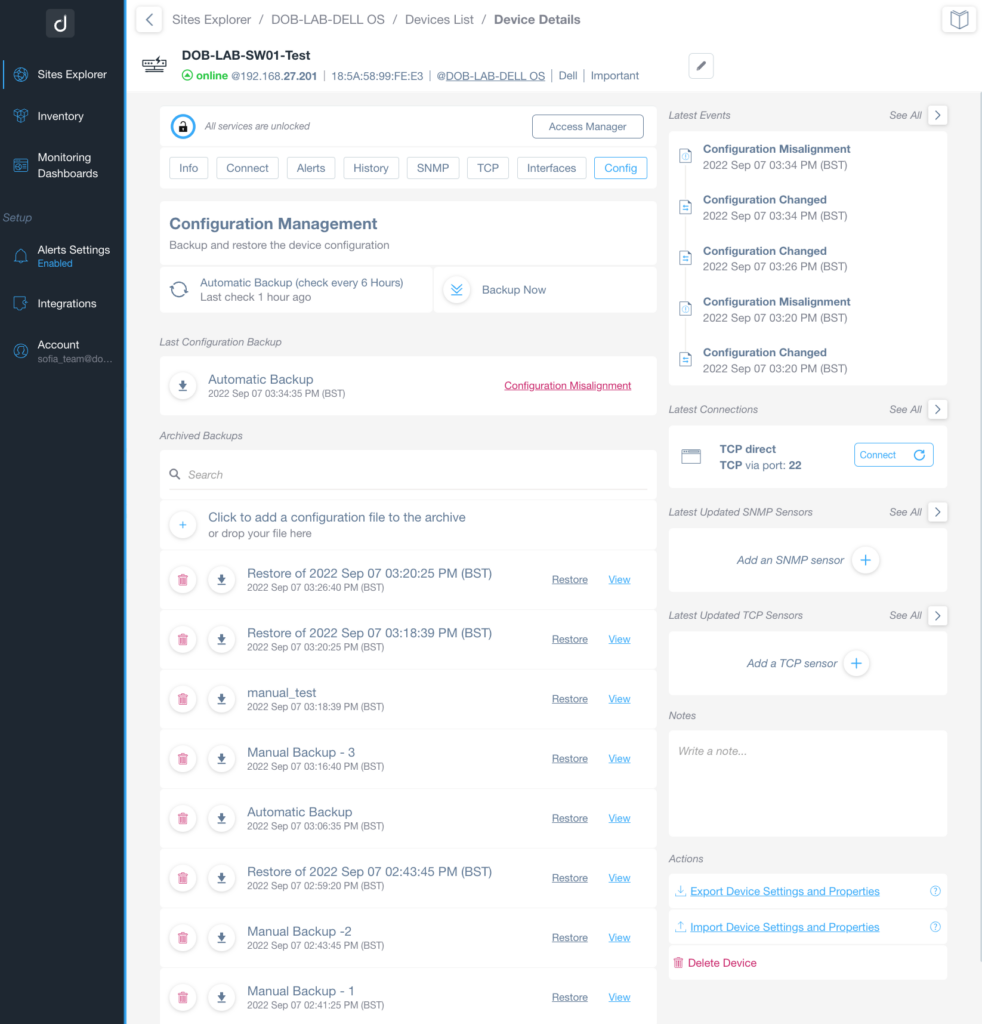
Device Configuration Management Interface
1. The top section displays the device name "DOB-LAB-SW01-Test" along with its status shown as "online" with IP address details.
2. Below are several tabs for navigation which include Info, Connect, Alerts, History, SNMP, TCP, Interfaces, and Config. Click "Config" for configuration management.
3. Under "Configuration Management," there's an option for "Automatic Backup" indicated as being conducted every 6 hours. To perform a manual backup, select "Backup Now."
4. The "Last Configuration Backup" section shows the most recent backup labeled "Automatic Backup" with the date and time.
5. The "Archived Backups" section allows you to view past backups. Each entry includes the backup type, date, and time with options to "Restore" or "View" specific backups.
6. The right sidebar lists latest events such as "Configuration Misalignment" and "Configuration Changed" along with timestamps.
7. Another panel indicates the latest connections and provides an option to connect via "TCP direct."
8. Additional options at the bottom include exporting or importing device settings and the ability to delete the device.
Additionally, Domotz will keep track of the configuration changes over time and notify you if there are any changes to help you easily identify network configuration issues. We’ll also alert you about any differences between the startup configuration and the runtime configuration which means a configuration misalignment.
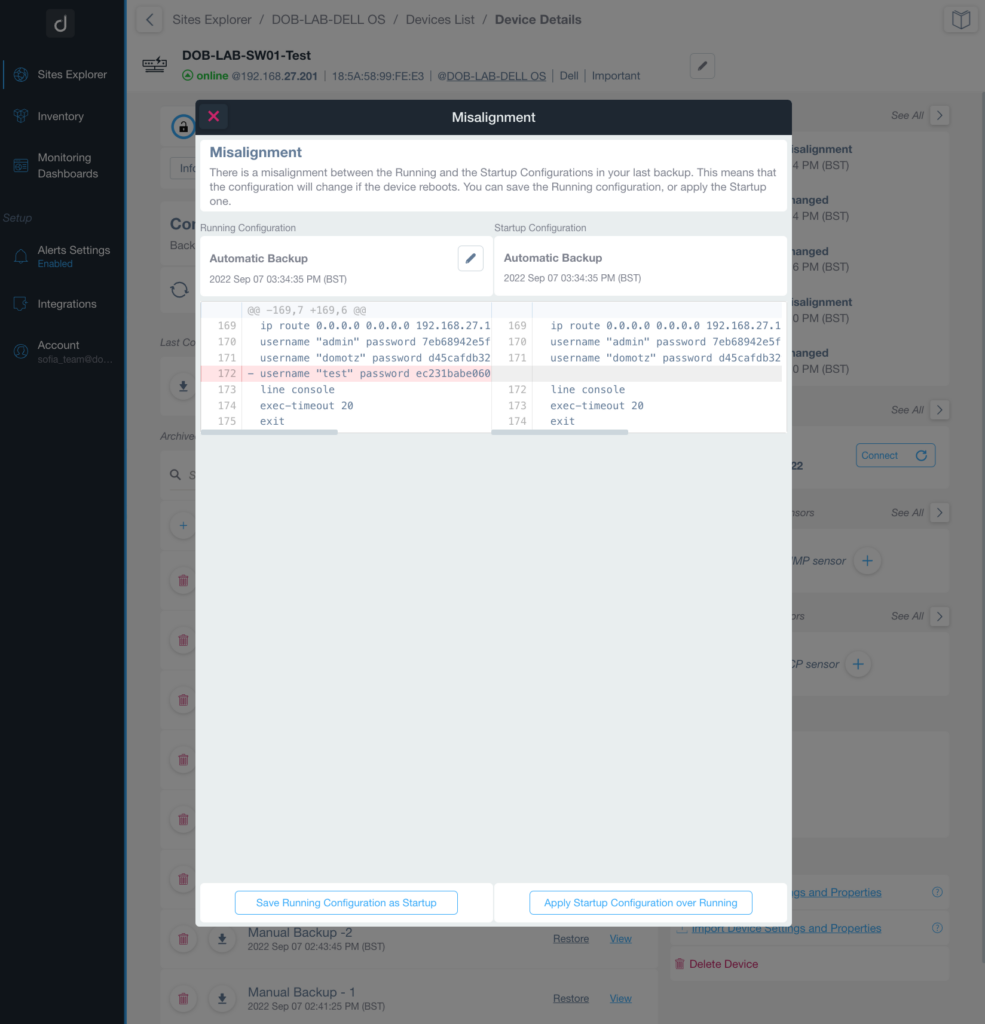
Identifying and Resolving Configuration Misalignment
1. The dialog box indicates a misalignment between the Running Configuration and the Startup Configuration after a backup.
2. The Running Configuration panel on the left shows recent usernames and password entries, highlighting a discrepancy in the latest "username 'test'" entry.
3. The Startup Configuration panel on the right shows an older state without the newer "username 'test'" entry.
4. To resolve this, decide whether to save the current Running Configuration as the new Startup Configuration or apply the existing Startup Configuration over the Running Configuration.
5. Use the "Save Running Configuration as Startup" button to update the Startup Configuration with the Running Configuration.
6. Alternatively, select "Apply Startup Configuration over Running" to revert the current Running Configuration to match the Startup Configuration.
Improved creation of first Monitoring Dashboard and Table
When you visit the Monitoring Dashboard section within Domotz, you’ll now see your first Dashboard pre-created as a suggestion.
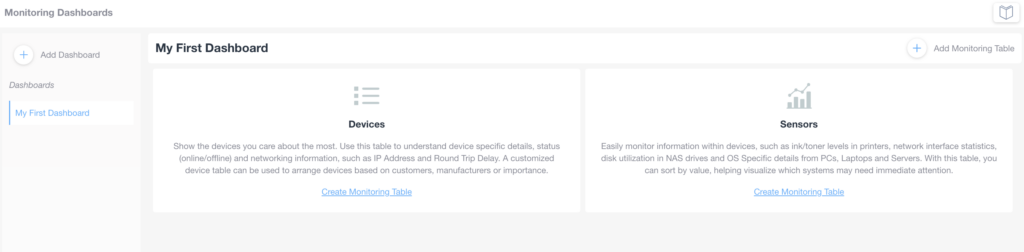
Dashboard Overview with Device and Sensor Monitoring Table Options.
1. Navigate to the "Monitoring Dashboards" section on the left panel. Click on "My First Dashboard" under "Dashboards."
2. To add a new dashboard, click the "+ Add Dashboard" button.
3. In the main area, you have two options:
- "Devices": This section helps you create a table to monitor device-specific details, such as IP Address and Round Trip Delay. Use the "Create Monitoring Table" link to set up a custom table for organizing devices.
- "Sensors": This section allows for monitoring information like ink levels or network statistics. Sort by value to identify systems requiring attention. Click "Create Monitoring Table" to set up.
4. To add a monitoring table at any time, click the "+ Add Monitoring Table" button on the right.
Moreover, we’ll guide you through creating your first Table, by prompting you to select the type of table to create.
- Devices: this table allows you to show the devices you care about the most. You can use this table to understand device specific details, their status (online/offline) and the networking information, such as IP Address. It also allows the monitoring of the Device Response Time (Round Trip Delay) across multiple devices and multiple Agents. A customized device table can be used to arrange devices based on customers, manufacturers or importance.
- Sensors: this table allows you to monitor information within devices, such as ink/toner levels in printers, network interface statistics, disk utilization in NAS drives ,OS Specific details from PCs, Laptops and Servers and more. With this table, you can sort by values, helping visualize which systems may need immediate attention.
Inventory Dashboard improvements
For those using the Enterprise plan, the Inventory Sites table now shows the Team Name along with the Team Master and the email address of the owner for each Domotz Agent.
This helps large organizations and enterprises better manage multiple Sites monitored through different Domotz Agents across different teams.
Moreover, Domotz App and WebApp is locally storing the last area of the Dashboard visited (e.g. Organizations vs Sites vs. Devices), so that you can pick-up your work from where you left off.
Finally, in the Organization tab, we have added a new “Tile” with the number of sites that are still not connected to an Organization.
Additional MIBs available in the Domotz Database
Additional MIB files are available for the following devices. Additionally, you can search for their OIDs from Domotz:
- CHRISTIE Projectors
- NETGEAR (40 MIBs)
Fix
We’ve fixed the following issues:
- An issue in the synchronization of data was preventing having the real-time information in the Inventory Dashboard section.
- When an SNMP custom sensor required the .0 at the end of the OiD, the Domotz app was returning the correct values in the configuration, but not in the periodic monitoring.
- In some circumstances, the possibility to discover devices across multiple VLANs using the “Big Network” capability (to scan each VLAN with a subnet up to a /16) was prevented.
- An issue was preventing to delete old Team Members (previously updated with a different email address).
- An issue in the external VAT Validation system (third-party) was preventing some European users to add billing details.
- The pagination mechanism for the association of Agents to Customers in the Kaseya and Datto/Autotask integration was not taking into account the already associated agents when moving from one page to the other.
- Custom Drivers: Console log with null/undefined values caused the crash of the driver sandbox execution environment.
Known limitations
- Monitoring Dashboards are currently limited to Monitoring Tables as Widgets. Furthermore, they do not report some variables (e.g. the ones created by the Custom Drivers, Pre-Configured SNMP Sensors and OS Monitoring) within the Monitoring Tables.
- Luxul Router-based Agents do not support VPN on demand. To elaborate, we’ll add this capability as soon as Luxul’s team provides us with the required API resources.
- Devices with multiple network interfaces (multiple MAC addresses) can’t be merged into a single device. This affects some types of switches that appear as multiple instances on Domotz when VLANs are configured.
- The static IP address on the Domotz Box cannot be configured before configuring the Agent.
- DHCP cannot be leveraged on additional VLANs on the Domotz Box.
To conclude, these release notes cover the changes in the Domotz Pro service since the previous one. Furthermore, these changes include Domotz Pro cloud, Domotz Agent, and Domotz Pro App.
Lastly, to learn more about check out our network monitoring software or check out our Know Your Networks Blog.