Purpose of Account Setup Article
This onboarding article on setting up your account on Domotz will help you establish a process to optimize your work flow.
We cover the following topics in our Account Setup guide:
- Branding
- Team Management
- SSO
- Documentation systems
- Monitoring Dashboards
Furthermore, please note that this article assumes that you’ve done your Domotz trail and now want to start using the software as part of your stack.
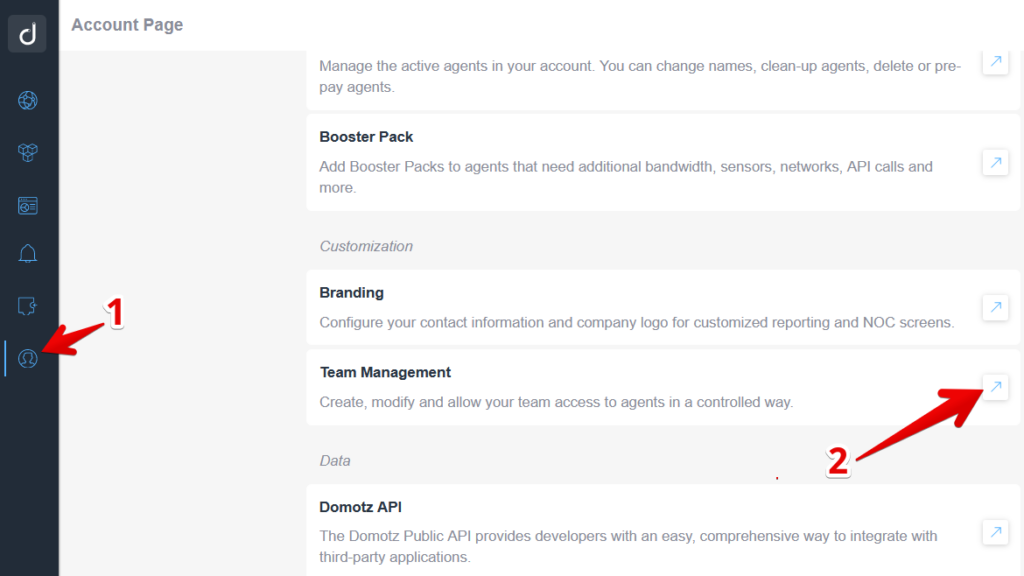
Branding
Next in the account set-up guide we cover branding. When it comes to branding the following tab allows you to configure your contact info and upload a company logo for display in the reports we generate:
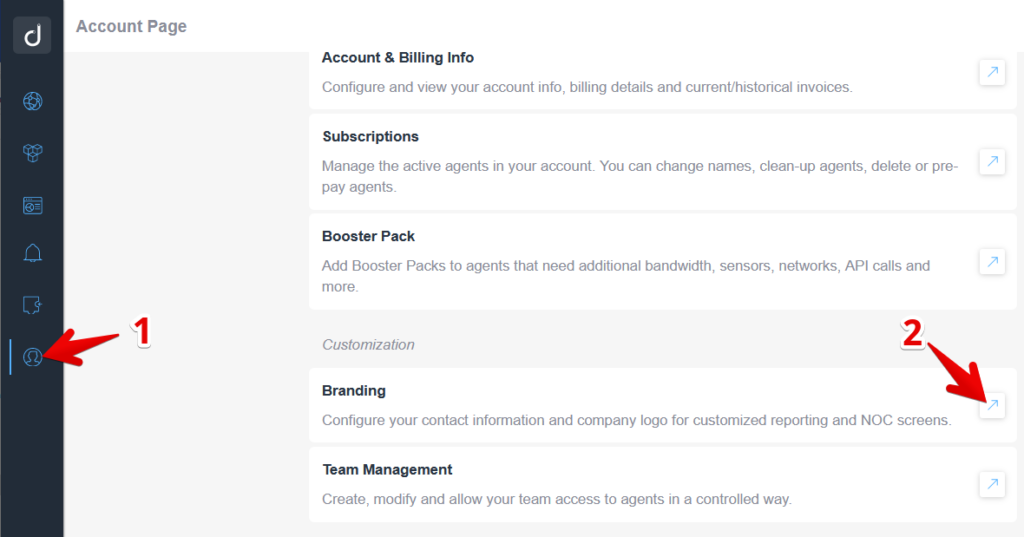
Or you can configure these directly from the Portal (https://portal.domotz.com), under the Account -> Branding tab:
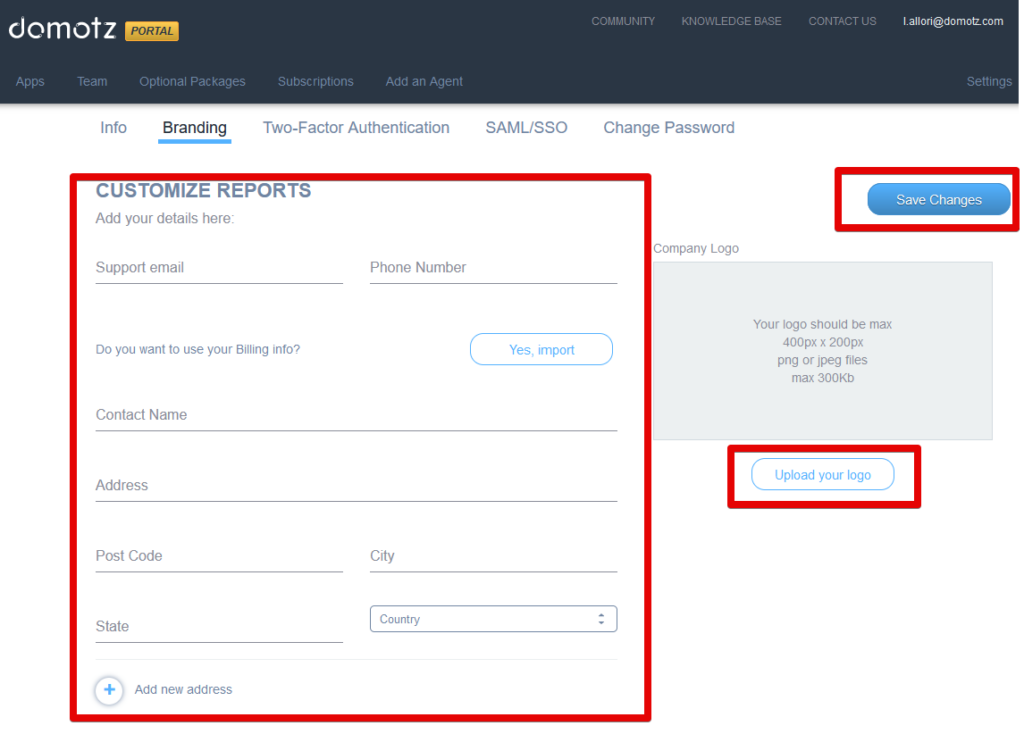
Don’t forget to save your changes.
Team Management
You can create/manage accounts for your team and your clients here:
Find more information about user roles in Domotz here: https://help.domotz.com/user-guide/team-management/
How to setup SSO/SAML
Domotz supports SAML/SSO authentication with the following systems:
- Microsoft Azure Active Directory
- Evo
- Okta
- Jumpcloud
For more information on how to configure SAML/SSO please see:
https://help.domotz.com/user-guide/saml-sso-authentication/
Manage Organizations and Agents
If you are an MSP, and one of your client has more than one site/network which you’ll monitor, you can group your agents by using the Organization tab in the Inventory Dashboard:
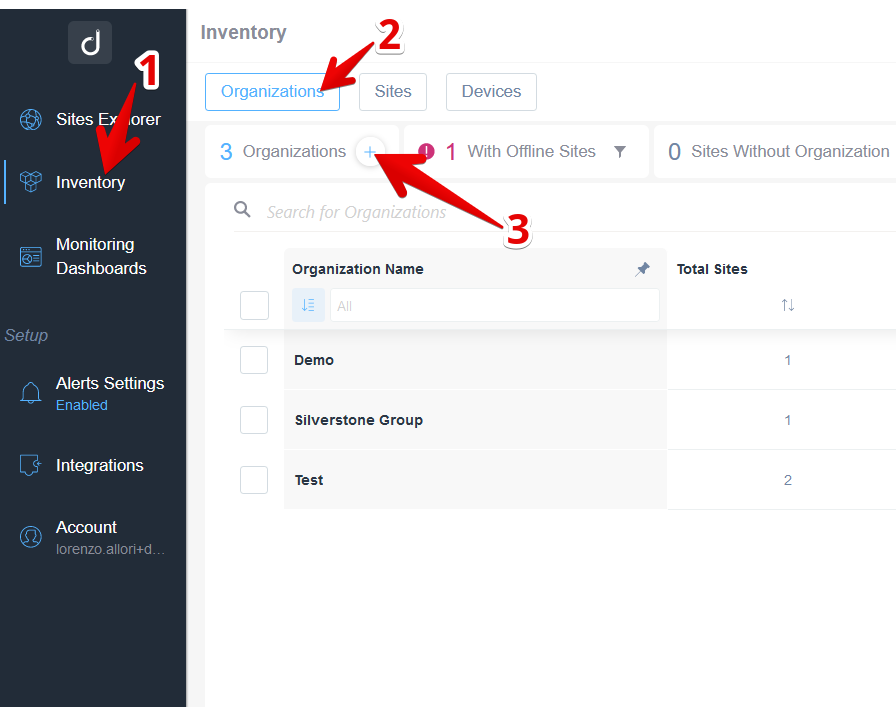
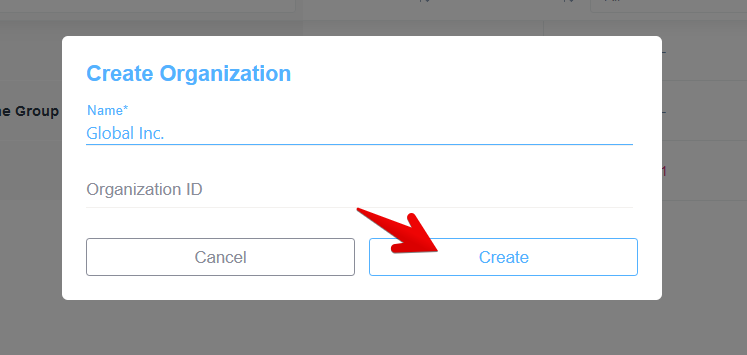
Once the + button will be clicked you will be able to create a new Organization:
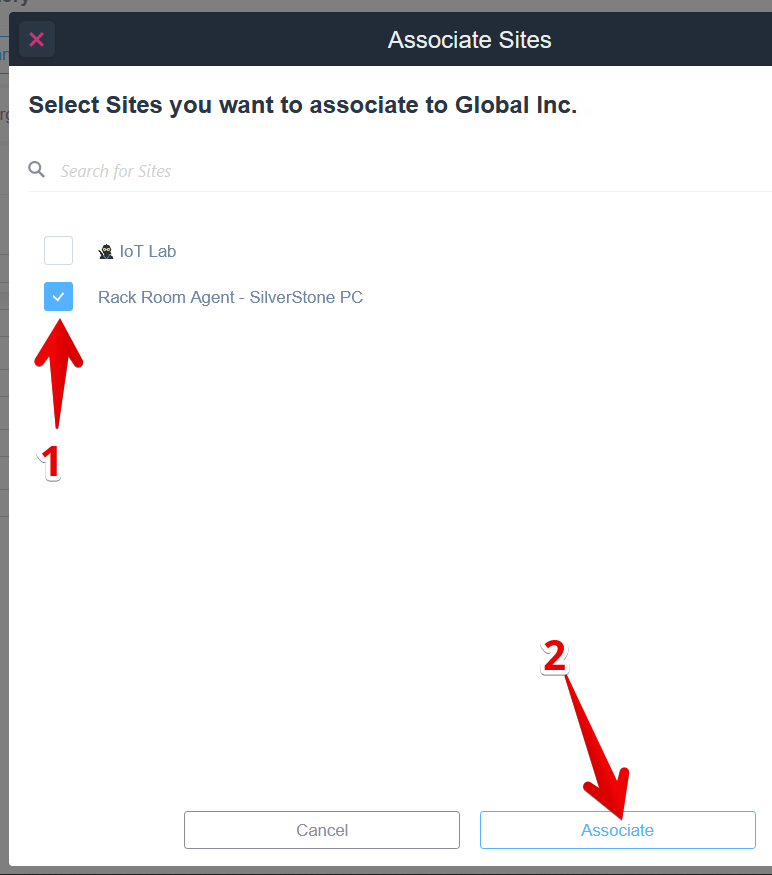
And then you can associate the chosen sites/networks (Domotz Agents) to that Organization:
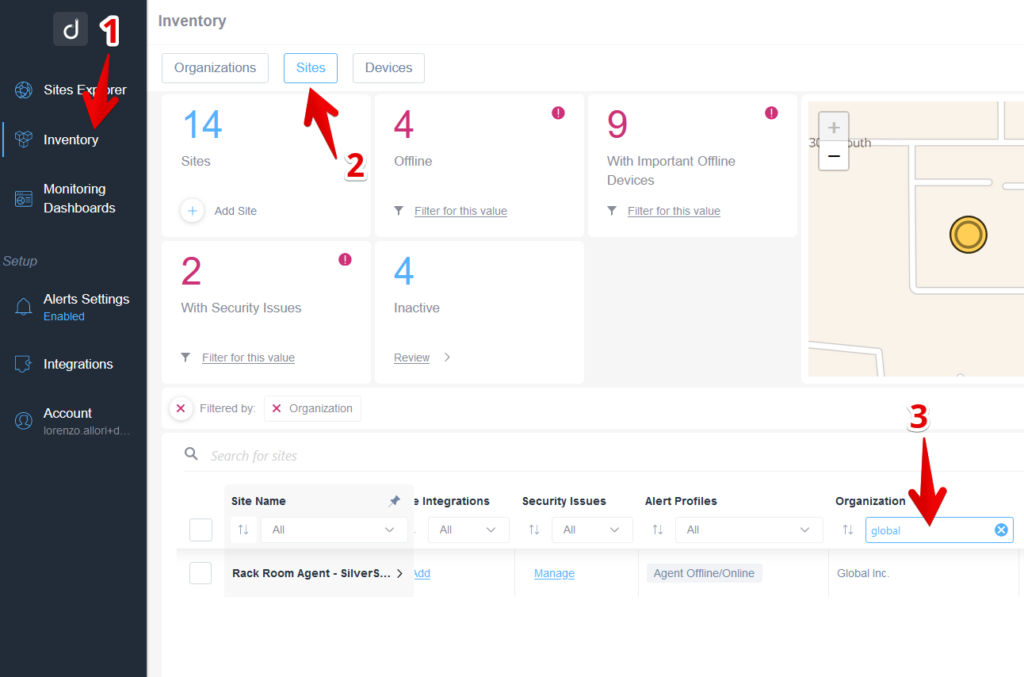
Once you associate these, you will be able to filter for the sites which belong to a specific organization by accessing the Inventory Dashboard Sites tab and apply a filter in the Organization column:
You can also select directly the Sites/Networks (Domotz Agents) belonging to an Organization, by clicking directly on the Review button (mouse over the Total Sites column):
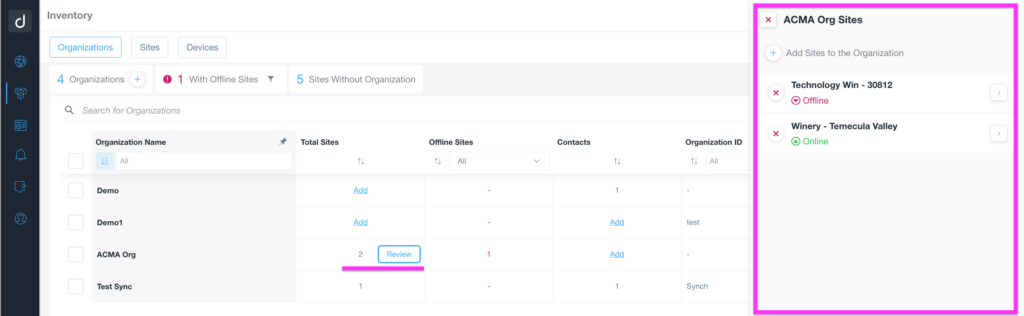
A right tab will appear with the list of Sites belonging to that Organization, the status and a quick link to the details for that specific Site/Network.
Ticketing Systems and Shared Alerts
In Domotz there are two types of alerting systems:
1) Shared Alerts (will notify the entire team, or route the alerts to a ticketing or external system in general)
2) Personal alerts (will notify only the user within a specific Team/Account)
In others words the second type (Personal Alerts), will only trigger notifications to be sent to you. Shared alerts instead will notify your entire team. So, if you are an MSP and have team members, you would probably choose the first type of alerting system.
Additionally, if you are using a ticketing system you might want the system to receive alerts about network and device events. You should choose shared alerts, if you want to send notifications to a ticketing system.
To send alerts to your ticketing system, you’ll need to connect it with your Domotz account.
Creating a Contact Channel
By accessing the “Alerting” section in the Domotz App, you can see all the Ticketing Systems we support. Choose click on ‘Connect Account’ to set-up your ticketing system with Domotz.
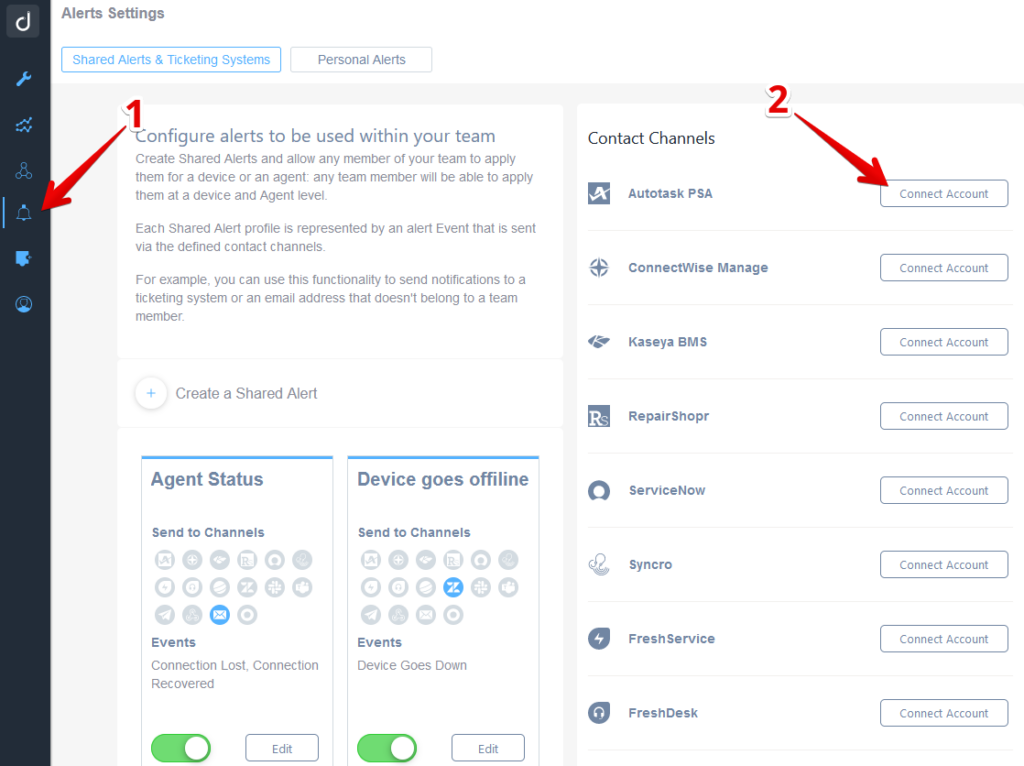
Clicking this will give you access to the configuration guide for connecting your ticketing system:

Supported Ticketing Systems
Domotz integrates with many different types of ticketing software.
The list of the ticketing systems we support along with the corresponding ‘Connect’ button can be seen on the right side of the previous screen.
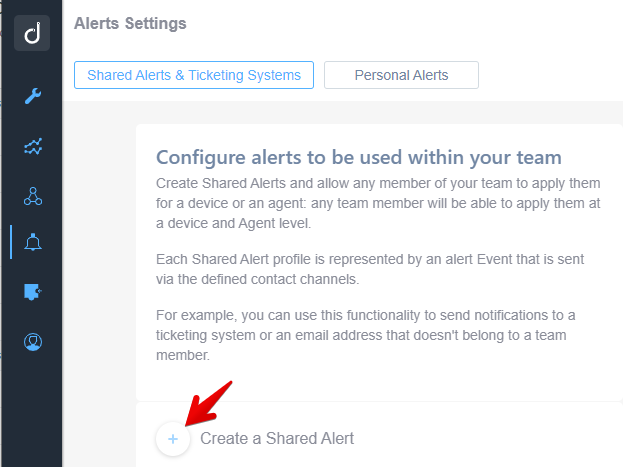
Creating a Shared Alert Profile
Now, you can create a Shared Alert Profile that will deliver your chosen alert events to the Contact Channel(s) that you just chose.
After defining the Name and the Contact channel, you can select the events to monitor:
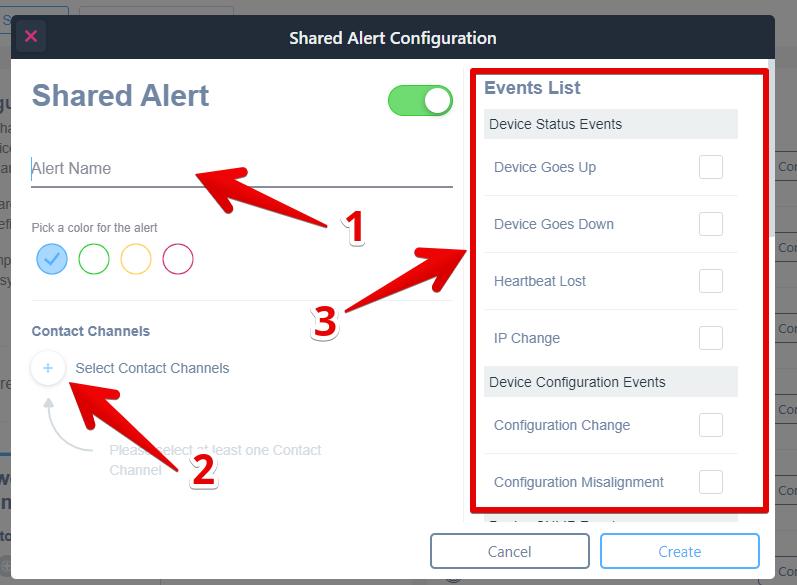
Please read this guide in order to understand when and how to use each event https://help.domotz.com/user-guide/shared-alerts-events-list-explained/
Documentation Systems
It is very useful to enrich your Documentation Systems with the data coming from Domotz such as location, zone, status of the device, device name, MAC address, IP address, etc.
To be able to synchronize the documentation system of your choice, please see the following links:
IT Glue: https://help.domotz.com/user-guide/itglue-integration/
IT Portal: https://help.domotz.com/user-guide/it-portal/
Hudu: https://help.domotz.com/user-guide/hudu-integration/
Syncro: https://help.domotz.com/user-guide/syncromspdoc-integration/
Cloudradial: https://help.domotz.com/user-guide/cloudradial/
In general, you can leverage the Domotz Public API to extract the information out of Domotz to populate the Documentation system of your choice:
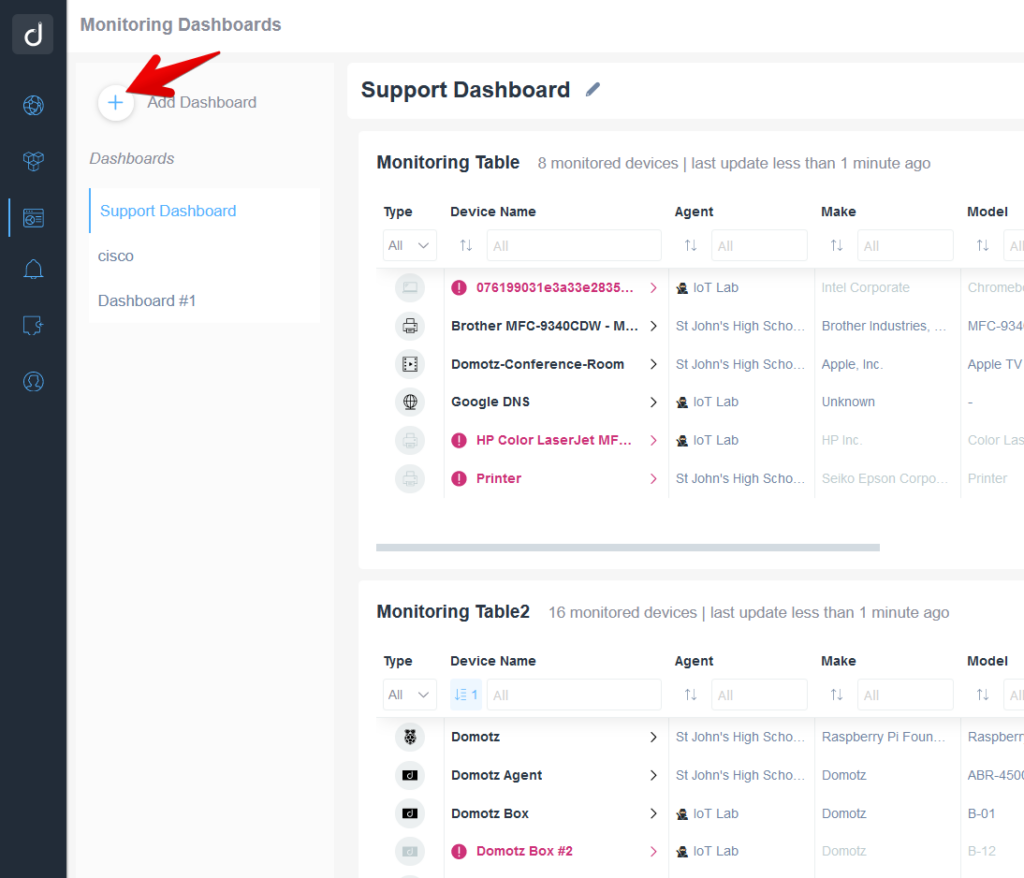
Monitoring Dashboard Configurations
The Monitoring Dashboard is a flexible, multi-tenant view of all your devices as well as any sensors associated with your devices. Customizing your dashboards allows you to view the systems and sensors that you think are most important. Additionally, you can configure your dashboards in a way that makes sense in terms of how you work.
You can create multiple views by adding dashboards to the left column:
Additionally, you can add multiple tables to your dashboard by using the “Add Monitoring Table” button in the upper right. You will then have the option of adding a table specific to devices or a table of sensors.
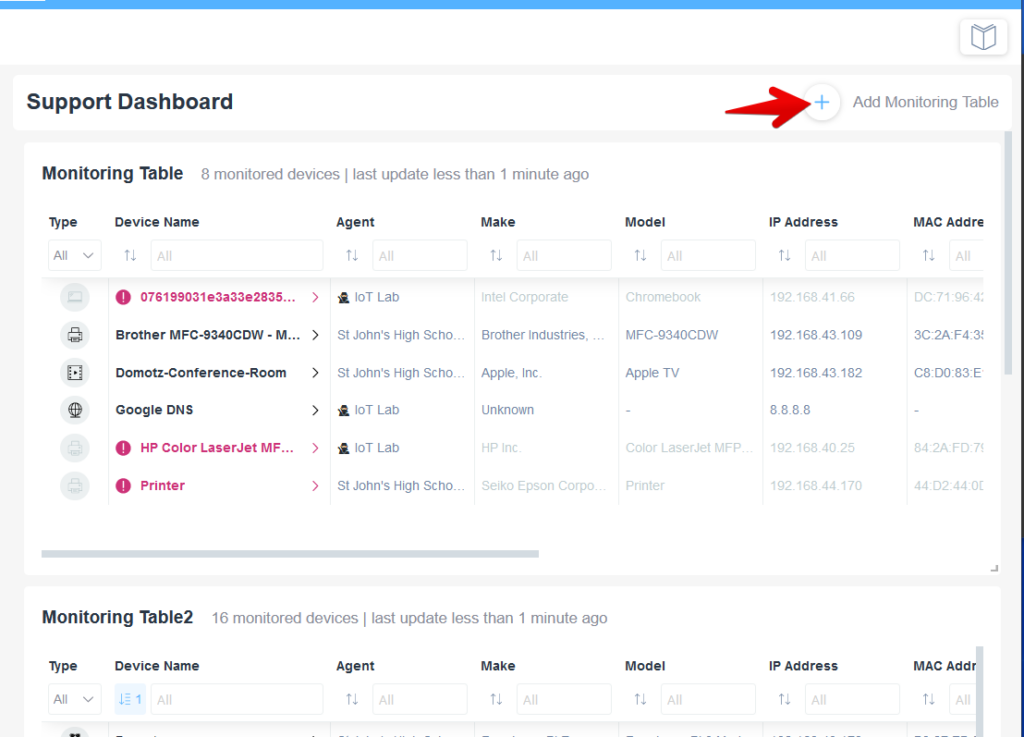
Within each Dashboard you can add multiple tables that can be sized based on what devices and data you’d like to have shown. The monitoring table sizes are quite flexible. On the other hand, consider that if the data goes beyond the table size, you can scroll to see the rows and columns as appropriate.
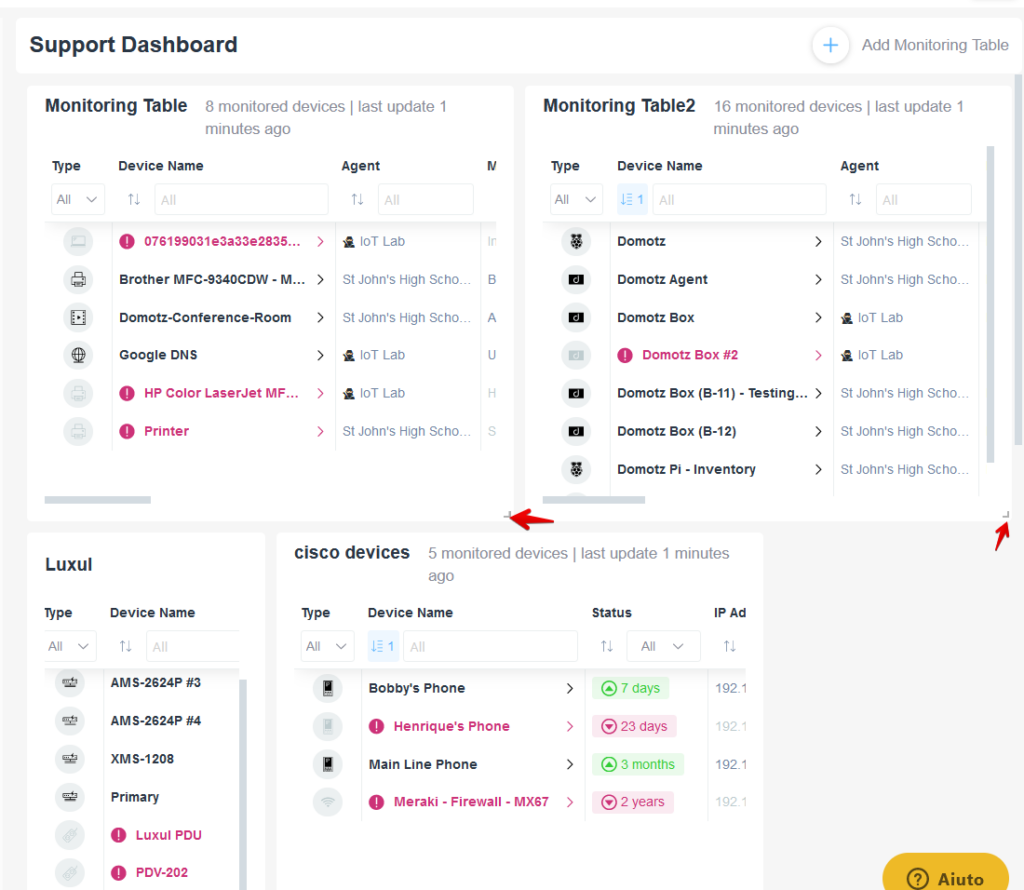
A good practice is to consider what data you would like to view in the table and how this data will be sorted. You can prioritize the sorting of columns to organize your information in a way that helps your teams efficiency.
Please read this guide on how to properly set-up the Monitoring Dashboards: https://help.domotz.com/user-guide/monitoring-dashboards/
Network Architecture Considerations
When deploying Domotz on a network there are two main questions to ask:
- How many Agents should I deploy in a network?
- Where in the network should I plug in a Domotz agent?
The answers depends on how your network is set-up.
In this blog article on setting up networks with subnets and VLANs, we explain the most common network set-ups and how to approach them with Domotz.