

We have exciting new features, SNMP templates, custom scripts, and improvements available on Domotz. This month’s exciting new updates include editing and deleting the Custom Filters directly on the Monitoring Dashboard and Inventory Dashboards, search metrics in the Monitoring Dashboards, synchronization of Serial Numbers with Syncro, new Fortinet Switches and Firewall support, and more.
In summary, here’s what’s new and improved on Domotz this month.
- Edit and delete Custom Filters
- Synchronize Serial Number Information with Syncro
- Enhanced Metric Search for Monitoring Tables
- Configure Custom Script Parameters via Public API
- Email in case of Configuration Management failure
- Additional MIBs available in the Domotz Database
- New SNMP Templates (Supermicro, Watchguard)
We are always improving Domotz and welcome your feedback. Please contact our support team at support@domotz.com for help or suggestions.
New features
Network Configuration Management added for FortiGate Firewalls
Our network configuration management features are now available on FortiGate Firewalls to help you stay on top of crucial changes happening in your network infrastructure.
As you can see in the following image, you can now automatically backup the running configuration files of your FortiGate Firewalls.
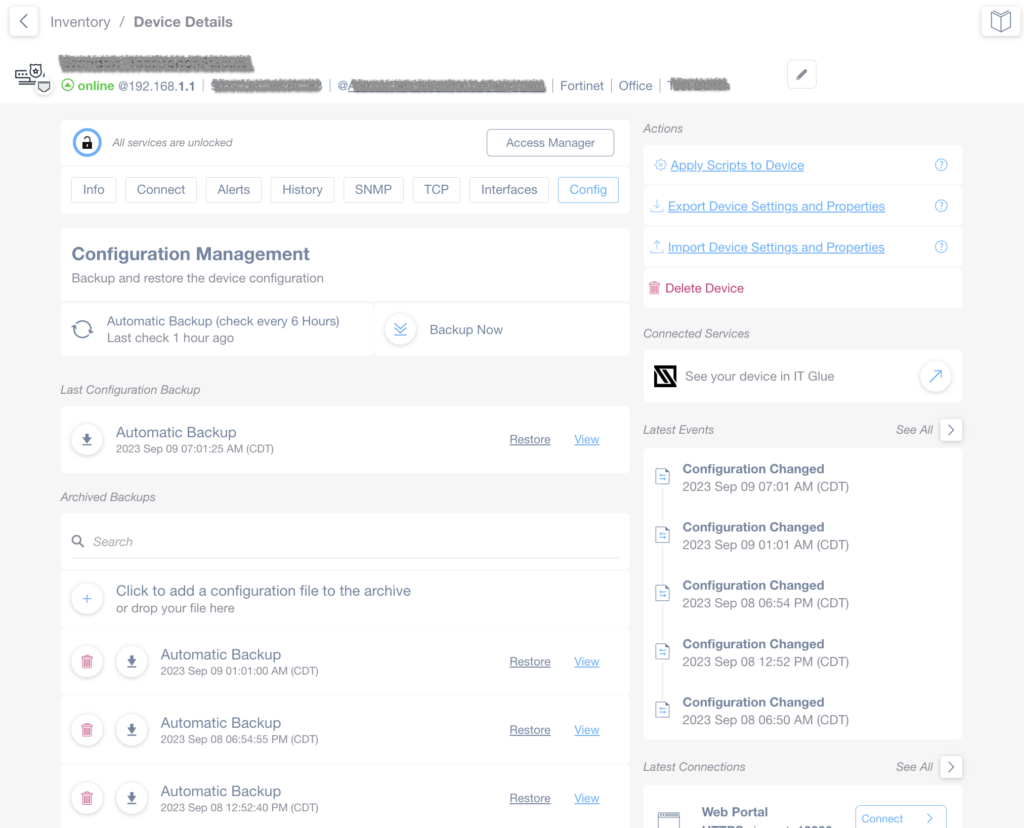
Device Details and Configuration Management Interface
1. At the top, a device is labeled as online with an IP address of 192.168.1.1 and associated details like provider and office location.
2. Main menu options include Info, Connect, Alerts, History, SNMP, TCP, Interfaces, and Config. Use these to manage device settings.
3. Under "Configuration Management," view the status of automatic backups, set to check every six hours, with the last check occurring an hour ago. Use the "Backup Now" button for immediate backups.
4. In "Last Configuration Backup," details of the most recent automatic backup are shown with options to Restore or View.
5. The "Archived Backups" section lists past backups with timestamps, including options to Restore or delete. You can also add a new configuration file to the archive.
6. Actions on the right offer options to Apply Scripts to Device, Export, and Import Device Settings, or Delete Device.
7. Connected Services provide access to view the device in IT Glue.
8. The "Latest Events" section logs recent configuration changes with timestamps.
9. "Latest Connections" lists recent connection methods with options to Connect as needed.
Additionally, Domotz will keep track of the configuration changes over time and notify you if there are any changes to help you easily identify network configuration issues. We’ll also alert you about any configuration misalignment.
For detailed guidance on configuring this functionality, please refer to our documentation.
FortiSwitch PoE control and Port Mapping
We are thrilled to announce that we have added FortiSwitch PoE Control and Port Mapping to our network management capabilities suite. Domotz now supports Fortinet FortiSwitch models, enhancing the ability to manage your network infrastructure efficiently.
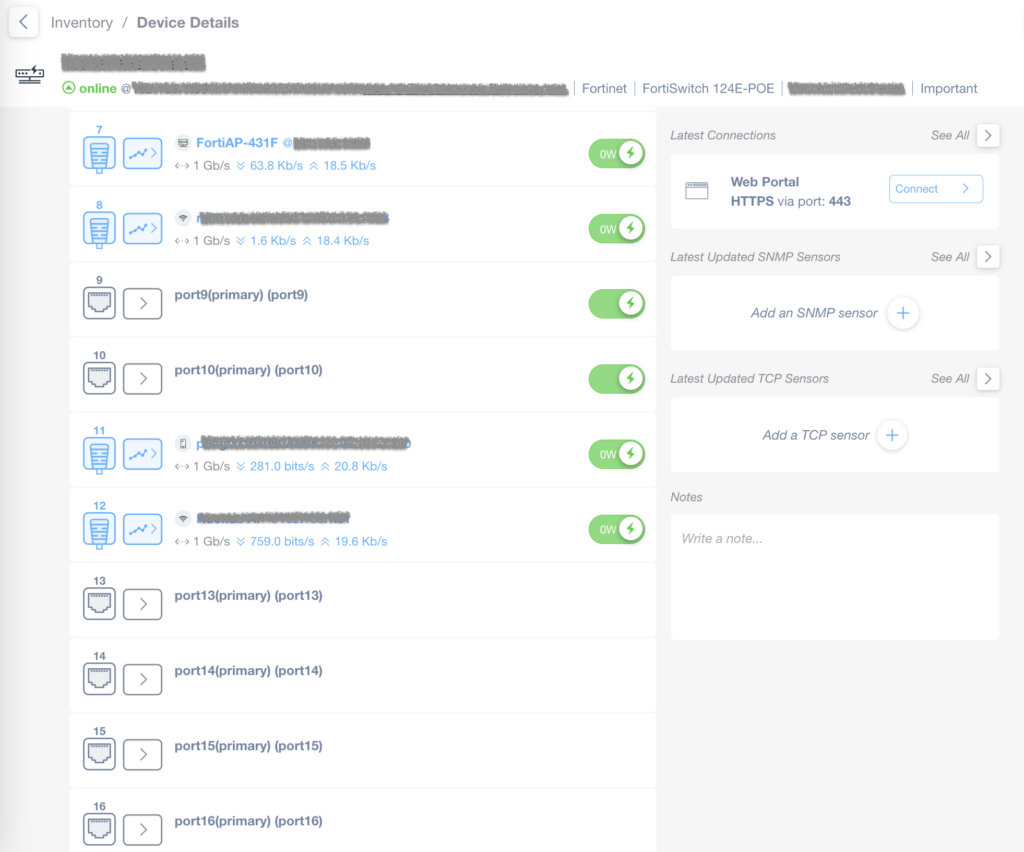
Device Details Interface Overview
1. The interface shows a device listed as online with status information, including the device's specific model.
2. The main section lists several network ports, each labeled as "primary" with corresponding port numbers, like port9 through port16.
3. For each port, statistics are displayed, such as network speed (e.g., 1 Gb/s) and data rates in both bits and bytes per second (e.g., 63.8 Kb/s, 18.5 Kb/s).
4. The right side features a "Latest Connections" section with a "Web Portal" HTTPS link available for connection via port 443. A "Connect" button is provided.
5. Additional sections allow adding SNMP and TCP sensors. Use the "+" buttons to add new sensors as needed.
6. A "Notes" section at the bottom right is available for writing or managing custom notes related to the device.
With this feature, you can automatically extract the list of devices connected to each port of FortiSwitches. This invaluable Port Mapping functionality provides a clear and detailed overview of which device is connected to which port, simplifying network troubleshooting and device identification. As a matter of fact, this information is also used in the Automatic Network Topology Map.
Moreover, for switches equipped with Power over Ethernet (PoE) capabilities, Domotz enables you to exercise precise control over the PoE status of each port. Whether you need to power cycle a device or manage power allocation efficiently remotely, this feature helps you to take immediate action.
The PoE control functionality is accessible both within the list of interfaces for the specific switch and in the device view for the device connected to that port. This seamless integration ensures that you can easily make informed decisions and manage your PoE devices.
We are committed to enhancing your network management experience and providing you with the tools you need to maintain a resilient and efficient network. Your feedback is essential in shaping these improvements.
Please consult our comprehensive instructions on leveraging FortiSwitch PoE Control and Port Mapping.
New Custom Scripts
You can use the custom scripts to monitor and manage network-connected devices, cloud services, and web applications. By using standard network protocols, these scripts will allow you to retrieve valuable data and execute actions on the monitored devices and services.
This month, we released the following:
- APC – UPS
- iDRAC
- IBM iSeries – AS400
APC – UPS
You can apply our custom script to monitor an APC UPS Room Temperature and Humidity. That script uses SNMP to retrieve detailed information about room temperature and humidity where an APC UPS resides. The script has been validated and tested on APC Smart-UPS X 3000 version 6.8.2. You can find this script in our Library or on github. Just customize the drivers to fit your needs.
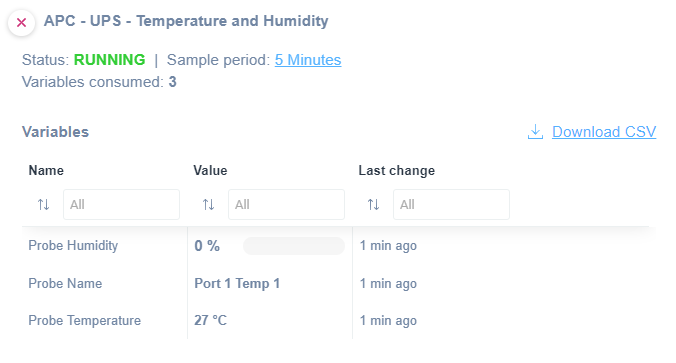
APC UPS Temperature and Humidity Monitoring
1. The title indicates monitoring of temperature and humidity for an APC UPS system.
2. The status is shown as "RUNNING" in green, indicating normal operation.
3. The sample period is set to 5 minutes, and three variables are being consumed.
4. Under "Variables," a table is displayed with three columns: Name, Value, and Last change.
5. For "Probe Humidity," the value is 0%, with the last change noted 1 minute ago.
6. "Probe Name" shows "Port 1 Temp 1," updated 1 minute ago.
7. "Probe Temperature" is recorded at 27°C, also updated 1 minute ago.
8. There is an option to "Download CSV" on the right side, allowing data export.
iDRAC
You can apply our new scripts to monitor Physical HDs, RAID, Memory, Fans, and Processors on a Dell Server equipped with an iDRAC controller. They use SSH as a communication protocol.
You will be able to monitor the following:
- Physical Hard Drives status and information
- Raid status and configuration
- Memory status and information
- Fans status and information
- Processors status and information
The scripts have been validated and tested on iDRAC 7, firmware 2.6.5.
Physical Hard Drivers status and information
- Type
- Description
- Primary Status
- Raid Status
- Raid Types
- Size
- Used Size
- Free Size
- Manufacturer
- Model
- Bus Protocol
You can find this script in our Library or on github. Just customize the drivers to fit your needs.
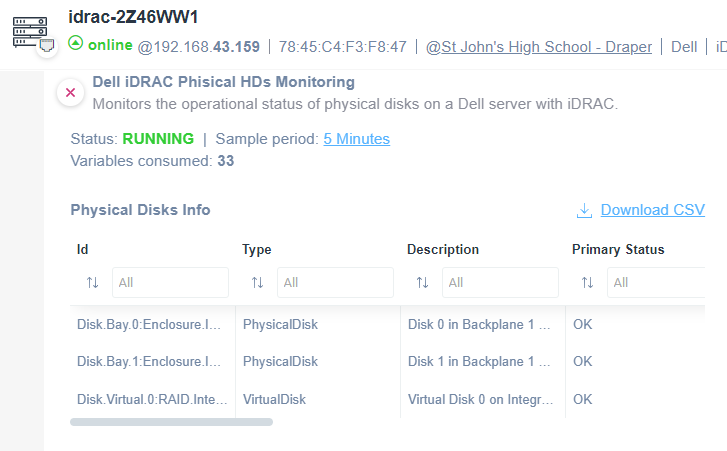
Dell iDRAC Physical Hard Disks Monitoring Interface
1. The interface shows a server named "idrac-2Z46WW1" with its status as "online" at IP address 192.168.43.159, and a MAC address listed.
2. The monitoring section details the operational status of physical disks on a Dell server using iDRAC. The status shows "RUNNING" with a sample period of "5 Minutes" and "Variables consumed: 33."
3. Under "Physical Disks Info," a table displays information about the disks:
- Columns include "Id," "Type," "Description," and "Primary Status."
- Three disks are listed:
- First and second entries are "PhysicalDisk," with descriptions "Disk 0 in Backplane 1" and "Disk 1 in Backplane 1," both showing "OK" as the primary status.
- Third entry is "VirtualDisk" with "Virtual Disk 0 on Integ" as the description and an "OK" status.
4. There is an option to download the information as a CSV file using the "Download CSV" link.
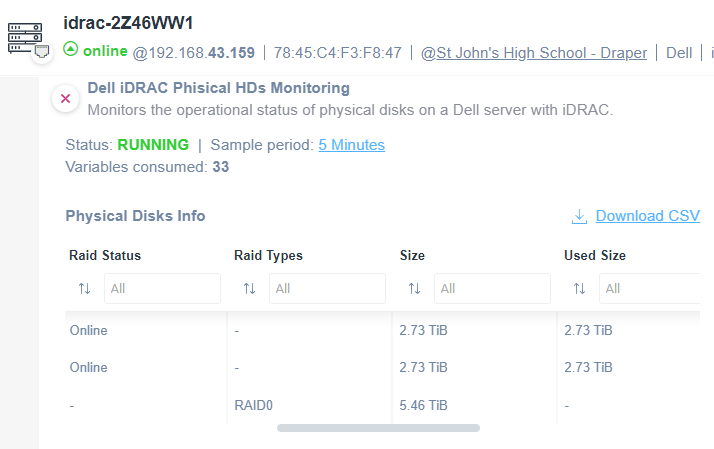
Dell iDRAC Physical Hard Disk Monitoring Interface
1. Header shows the device name "idrac-2Z46WW1" with its online status, IP address (192.168.43.159), and MAC address (78:45:C4:F3:F8:47).
2. Activity status is "RUNNING," with a sample period of every 5 minutes. It mentions 33 variables consumed.
3. "Physical Disks Info" section lists information about different disks:
- First two rows show disks with "Online" status, unspecified RAID type, each with a size and used size of 2.73 TiB.
- Third row shows a disk with "RAID0" type, size of 5.46 TiB, with no used size listed.
4. Options to filter RAID Status and Types are available.
5. Option to download the data as a CSV file is provided.
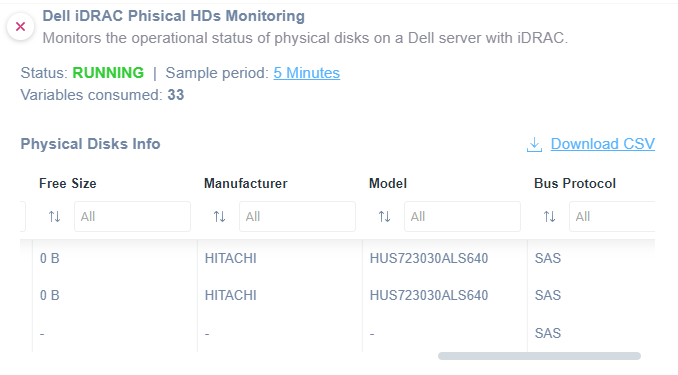
Dell iDRAC Physical Hard Disk Monitoring Interface
1. The interface shows the operational status of physical disks on a Dell server using iDRAC.
2. The status is "RUNNING," indicating the monitoring is active.
3. Sample data is updated every 5 minutes, and 33 variables have been consumed.
4. "Physical Disks Info" section lists disk details:
- Columns include "Free Size," "Manufacturer," "Model," and "Bus Protocol."
- The table shows two entries with a manufacturer of HITACHI, model HUS723030ALS640, and bus protocol SAS. Free size for these disks is listed as 0 B.
5. There is an option to download the data as a CSV file.
Raid status and configuration
- Type
- Primary Status
- Product Name
- Description
- Support RAID 10 Uneven Spans
- Cache Size
- Driver Version
- Encryption Mode
- Security Status
You can find this script in our Library or on github. Just customize the drivers to fit your needs.
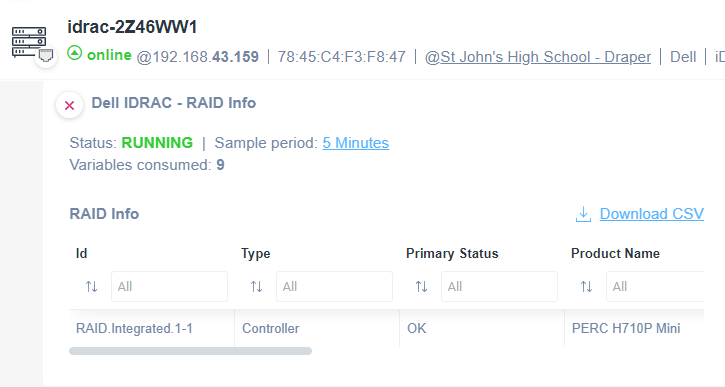
IDRAC RAID Info Display
1. The top section shows the device labeled "idrac-2Z46WW1", which indicates it is online with IP address 192.168.43.159.
2. Below, "Dell IDRAC - RAID Info" is displayed, indicating system status as "RUNNING" and a sample period of five minutes. The number of variables consumed is 9.
3. Under "RAID Info", the table lists different categories:
- "Id" shows RAID.Integrated.1-1.
- "Type" indicates "Controller".
- "Primary Status" is "OK".
- "Product Name" is "PERC H710P Mini".
4. There is an option to download the data as a CSV file.
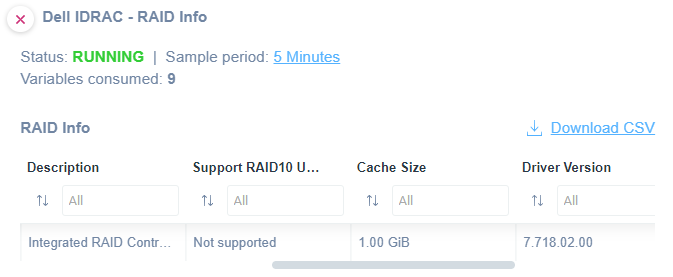
Dell IDRAC - RAID Info Overview
1. The status indicates "RUNNING," showing the system is operational. The sample period is set to 5 minutes, and 9 variables have been consumed.
2. The RAID Info table displays the following columns:
- **Description:** Lists "Integrated RAID Controller."
- **Support RAID10 U:** Shows "Not supported" indicating RAID10 is not supported for the current configuration.
- **Cache Size:** Displays "1.00 GiB."
- **Driver Version:** Shows "7.718.02.00."
3. There is an option to "Download CSV" for exporting the data.
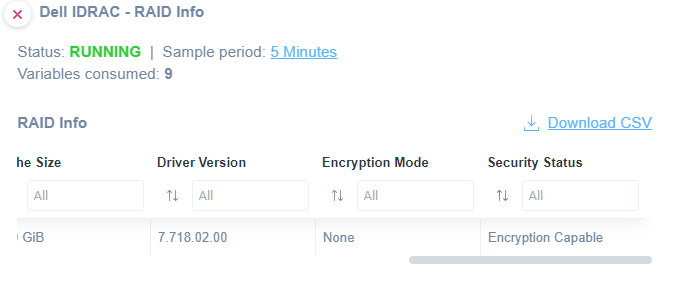
Dell iDRAC RAID Information Overview
1. The status of the Dell iDRAC is indicated as "Running."
2. The sample period is five minutes, and nine variables have been consumed.
3. Under the RAID Info section, you can download the data as a CSV file using the "Download CSV" link.
4. Information columns include Cache Size, Driver Version, Encryption Mode, and Security Status.
5. Example entry: Cache Size is listed as GiB, Driver Version is 7.718.02.00, Encryption Mode is None, and Security Status is "Encryption Capable."
Memory status and information
- Type
- Description
- Primary Status
- Bank Label
- Model
- Part Number
- Serial Number
- Manufacturer
- Size
- Speed
- Current Operating Speed
You can find this script in our Library or on github. Just customize the drivers to fit your needs.
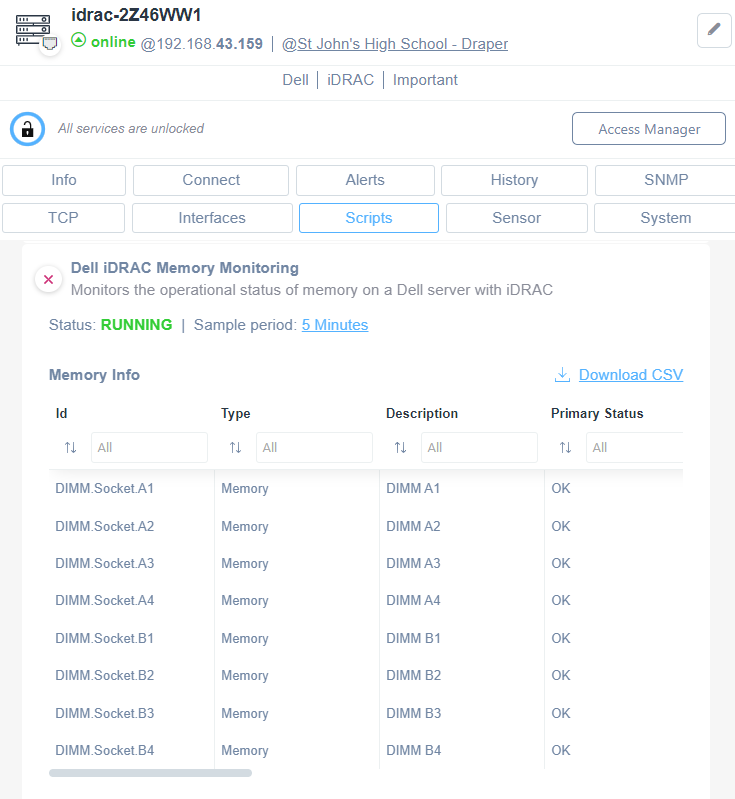
Dell iDRAC Memory Monitoring Overview
1. At the top, device "idrac-2Z46WW1" is online with the IP address 192.168.43.159 at St John's High School - Draper.
2. Menu tabs include options like Info, Connect, Alerts, and Scripts, with Scripts selected to display memory information.
3. The Dell iDRAC Memory Monitoring section shows memory status. The status is "RUNNING" and sampled every 5 minutes.
4. Memory Info table includes columns: Id (e.g., DIMM.Socket.A1), Type (all listed as Memory), Description (e.g., DIMM A1), and Primary Status (all OK).
5. There’s an option to download the memory info as a CSV file.
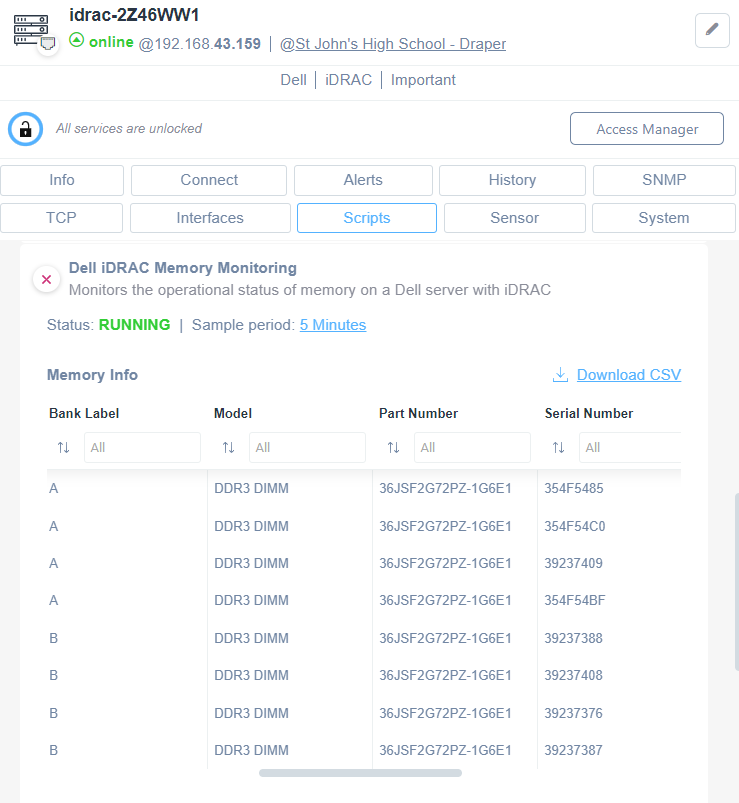
Dell iDRAC Memory Monitoring Interface
1. The top section displays the device name "idrac-2Z46WW1" and its status as "online" with the IP address 192.168.43.159, located at St John's High School - Draper.
2. Tabs for navigation are available, including Info, Connect, Alerts, History, SNMP, TCP, Interfaces, Scripts, Sensor, and System. The "Scripts" tab is currently active.
3. The main section titled "Dell iDRAC Memory Monitoring" describes the operational status of memory on a Dell server with iDRAC. The current status shows "RUNNING" with a sample period of 5 minutes.
4. A table labeled "Memory Info" lists details of memory banks. Columns include Bank Label, Model, Part Number, and Serial Number. Each row provides specifics such as bank label "A" or "B," model "DDR3 DIMM," consistent part number "36JSF2G72PZ-1G6E1," and unique serial numbers.
5. A "Download CSV" link is available for saving the memory data.
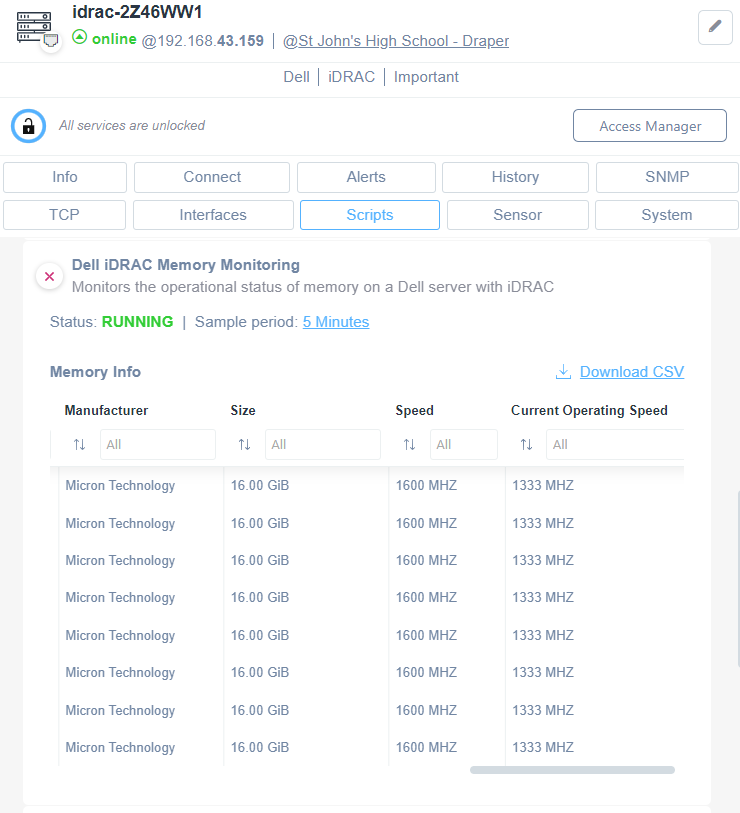
Dell iDRAC Memory Monitoring Overview
1. Display the memory monitoring section for a Dell server using iDRAC.
2. The system status is shown as "RUNNING," with a sample period of 5 minutes.
3. Memory information includes columns for Manufacturer, Size, Speed, and Current Operating Speed.
4. All entries list Micron Technology with a size of 16.00 GiB.
5. The memory speed is 1600 MHZ, while the current operating speed is listed as 1333 MHZ.
6. An option to download the information as a CSV file is available.
Fans status and information
- Type
- Description
- Primary Status
- Redundancy Status
- Active Cooling
- Variable Speed
- PWM (Pulse Width Modulation percentage)
- Current Reading
You can find this script in our Library or on github. Just customize the drivers to fit your needs.
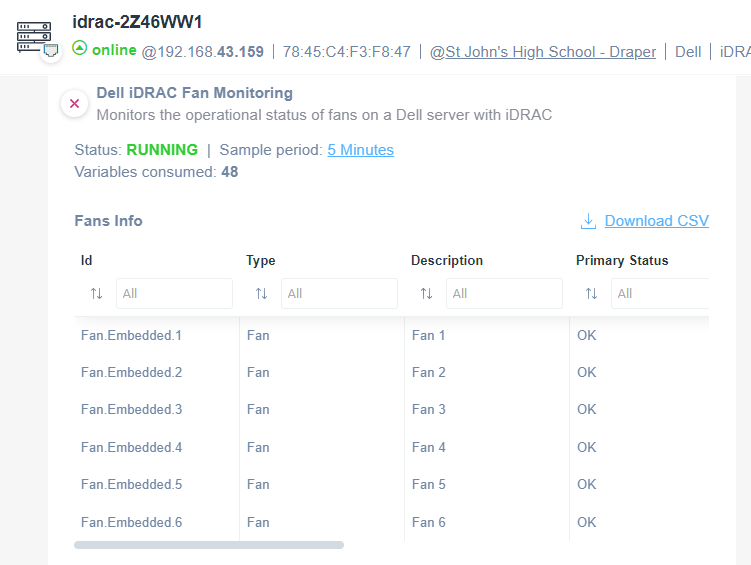
Dell iDRAC Fan Monitoring Interface
1. The interface is for monitoring the status of fans on a Dell server using iDRAC. It indicates that the monitoring status is "RUNNING."
2. The sample period for data refresh is set to "5 Minutes," and a total of "48" variables have been consumed.
3. Under "Fans Info," multiple fans are listed with the following columns: "Id," "Type," "Description," and "Primary Status."
4. Each fan is identified by an "Id" such as "Fan.Embedded.1" through "Fan.Embedded.6." They are all of type "Fan" with descriptions ranging from "Fan 1" to "Fan 6."
5. The "Primary Status" for all fans is marked as "OK," indicating they are functioning properly.
6. There is an option to "Download CSV" for exporting the fan data.
Use this interface to check the operational status of server fans, ensuring they are all listed as "OK." Adjust monitoring settings or download the data as needed.
Processors status and information
- Type
- Description
- Model
- Primary Status
- Max Clock Speed
- Virt Tech Enabled
- Hyper-Threading Enabled
You can find this script in our Library or on github. Just customize the drivers to fit your needs.
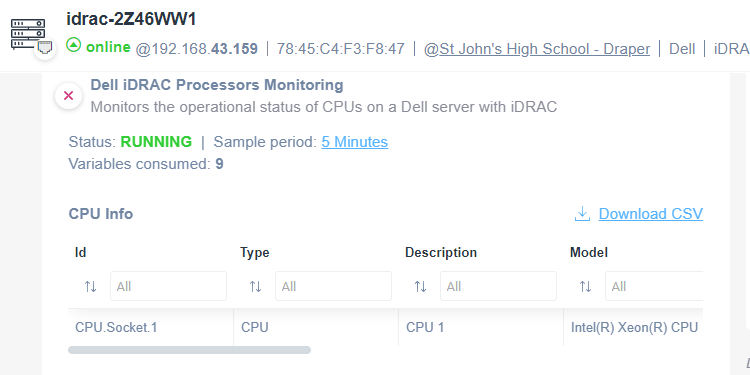
Dell iDRAC Processors Monitoring Interface
1. The server "idrac-2Z46WW1" is currently online, with associated IP address 192.168.43.159.
2. The monitoring status is shown as "RUNNING," with a sample period set to every 5 minutes. A total of 9 variables are being consumed.
3. The CPU Info section lists CPU details:
- Id: CPU.Socket.1
- Type: CPU
- Description: CPU 1
- Model: Intel(R) Xeon(R) CPU
4. An option to download the information as a CSV file is available.
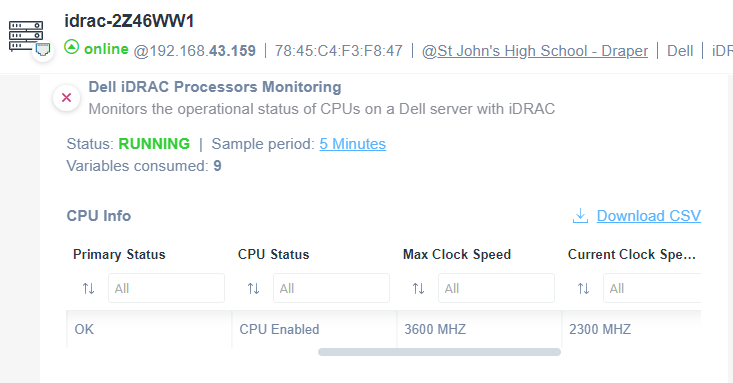
Dell iDRAC Processors Monitoring Dashboard
1. The dashboard displays the operational status of CPUs on a Dell server using iDRAC.
2. The server identifier is "idrac-2Z46WW1," with an online status, IP address "192.168.43.159," and a unique identifier "78:45:C4:F3:F8:47."
3. The monitoring section shows that the server status is "RUNNING," with a sample period link for "5 Minutes," and indicates "9 Variables consumed."
4. Under "CPU Info," details are provided:
- "Primary Status" is "OK."
- "CPU Status" shows "CPU Enabled."
- "Max Clock Speed" is "3600 MHZ."
- "Current Clock Speed" is "2300 MHZ."
5. A downloadable CSV link is available for more detailed data.
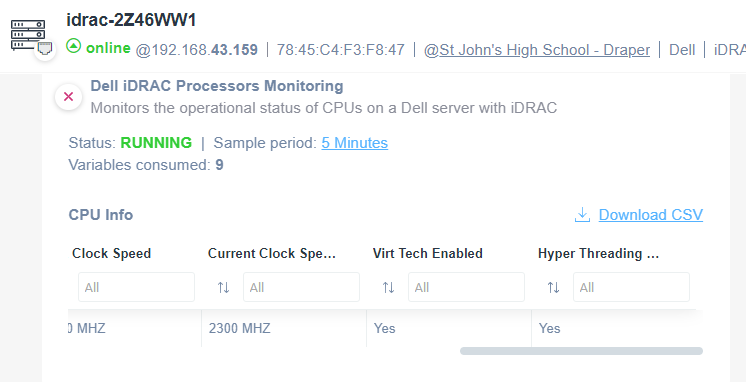
Dell iDRAC Processors Monitoring Interface
1. Displays the monitoring status of CPUs on a Dell server with iDRAC, indicating the system is currently online.
2. Shows the IP address as 192.168.43.159 and provides the status as "RUNNING."
3. Specifies a sample period link of 5 minutes and notes that 9 variables have been consumed.
4. Under CPU Info, several metrics are displayed:
- Clock Speed: All values listed as "0 MHZ."
- Current Clock Speed: Displays as "2300 MHZ."
- Virtualization Technology Enabled: Indicated as "Yes."
- Hyper Threading: Indicated as "Yes."
5. Provides an option to download data as a CSV file.
IBM iSeries – AS400
To monitor an IBM iSeries AS400, you can apply this script which uses Telnet as communication protocol.
You will be able to monitor the following:
- The total of errors/issues/problems present in the system
- A complete list of the errors/issues/problems present in the system
Please note that this script has been tested and works only on the Italian version of OS400. If you are using OS400 in another language, please send an email to support@domotz.com requesting a script for your language.
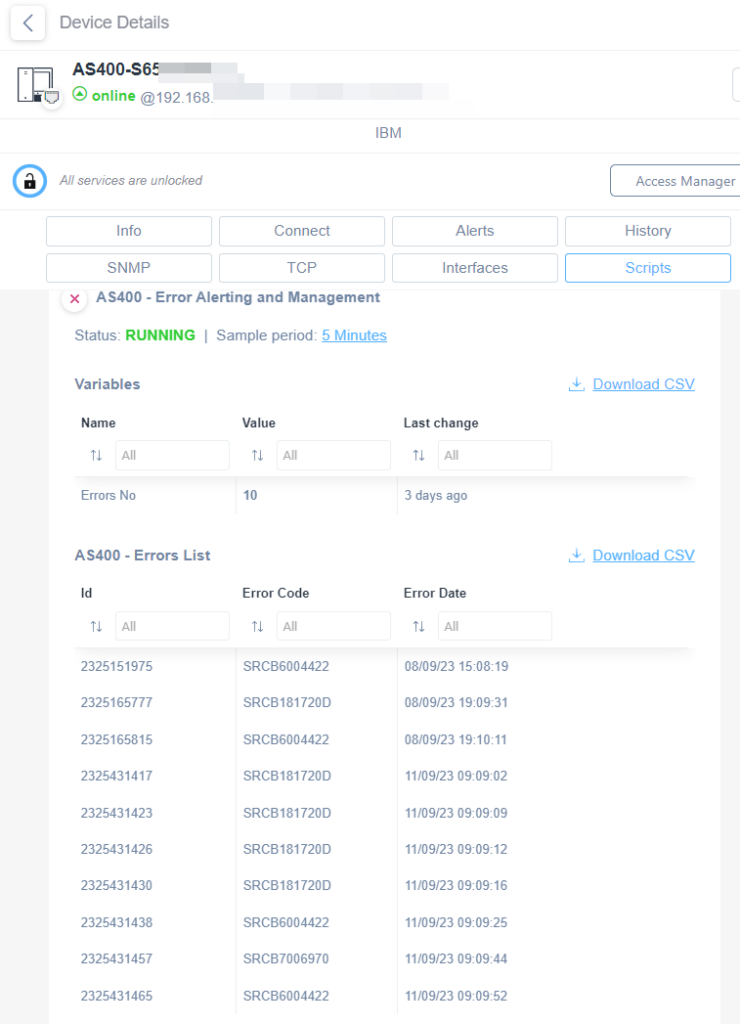
Device Error Alerting and Management Details
1. The device is identified as AS400-S65 by IBM and is currently online with a given IP address. All services are unlocked.
2. Navigation tabs are available for Info, Connect, Alerts, History, SNMP, TCP, Interfaces, and Scripts. The Scripts tab is selected.
3. The section titled "AS400 - Error Alerting and Management" displays a Running status with a sample period of 5 minutes.
4. Under "Variables," it shows the number of errors as 10, with the last change occurring 3 days ago.
5. A downloadable CSV option is provided.
6. The "AS400 - Errors List" presents details in columns: Id, Error Code, and Error Date. The list includes entries with IDs like 2325151975, corresponding error codes such as SRCB6004422, and specific error dates and times.
Improvements
Edit and delete Custom Filters
Going on, we released another important enhancement that simplifies the process of managing Custom Filters in both the Inventory Dashboards and Monitoring Dashboards. You can now edit and delete existing Custom Filter rules directly from these sections.
To adjust your Custom Filters, simply access the selection for Custom Filters, and you’ll notice a new “Edit” button.
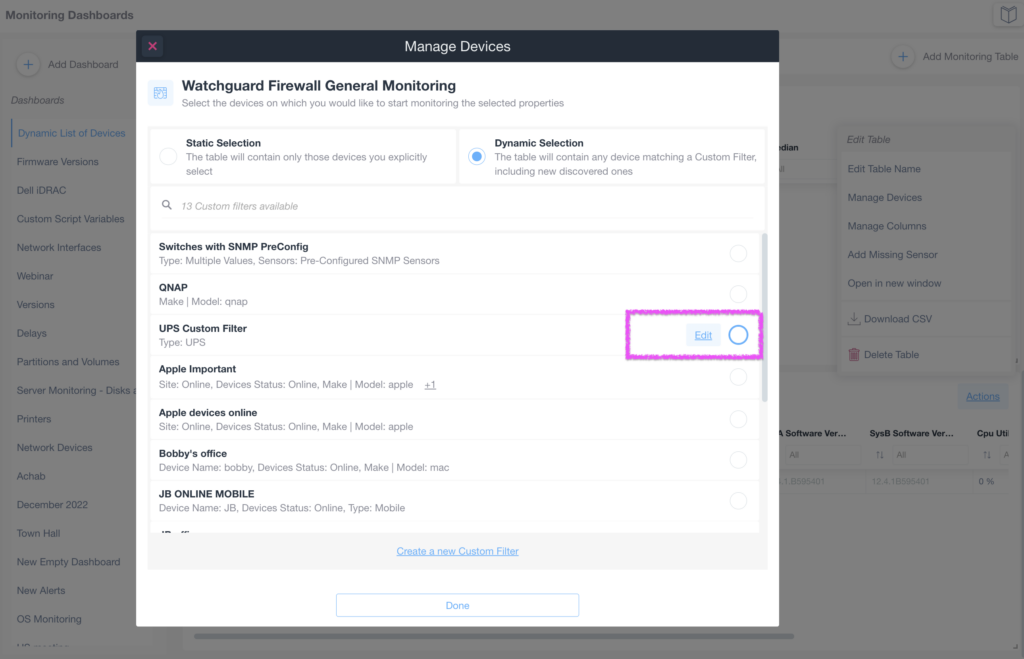
Configuring a Dynamic Device Selection in Watchguard Firewall Monitoring
1. In the "Manage Devices" dialog, select "Dynamic Selection" to automatically include devices matching a Custom Filter, including newly discovered ones.
2. Review the list of available custom filters under "13 Custom filters available."
3. To modify a filter, find the desired filter, such as "Apple Important," and click on "Edit."
4. Ensure the selection circle next to the filter you wish to use is marked.
5. After adjustments, click "Done" to save changes and apply the filter to your device monitoring setup.
Clicking this button will open a new configuration tab, allowing you to define new rules and conditions for your filtering criteria.
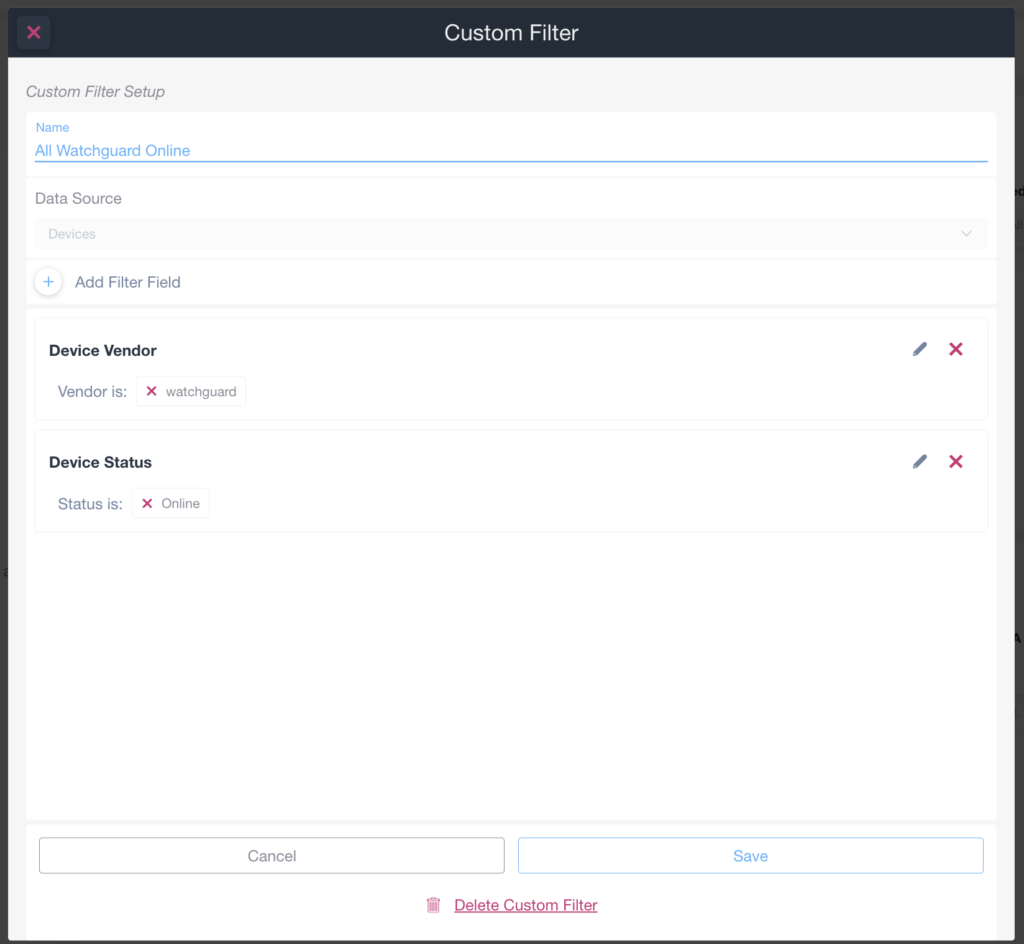
Creating a Custom Filter with Specific Criteria
1. Name the custom filter with a meaningful title, such as "All Watchguard Online," in the designated text box.
2. Select the data source from the dropdown menu under "Data Source." Here, it is set to "Devices."
3. To add filter criteria, click on “Add Filter Field.”
4. The filter criteria include "Device Vendor" with "Vendor is: watchguard," indicating only devices from Watchguard are included.
5. Another criterion is "Device Status" where "Status is: Online," ensuring only online devices are filtered.
6. Use the pencil icons to edit the criteria or the red cross icons to remove them.
7. Click "Save" to apply the filter or "Cancel" to discard changes.
8. To remove the entire custom filter, select "Delete Custom Filter" located at the bottom.
This improvement offers greater flexibility and control over your Custom Filters, eliminating the need to navigate to a separate editing interface. Whether you are working within the Inventory Dashboards or the Monitoring Dashboards, the ability to edit Custom Filter rules seamlessly streamlines your network monitoring and management tasks.
Synchronize Serial Number Information with Syncro
Our recent enhancement lets you easily synchronize Serial Number information between Domotz and Syncro. This news offers more comprehensive data synchronization capabilities when integrating Domotz with the Syncro platform.
When configuring Documentation and Data synchronization between Domotz and Syncro, you can now select the synchronization of Serial Number information in addition to the existing data fields (such as Device name, type, model, location, etc.).
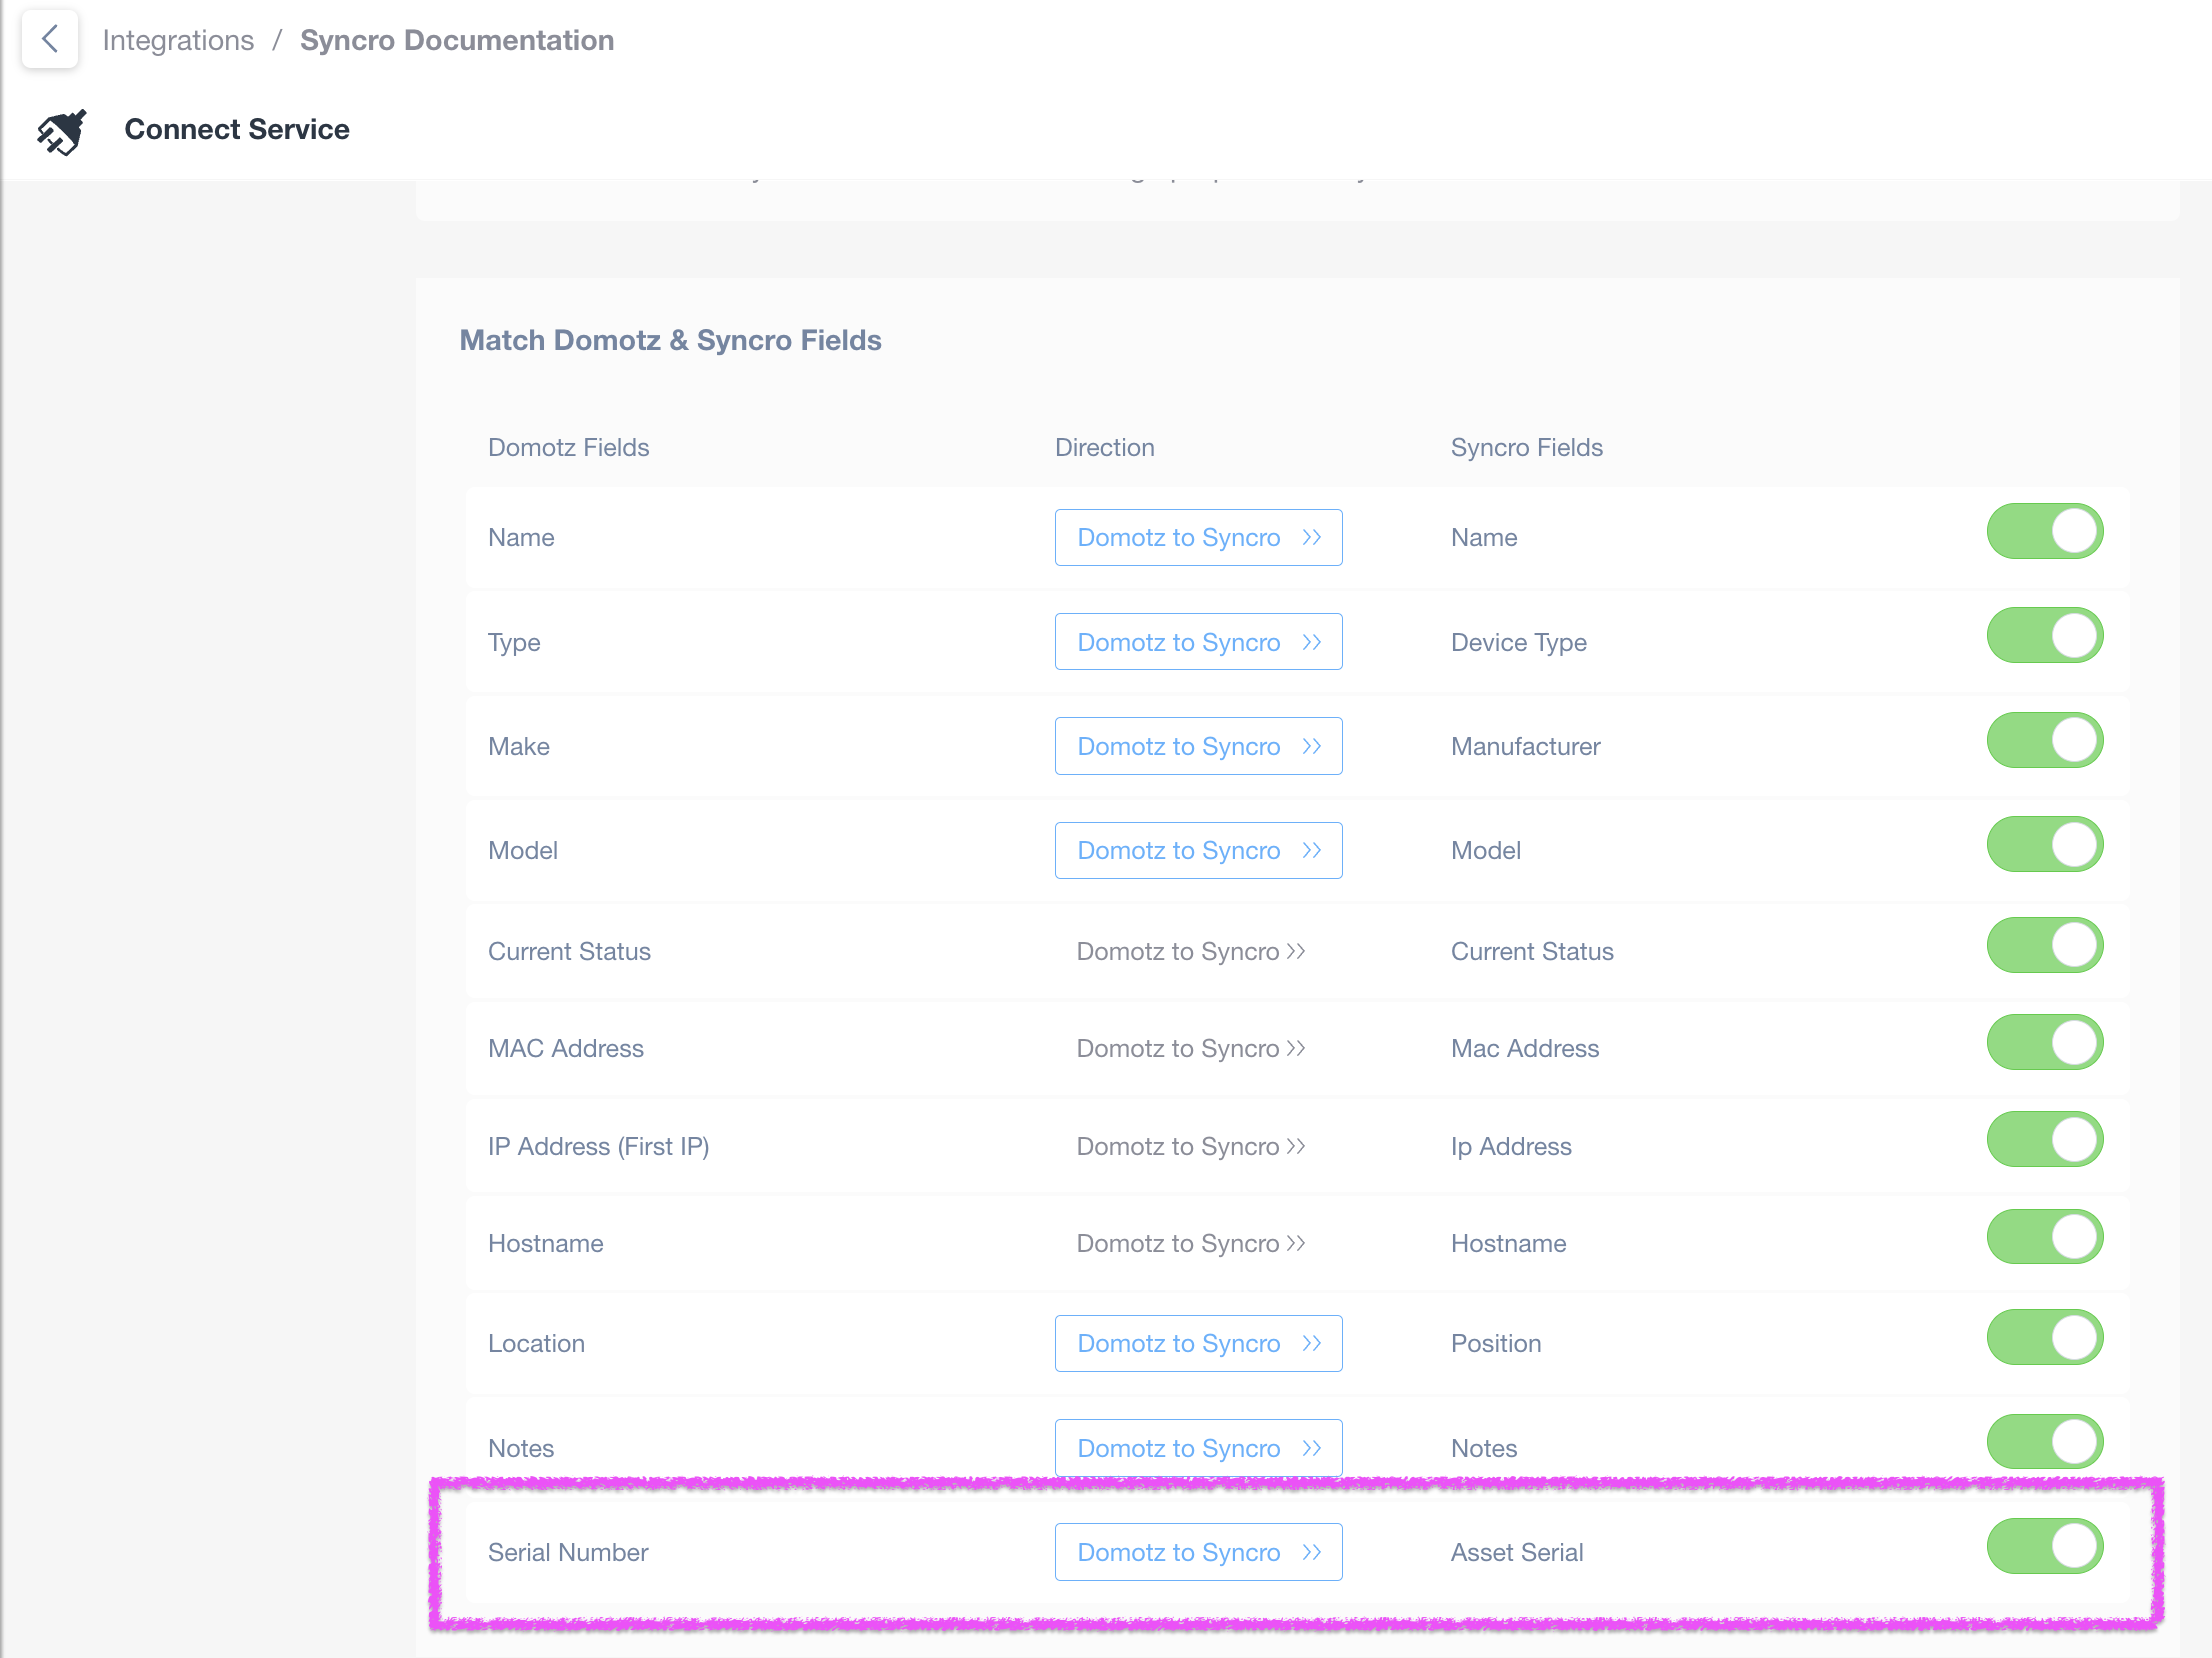
Mapping Domotz and Syncro Fields
1. Navigate to the "Match Domotz & Syncro Fields" section.
2. Each row represents a field to be mapped from Domotz to Syncro.
3. Fields include Name, Type, Make, Model, Current Status, MAC Address, IP Address, Hostname, Location, Notes, and Serial Number.
4. The "Direction" column shows the flow from "Domotz to Syncro."
5. The last column shows the corresponding "Syncro Fields" with options such as Name, Device Type, Manufacturer, Model, etc.
6. Ensure the toggle switch next to each field pair is turned on (green) to activate synchronization.
This synchronization allows you to maintain accurate Serial Number records across both platforms effortlessly. Whether you need to track assets, facilitate support, or streamline your asset management processes, this improvement ensures that your Serial Number data remains consistent and current in Domotz and Syncro.
For detailed guidance on configuring this Serial Number synchronization and maximizing the benefits of this integration, please refer to our documentation.
Enhanced Metric Search for Monitoring Tables
We have introduced an intuitive and user-friendly metric search feature that effortlessly enables you to find and add metrics to your Monitoring Tables.
With this improvement, when adding a new Monitoring Table, you now have the ability to search among all available metrics, including both built-in and custom metrics generated by Automation and Scripts.
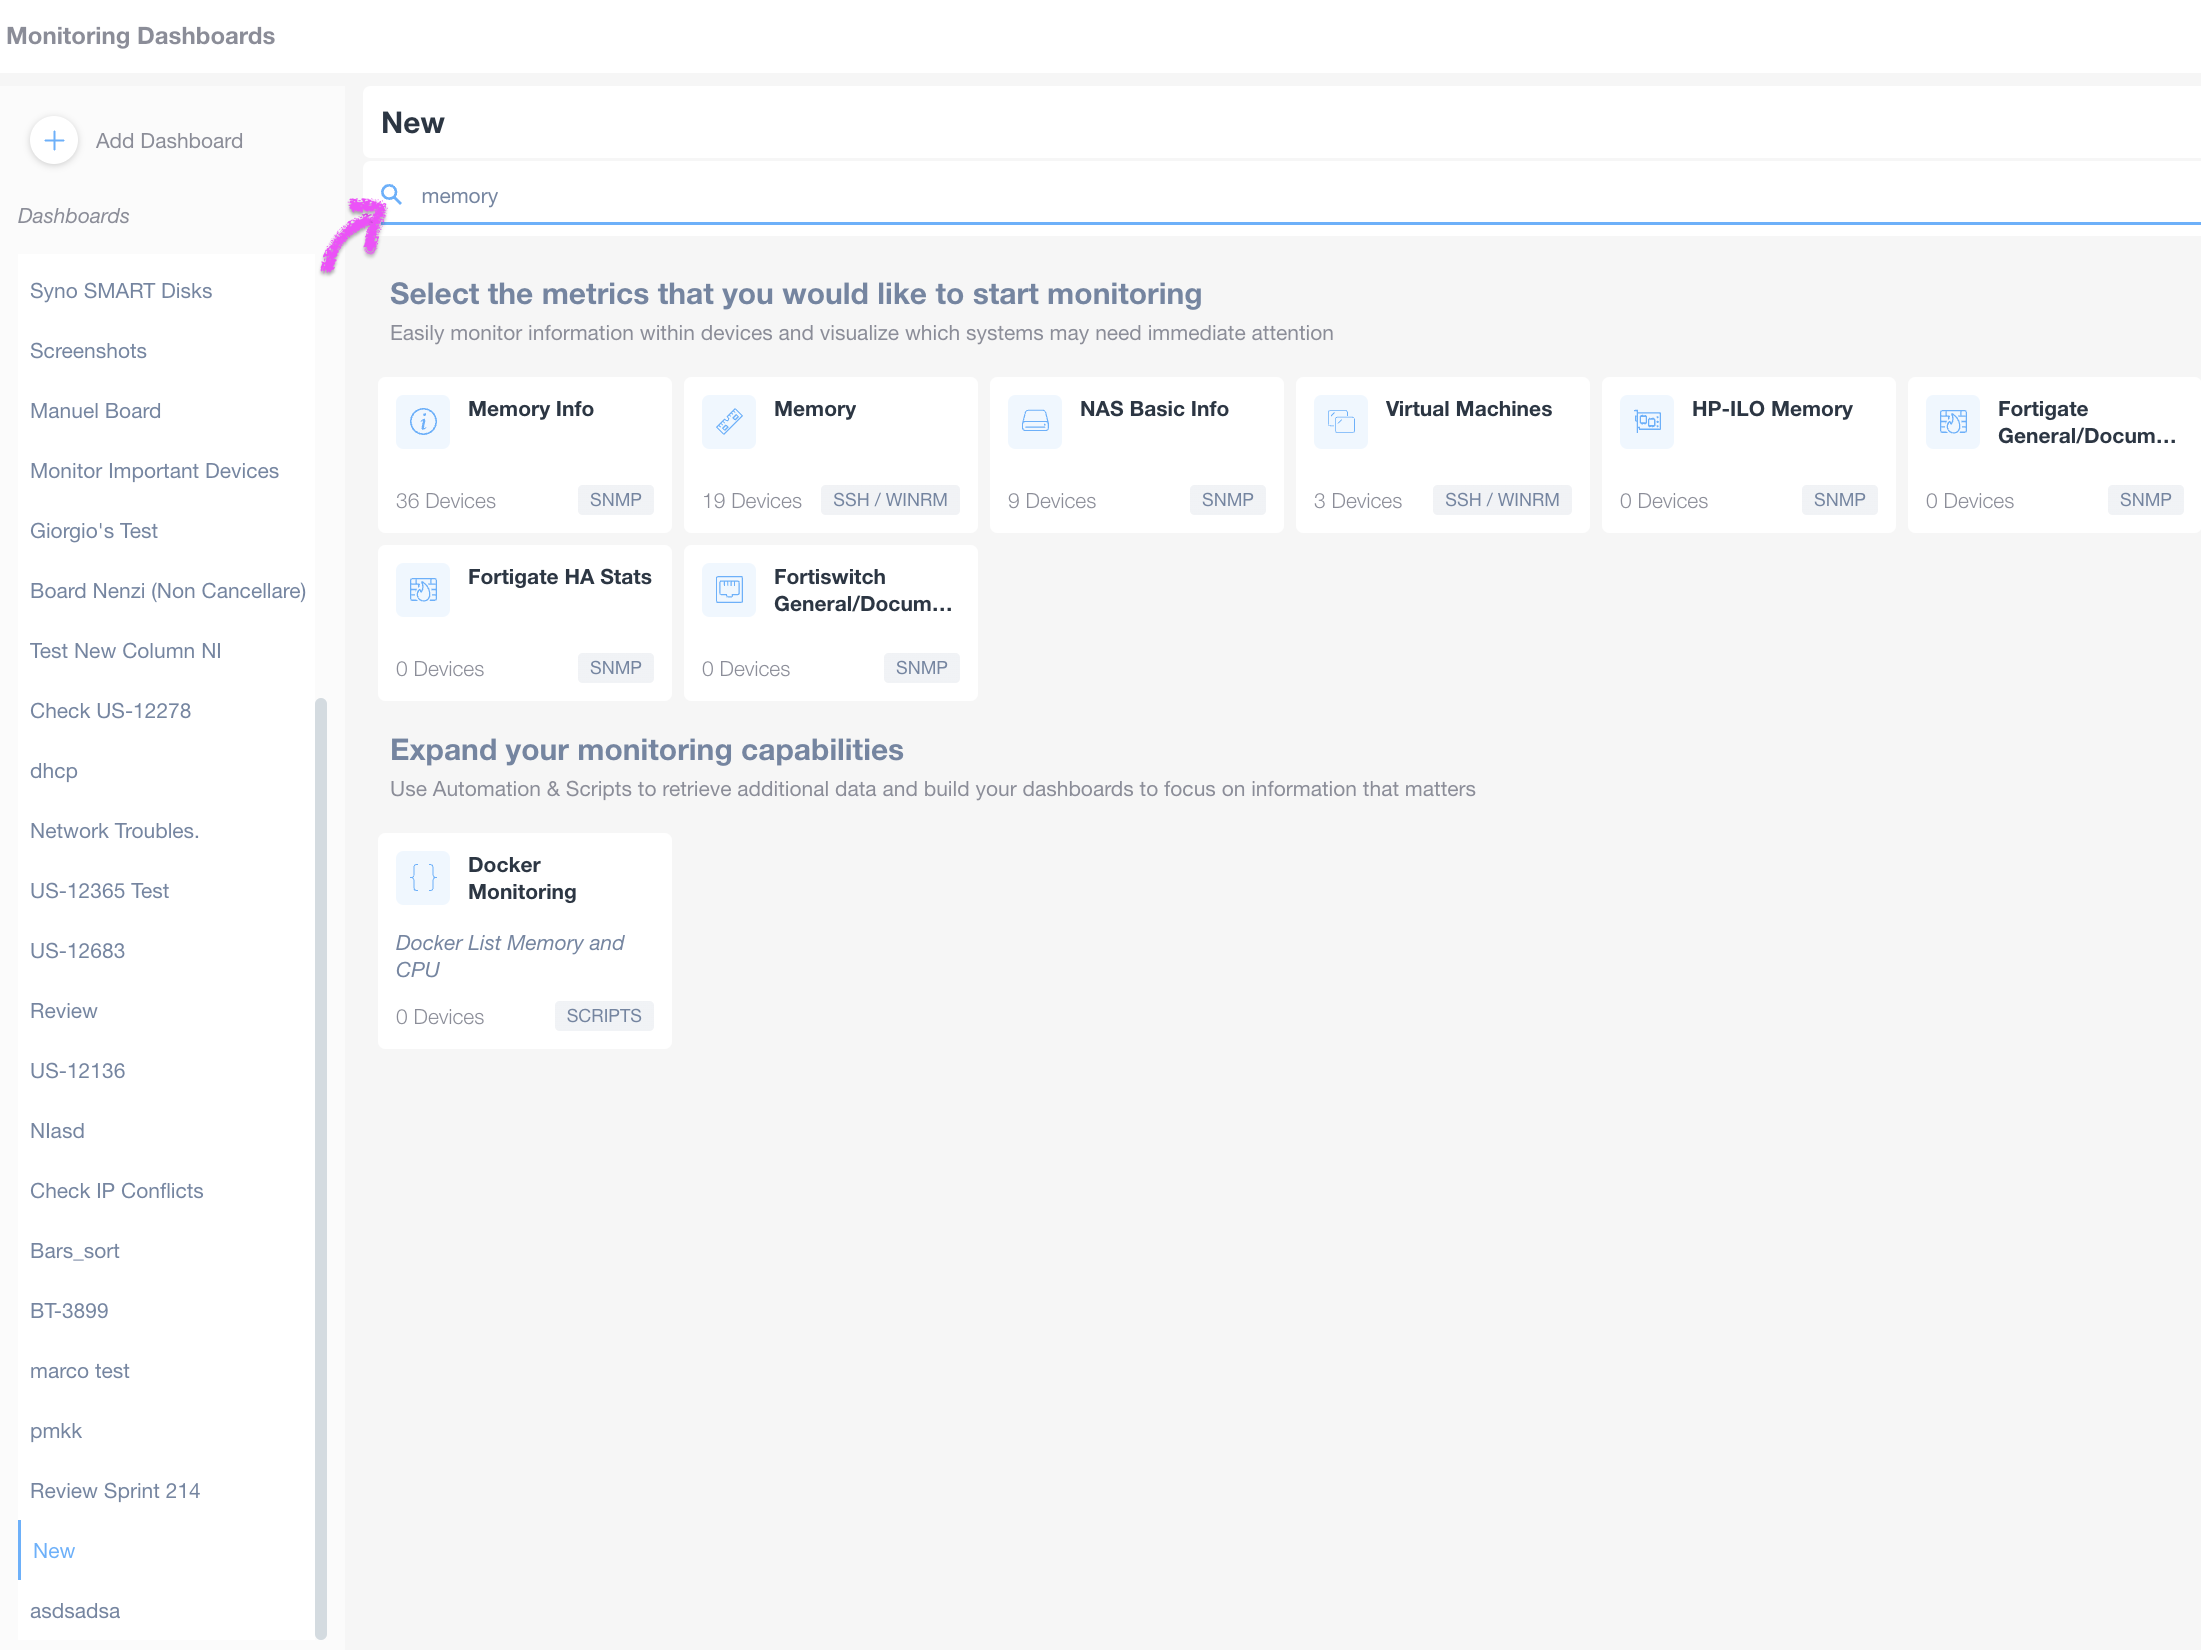
Creating a New Monitoring Dashboard
1. In the Monitoring Dashboards section, click on "Add Dashboard" to start the setup of a new monitoring dashboard.
2. In the search bar, input the term "memory" to filter relevant metrics.
3. Choose metrics to monitor. Available options include:
- Memory Info: Monitor 36 devices using SNMP.
- NAS Basic Info: Monitor 19 devices using SSH/WINRM.
- Virtual Machines: Monitor 3 devices using SSH/WINRM.
- HP-ILO Memory and other options shown with their respective protocols.
4. Consider expanding monitoring capabilities by using automation and scripts, such as "Docker Monitoring," which lists memory and CPU stats, accessible via scripts.
This powerful search capability simplifies the selection of metrics, ensuring that you can quickly and accurately define the metrics you want to monitor.
Whether you track network performance, device health, or specific custom metrics (e.g. CPU or Memory), this enhancement significantly reduces the time and effort required to configure your Monitoring Tables. It offers a seamless and efficient experience when customizing your network monitoring dashboards.
For detailed information on how to use Monitoring Dashboards, please visit our documentation.
Configure Custom Script Parameters via Public API
We are delighted to introduce the possibility of defining parameters for Custom Scripts during the association of scripts to devices via the Public API.
This enhancement simplifies and expedites the configuration of Custom Scripts, enabling you to perform mass associations of scripts to multiple devices with ease and efficiency. By leveraging the Public API, you can now automate the process of custom script configuration, enhancing your network monitoring and management capabilities.
For detailed information on defining parameters for Custom Scripts via the Public API and performing script associations, we invite you to consult our comprehensive documentation available at: Create Custom Driver Association.
Email Notification for Configuration Management Failure
Improve the reliability and oversight of your network configuration management. Domotz now incorporates a proactive mechanism to alert the Team Leader account (admin account) via email if there are any failures when attempting to read configuration files from supported network devices.
This release ensures that the primary account holder of a Domotz Account is promptly notified if the automatic backup of configuration files (every 6 hours) encounters any issues or fails for any reason.
By receiving timely email notifications of configuration management failures, you can take immediate action to address and resolve any potential issues, safeguarding the integrity and security of your network configurations.
We remain dedicated to enhancing your network management experience and providing robust tools for comprehensive network oversight. If you have any questions or require assistance with this new email notification feature, please don’t hesitate to contact our support team.
Additional MIBs available in the Domotz Database
Additional MIB files are available for the following devices.
- Wyse
- TPDIN-Monitor-Web3
- Thecus
Additionally, you can search for their OIDs from Domotz.
New SNMP Templates
Supermicro
Use Domotz to monitor Supermicro server performance and system performance proactively. Get quick access to crucial information and simplify your Supermicro remote monitoring using our pre-configured SNMP templates.
The available pre-configured SNMP templates are the following:
- General Monitoring
- Power Supply Units Monitoring
Receive notifications about system issues to resolve remote system management issues in advance. Get a better insight into the performance of the servers you manage to improve your overall server management.
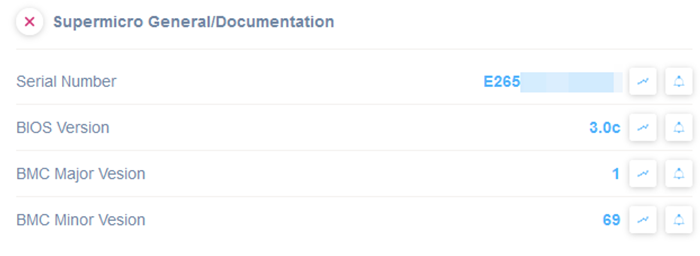
Viewing system version information in Supermicro documentation.
1. Find the "Serial Number" with a value displayed as "E265."
2. Note the "BIOS Version," which shows "3.0c."
3. Check the "BMC Major Version," listed as "1."
4. Observe the "BMC Minor Version," indicated as "69."
Each entry has an icon next to it, potentially allowing for additional actions or details related to the system version information.
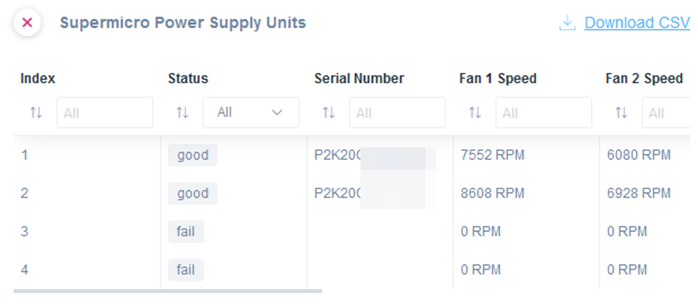
Table of Supermicro Power Supply Units.
1. The table displays four columns: Index, Status, Serial Number, Fan 1 Speed, and Fan 2 Speed.
2. The status values show "good" for operational units and "fail" for non-operational units.
3. Each row represents a different power supply unit with unique serial numbers.
4. Fan speed is indicated in RPM (revolutions per minute) for both Fan 1 and Fan 2.
5. Use the filter options at the top of each column to sort or refine the data according to index, status, serial numbers, or fan speeds.
6. A link to download the data as a CSV file is available in the top-right corner.
WatchGuard VPN tunnels and VPN general documentation
Use our new pre-configured SNMP templates to simplify your WatchGuard remote monitoring.
Apply the “VPN Tunnels Monitoring” to monitor the current active VPN Tunnels:
- local IP address
- remote IP address
- inbound/outbound traffic rate
Use the General VPN Information Monitoring to monitor General VPN information such as total VPN entries and total Inbound/outbound IPsec packet rate.
Fix
We’ve fixed the following issues:
- The RTD monitoring failed on huge networks due to too many samples to be managed.
- A rare condition caused the failure in unlocking Dell iDRAC devices.
- Special UTF-8 characters were not correctly displayed on Monitoring Dashboards (when the view was open in compact mode).
- There was an issue preventing a Team Member, elevated to impersonate the admin account, to activate new Agents.
- Panamax PDU Outlet (and other minor brands) consistency was not working under specific circumstances. This issue caused the list of associated devices to the PDU outlets to be removed.
- SNMP Template was failing in extracting the negotiated bandwidth on interfaces with a speed higher than 2.5Gbps
- Under specific circumstances, unlocking the Windows server was impossible due to failed serial number retrieval.
Known limitations
- There is no central repository for all the alerts configured on SNMP PreConfigured, OS Monitoring, and Custom Integration script sensors.
- Monitoring Dashboards are currently limited to Monitoring Tables as Widgets.
- Luxul Router-based Agents do not support VPN on demand. To elaborate, we’ll add this capability as soon as Luxul’s team provides us with the required API.
- You can’t configure the static IP address on the Domotz Box before configuring the Agent.
- Lastly, you can’t leverage DHCP on additional VLANs on the Domotz Box.
These release notes cover the changes, including Domotz Pro Cloud, Domotz Agent, and Domotz Pro App. Learn more about our software on our website or read our blog to stay updated with modern network and IT Infrastructure monitoring and management.