")


We have exciting new features, SNMP templates, and Custom scripts available on Domotz. This month’s exciting new updates include new Fortinet and Palo Alto Firewall SNMP templates, creating and editing the Custom Filters directly on the Monitoring Dashboard, parametric custom scripts, and more.
In summary, here’s what’s new and improved on Domotz this month.
- Parametric Custom Scripts
- Fortinet FortiGate Firewall Pre-Configured SNMP templates
- Fortinet FortiSwitch Pre-Configured SNMP templates
- Palo Alto Firewall Pre-Configured SNMP templates
- Advanced Scan via TCP on Routed Subnets
- Creating and Editing Custom Filters from Monitoring Dashboard
- Standardized Serial Number and Firmware Version
- Increase Vertical Scrollbar within the WebApp
- Enhanced “Test Script Code” Section
We are always improving Domotz and welcome your feedback. Please contact our support team at support@domotz.com for help or suggestions.
New features on Domotz
Parametric Custom Scripts
We are thrilled to introduce a groundbreaking addition to the Custom Scripts framework within Domotz. With the newly introduced Parametric Custom Scripts, you can write custom scripts that utilize parameters that can be configured when associating the script with a specific device.
This innovation revolutionizes how custom scripts are employed, offering unparalleled flexibility and efficiency. With Parametric Custom Scripts, you can create dynamic and versatile scripts that cater to a wide range of scenarios. You can customize each parameter when associating the script with a device, eliminating the need for script modification or the creation of multiple script versions.
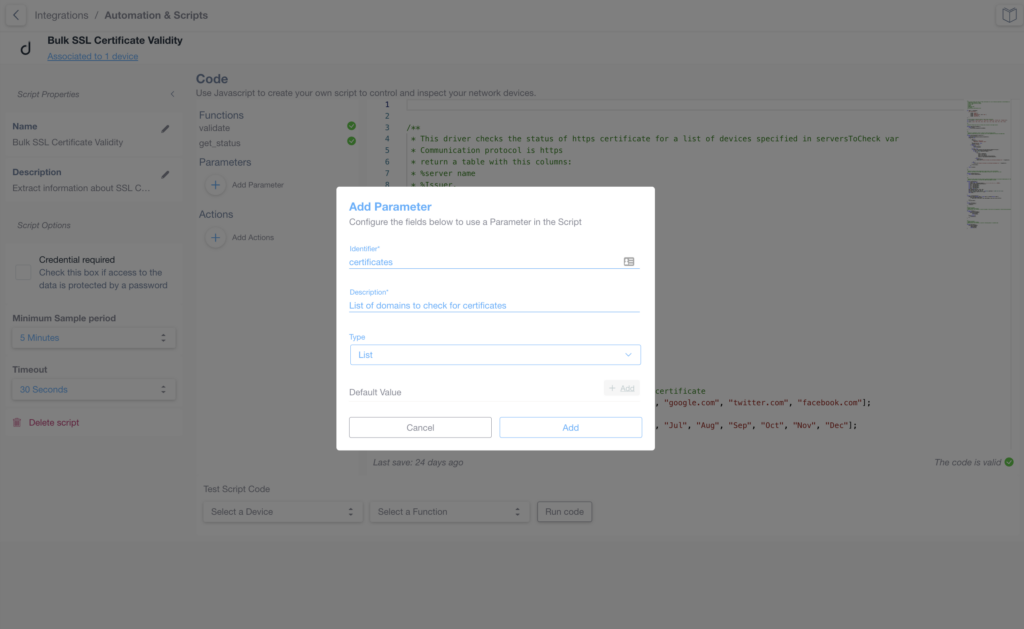
For instance, consider the SSL Certificate custom script that verifies the validity of SSL certificates. With Parametric Custom Scripts, the list of sites to be monitored can now be influenced by parameters assigned during script association.
This empowers you to tailor your monitoring approach based on specific parameters, streamlining and enhancing your monitoring experience.
This feature enables a highly adaptable approach to network monitoring. This way allows you to monitor what truly matters to you without the hassle of modifying the script for each use case.
For comprehensive guidance on how to leverage Parametric Custom Scripts to their fullest potential, we invite you to explore the documentation available in the Domotz platform.
Fortinet FortiGate Firewall Pre-Configured SNMP templates
We now support pre-configured SNMP templates for Fortinet FortiGate Firewalls.
You can use these new templates to monitor every FortiGate firewall. Moreover, you can automatically extract multiple useful information:
- General Information/Documentation
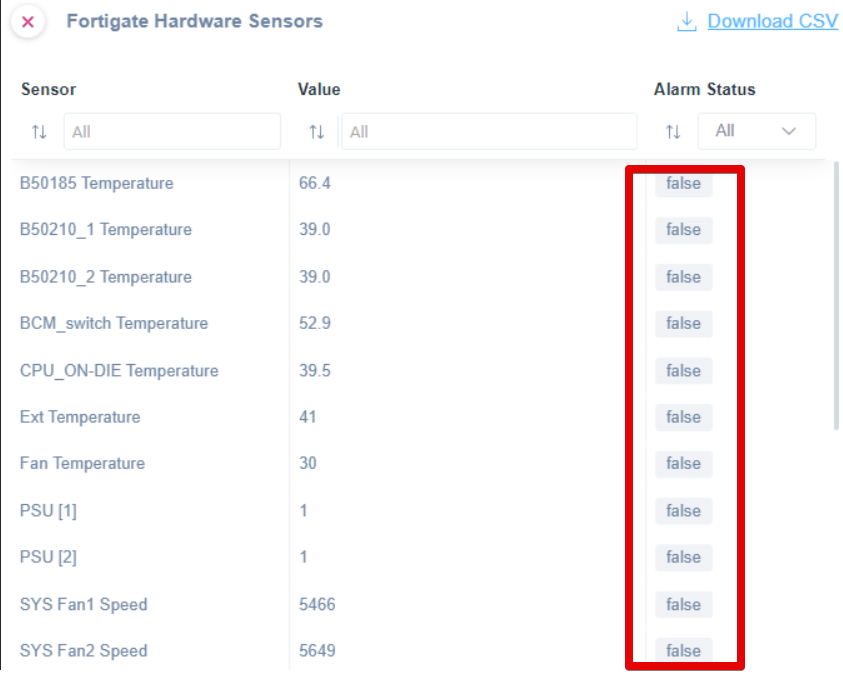
- Hardware Sensors
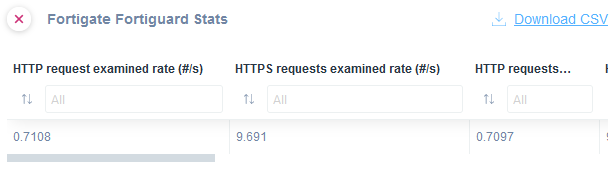
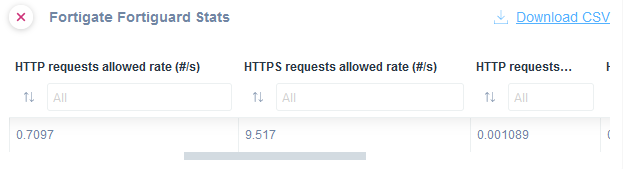
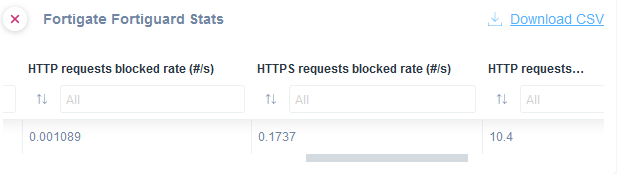
- FortiGuard Stats
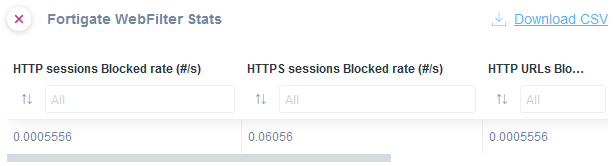
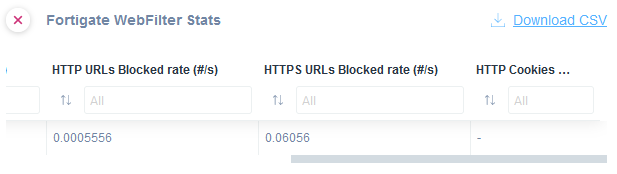
- WebFilter Stats
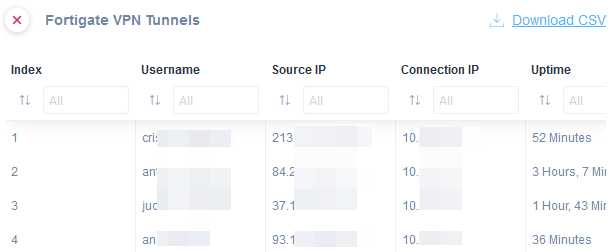
- VPN Tunnels info
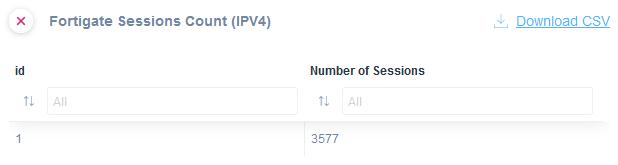
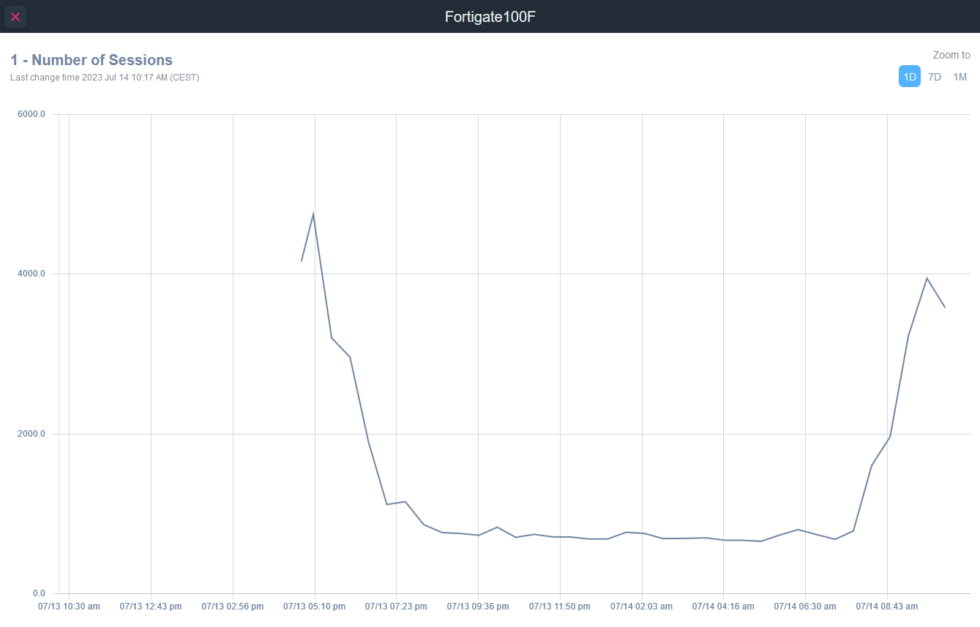
- IPV4 Sessions info
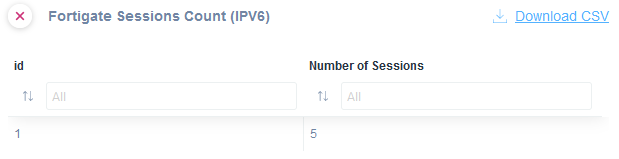
- IPV6 Sessions info
- High Availability Properties
- High Availability Stats
Use our new pre-configured tables (or list of variables) to monitor your Fortigate Firewalls across multiple sites. Moreover, you can create monitoring tables using the data from this functionality.
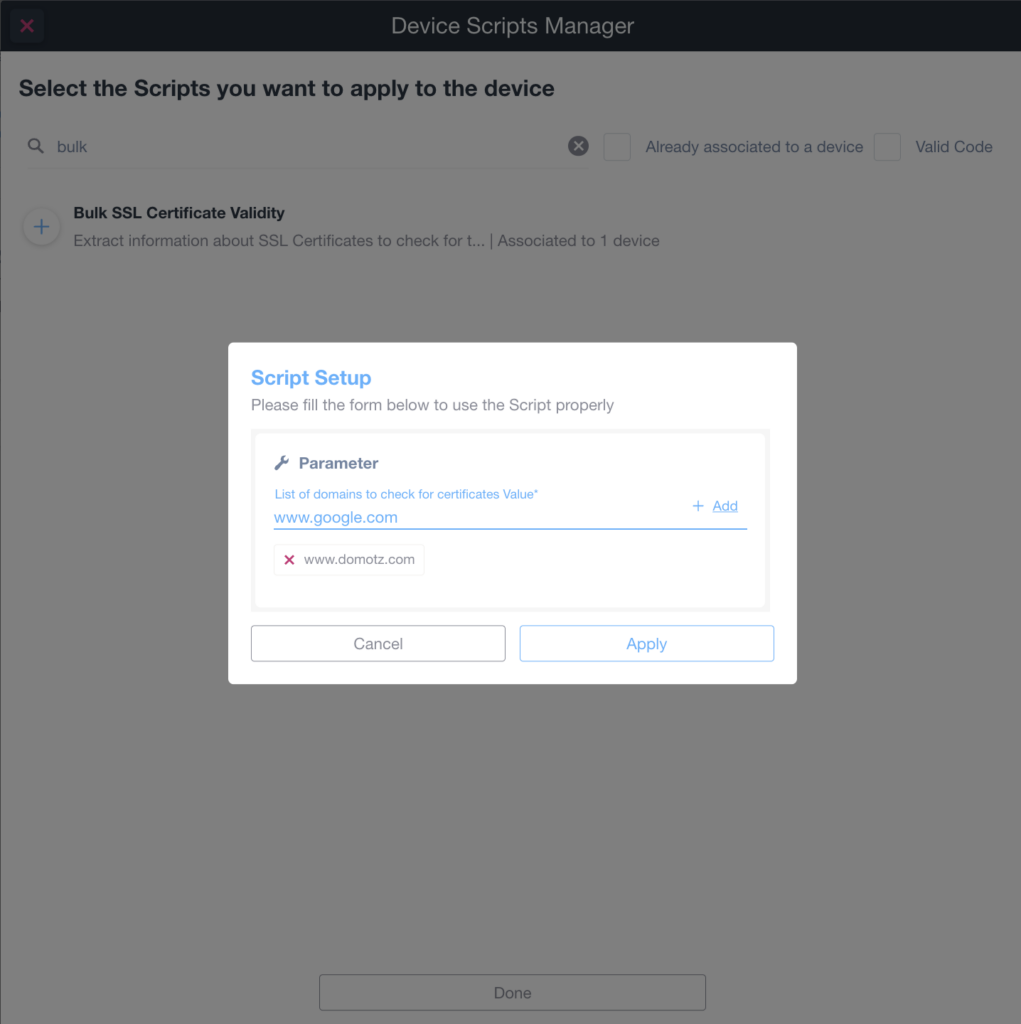
Below is an example of General Documentation that can be extracted from Fortigate using the new pre-configured SNMP templates.
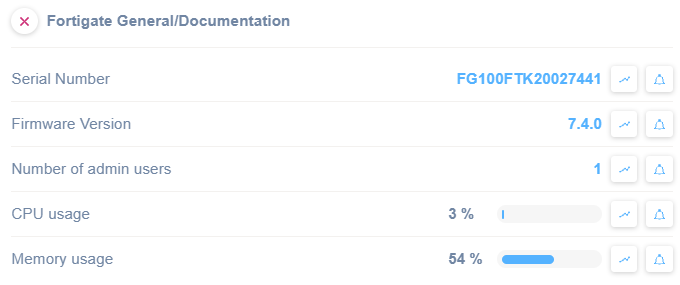
You will be able to access additional information based on the different available templates.
HW (Hardware) Sensors
- Temperature
- BCM Temperature
- CPU Temperature
- External Temperature
- Fan Temperature
- Power Supply unit condition
- Fans speed
FortiGuard Stats
- HTTP/HTTPS requests examined
- HTTP/HTTPS requests allowed
- HTTP/HTTPS requests blocked
WebFilter stats
- HTTP/HTTPS sessions blocked
- HTTP/HTTPS URL blocked
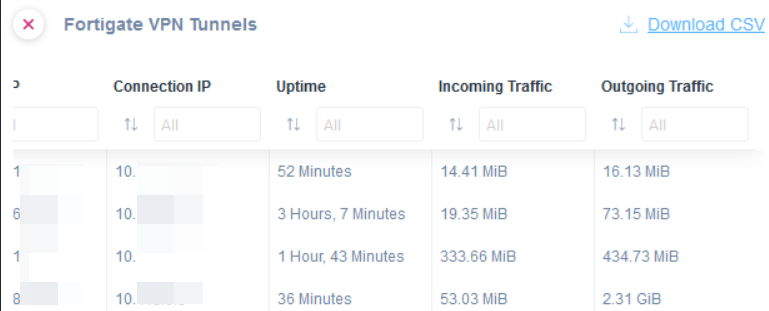
VPN Tunnels
- Username
- Source IP
- Connection IP
- Uptime
- Incoming Traffic
- Outgoing Traffic
IPV4 Sessions
IPV6 Session Count
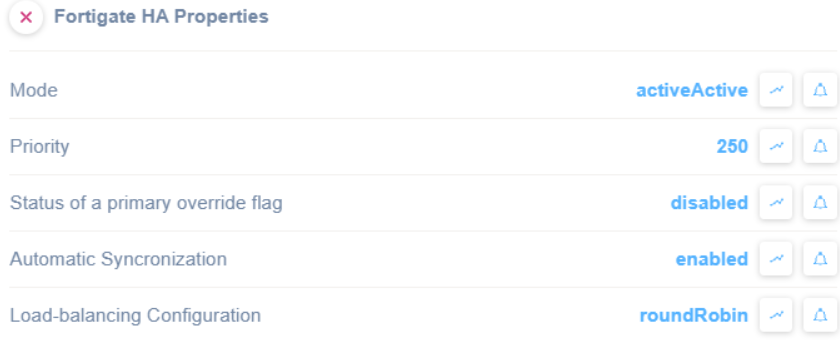
HA (High Availability) Properties
- Mode
- Priority
- Status of a primary override flag
- Automatic Synchronization
- Load-balancing Configuration
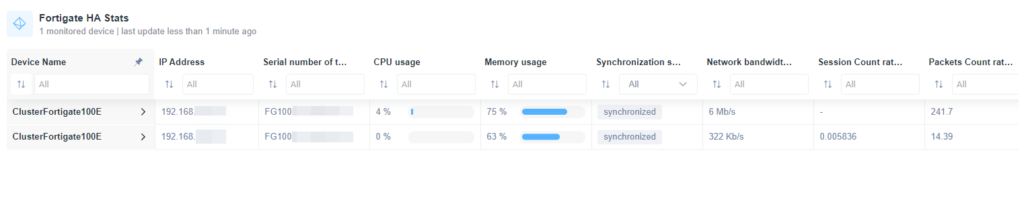
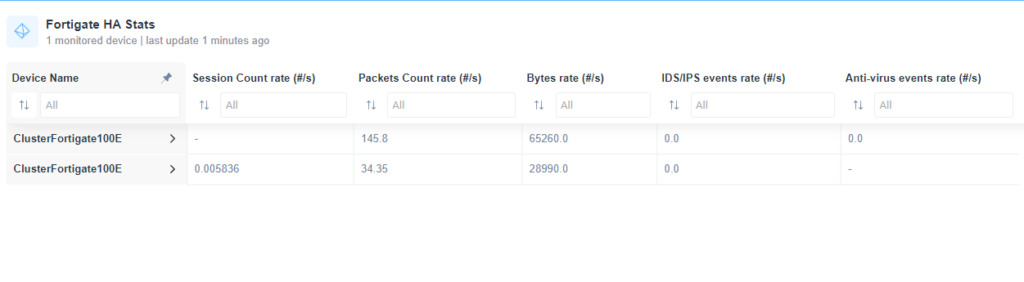
HA (High Availability) Stats
- Serial Number
- CPU Usage
- Memory Usage
- Synchronization Status
- Network Bandwidth Usage
- Session Count rate
- Packets Count rate
- Bytes rate
- IDS/IPS events rate
- Anti-virus events rate
Finally, this new feature allows you to set alerts on the status of each FortiGate parameter you extract.
Learn more about Fortigate Firewall Pre-Configured SNMP templates.
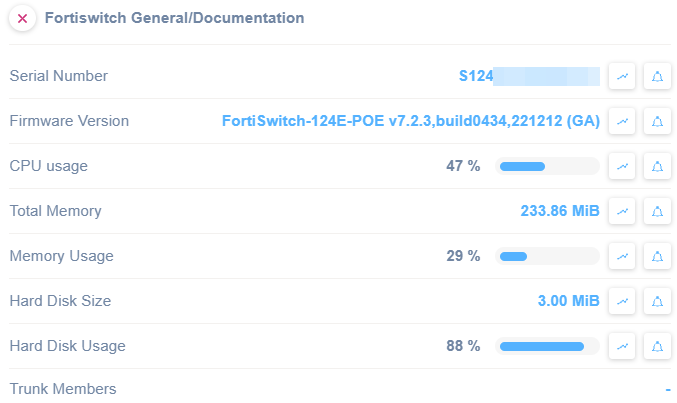
Fortinet FortiSwitch Pre-Configured SNMP templates
Use the new pre-configured SNMP templates for Fortinet FortiSwitch. You can use these templates to monitor every FortiSwitch. Moreover, you can automatically extract multiple types of information:
- Serial Number
- Firmware Version
- CPU usage
- Memory usage
- Hard Disk Size
- Hard Disk Usage
- Trunk Members
Use our new pre-configured tables (or list of variables) to monitor your FortiSwitch across multiple Sites. Create monitoring tables leveraging the data retrieved using this feature.
Below is an example of General Documentation that can be extracted from FortiSwitch using the new pre-configured SNMP template:
Finally, this new feature allows you to set alerts on the status of each FortiSwitch parameter you extract.
Learn more about the Pre-Configured FortiSwitch template.
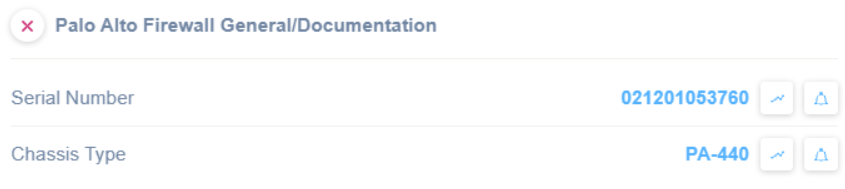
Palo Alto Firewall Pre-Configured SNMP templates
Use these new Palo Alto pre-configured SNMP templates to monitor every Palo Alto firewall. Moreover, you can automatically extract multiple types of information:
- General Information/Documentation
- Firewall Software Versions
- Firewall Sessions
- WebFilter Stats
- Firewall High Availability Properties
Use our new pre-configured tables (or list of variables) to monitor your Palo Alto Firewalls across multiple sites. Moreover, you can create monitoring tables using the data from this functionality.
You can see an example of General Information you can extract from Palo Alto through this new SNMP Pre-configured template:
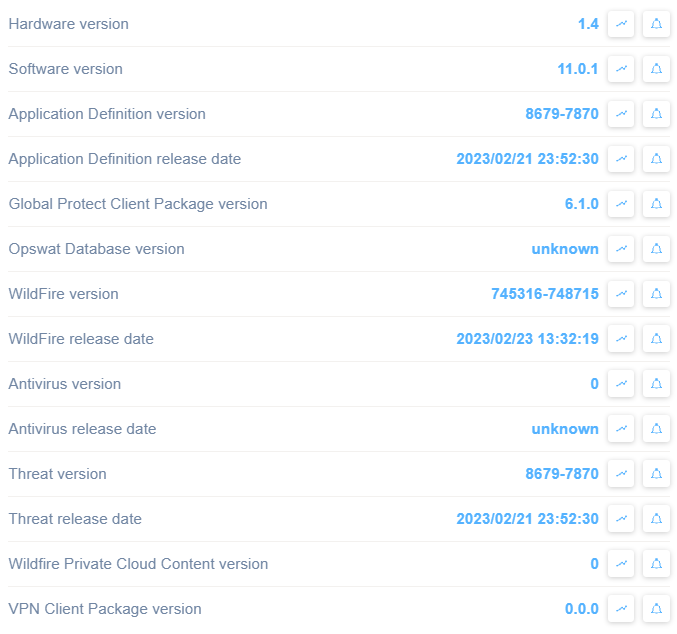
You will be able to extract additional information based on the different available templates:
Software Versions
- Hardware version
- Firmware version
- Application Definition version and release date
- Global Protect Client Package version
- Opswat Database version
- WildFire version and release date
- Antivirus version and release date
- Threat version and release date
- Wildfire Private Cloud Content version
- VPN Client Package version
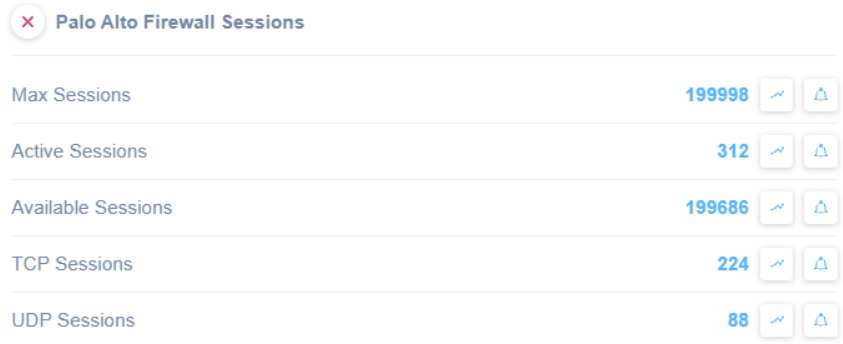
Sessions
- Maximum number of sessions
- Active Sessions
- Available Sessions
- TCP Sessions no.
- UDP Sessions no.
HA Properties
- High-Availability State
- Per High-Availability State
- High-Availability Mode
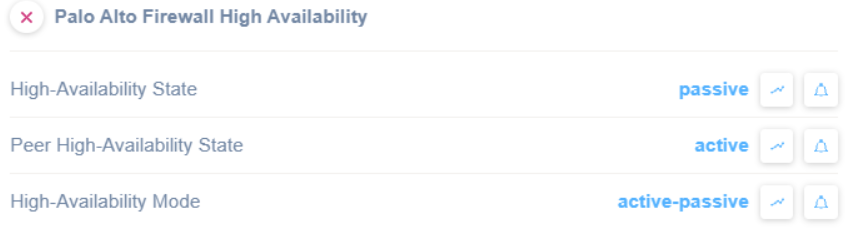
Finally, this new feature allows you to set alerts on the status of each Palo Alto Firewalls parameter you extract.
Learn more about Pre-Configured Palo Alto Firewall templates.
New Custom Scripts
You can use the custom scripts to monitor and manage network-connected devices, cloud services, and web applications. By using standard network protocols, these scripts will allow you to retrieve valuable data and execute actions on the monitored devices and services.
This month we released the following:
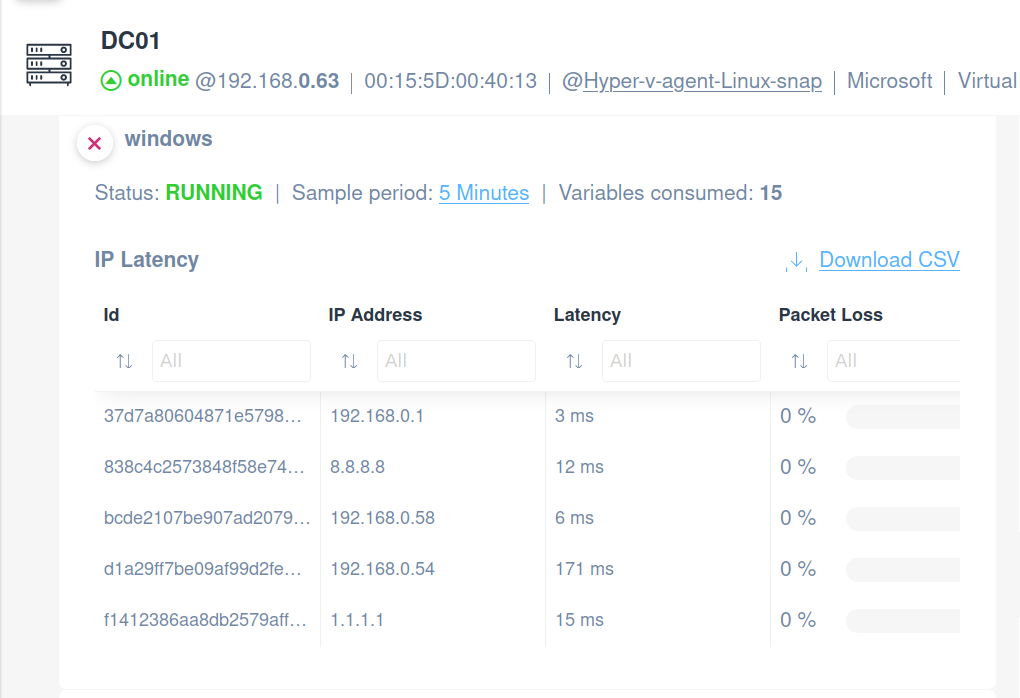
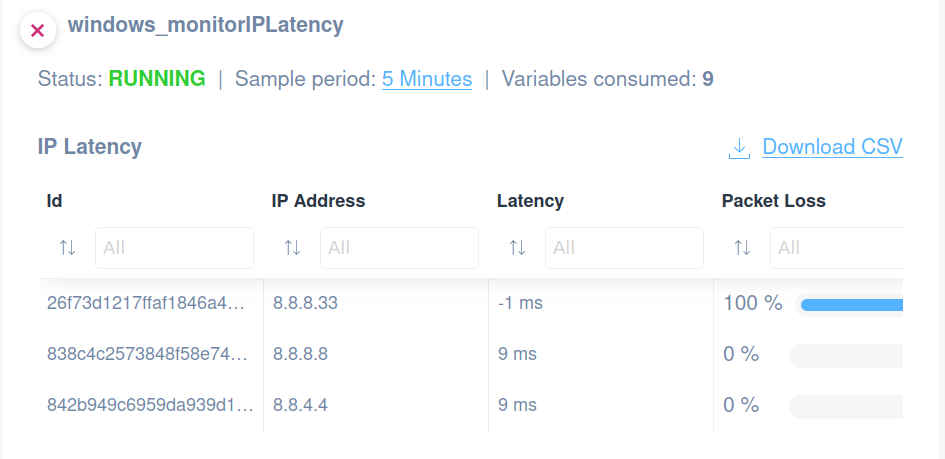
Windows Latency Monitoring
You can now monitor the Microsoft Windows host’s latency from end-point to end-point by applying our ready-to-use, pre-configured script.
The script uses the ping command to retrieve detailed information about latency from one host to another, and you can specify a list of hosts.
The script has been validated and tested on Windows 10, Windows 11, and Windows Server 2019.
You can find these scripts in our library. Simply personalize the drivers according to your requirements.
Following, you can see examples of the data you can extract through this specific custom script:
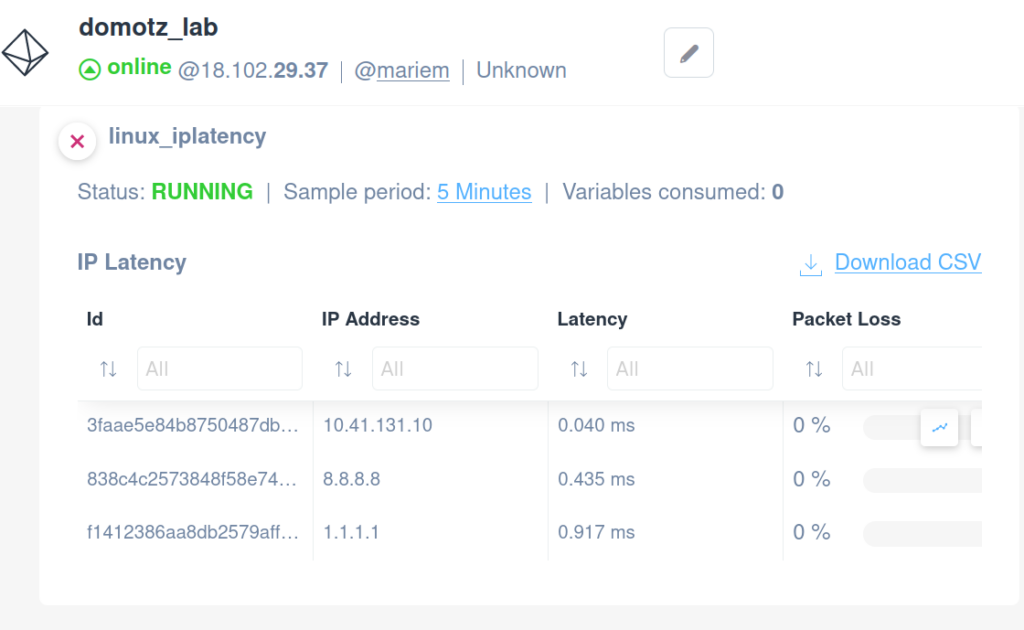
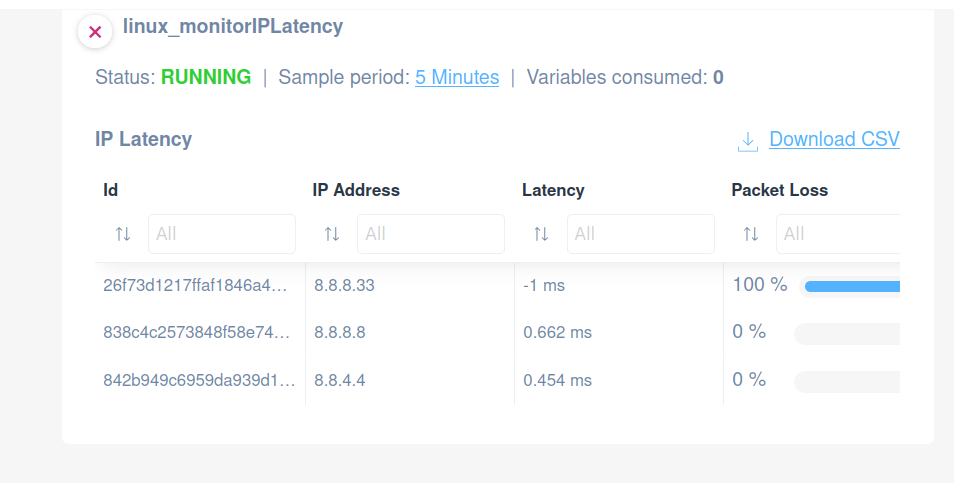
Linux Latency Monitoring
Monitor a Linux host’s latency from end-point to end-point by applying our ready-to-use, pre-configured script.
The script uses the ping command to retrieve detailed information about latency from one host to another, and users can specify a list of hosts. It has been validated and tested on Ubuntu 20.04 LTS.
You can find these scripts in our library. Simply personalize the drivers according to your requirements.
Following, you can see examples of the data you can extract through this specific custom script:
Improvements on Domotz
Advanced Scan via TCP on Routed Subnets
Domotz’s network scanning capabilities have become more powerful. You can now configure scans on Routed Subnets using the TCP port monitoring mechanism instead of the ICMP mechanism.
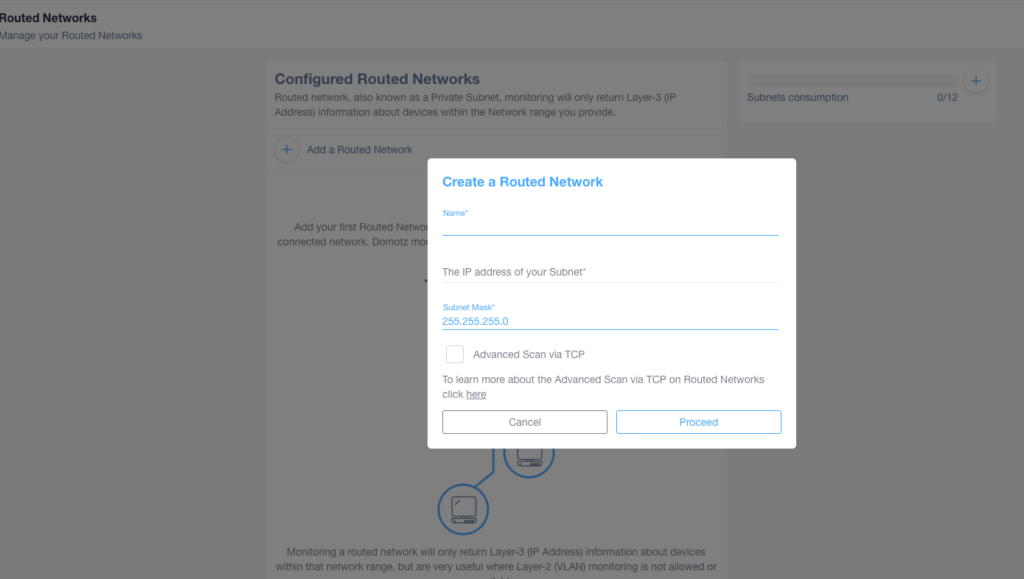
The Advanced Scan via TCP offers a robust alternative if devices cannot be effectively identified and monitored via simple ping (ICMP mechanism). This feature provides the flexibility to monitor devices on Routed Subnets with greater accuracy and reliability.
With Advanced Scan via TCP, you can ensure comprehensive visibility into your network environment, even for devices that are not responsive to ICMP-based scans. This improvement aligns with our commitment to offering adaptable and effective solutions for your network monitoring needs.
For detailed information on configuring Routed Network Scans using the Advanced Scan via TCP feature, we encourage you to refer to the comprehensive guide available at How to Configure Routed Network Scan.
Creating and Editing Custom Filters from Monitoring Dashboard
We have expanded the capability to create and edit Custom Filters directly from the Monitoring Dashboard interface.
This improvement streamlines the process of creating monitoring tables that involve dynamic lists of devices and entities. When configuring a Monitoring Table and selecting a dynamic list of devices and entities, you can now access the editing section of Custom Filters right from the Monitoring Dashboard area.
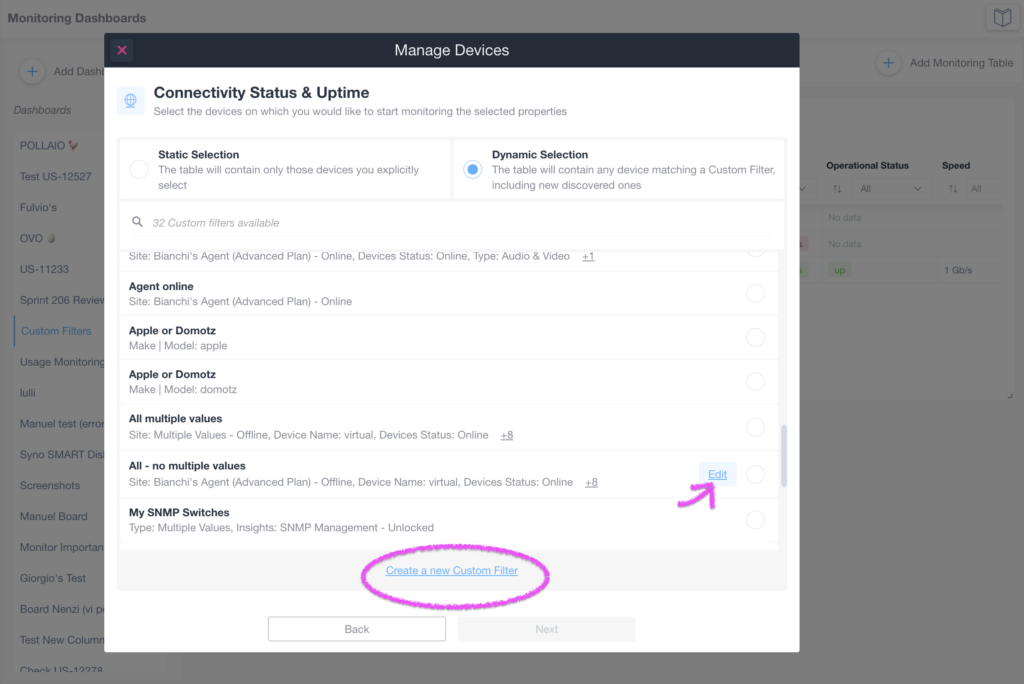
With this enhancement, you no longer need to navigate away from the Monitoring Dashboard to create or modify custom filter rules. This seamless integration ensures a smoother process for creating monitoring tables based on dynamic selections of devices and entities.
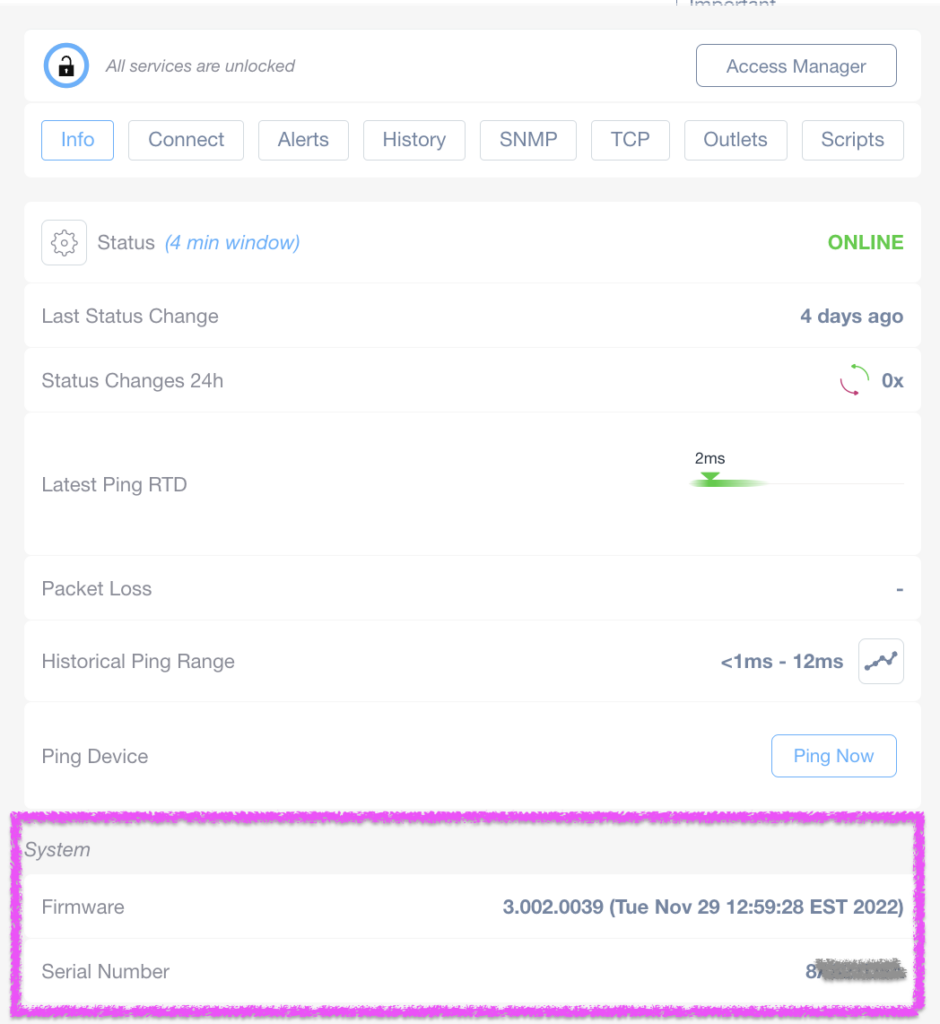
Standardized Serial Number and Firmware Version
We are excited to introduce a significant enhancement to how Domotz extracts and reports critical device information. With this improvement, Domotz consistently standardizes the extraction and reporting of each device’s serial number and firmware version.
Whether extracted through SNMP, UPnP, Bonjour, WMI, Custom Script functionality, or other protocols, these critical details are now presented under each device’s System section of the Info tab. In this way, you can easily access and identify these essential pieces of information.
The standardization of serial numbers has other benefits. The firmware version will be vital in synchronizing with Documentation systems and Asset Management platforms like, for instance, IT Glue. Additionally, these standardized details will be reflected in the Domotz Inventory Dashboard.
This improvement streamlines your network documentation processes and enhances overall asset management. You can confidently rely on accurate, standardized information when collaborating with documentation systems and asset management platforms.
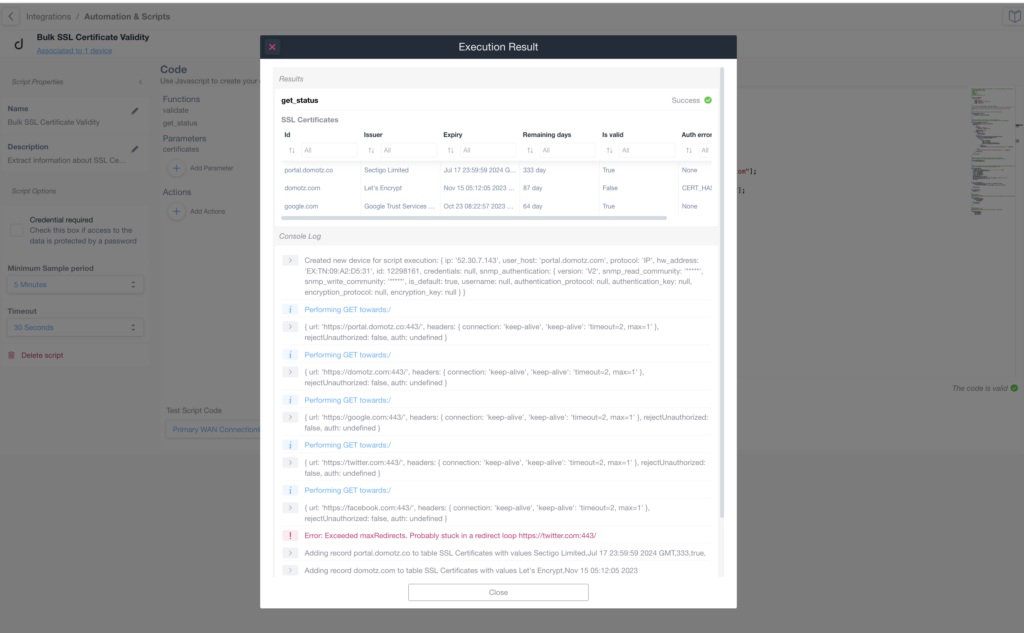
Enhanced “Test Script Code” Section
We are excited to share a significant enhancement to the Domotz IDE experience for testing Custom Scripts. The execution result window when testing a custom script in the Domotz IDE has undergone substantial improvements aimed at simplifying the process of debugging scripts.
With this enhancement, the execution result window now provides a clearer and more informative experience for script debugging. Introducing new types of information, warning, and error messages in the Execution Result enhances your ability to identify and understand errors or unexpected behaviors in your scripts.
This improved visibility streamlines the debugging process, making pinpointing specific issues and taking corrective actions easier.
As a next step, we will continue refining this area to provide you with a seamless and intuitive platform for writing custom scripts. This ongoing effort aims to empower you to create and fine-tune custom scripts more easily and efficiently.
Stay tuned for more updates as we work diligently to make writing custom scripts an even more user-friendly and productive experience.
As always, we value your feedback and are here to assist you. If you have any questions or require support, please don’t hesitate to contact our team.
Increase Vertical Scrollbar within the WebApp
We have increased the width of the Vertical Scrollbar within the WebApp interface, enhancing usability for users who do not have a touchpad or a mouse with a scrolling wheel.
With this improvement, navigating through pages within the WebApp becomes more convenient, as the wider scrollbar makes it easier to grasp and scroll up and down. This improvement ensures a seamless user experience regardless of the input device being used.
We continuously enhance the usability of the Domotz WebApp. Your feedback is valuable in driving these improvements. If you have any suggestions or encounter any issues, please don’t hesitate to contact our support team.
Fix
We’ve fixed the following issues:
- Missing label on DHCP Variables.
- Searching for variables with the character “_” in the name was impossible.
- Sorting tables in the Monitoring Dashboard when opening a new window was causing sporadic crashes in the App.
- Uptime stats for 30 days time-window wrongly reported 0% in some circumstances.
- Netgear Switch M4300-12X12F was wrongly identified as an HTTP PoE version.
- Cisco Sx220 PoE switch integration did not require credentials after identification.
- Attempting to delete 2 Drivers subsequently crashes the WebApp.
- Halo PSA general ticket default did not match the Domotz ticket type.
- The Domotz Agent retrieved incorrect values for Serial Numbers through the Bonjour protocol.
- Script execution with AUTHENTICATION_ERROR incorrectly stored credentials when sending credentials.store = true.
- A Custom Script with the wrong variable type could crash the backend component.
- Dell iDRAC issue unlocking the device.
- Fixed an issue that prevented the deletion of the Unifi Cloud Controller.
Known limitations
- There is no central repository for all the alerts configured on SNMP PreConfigured, OS Monitoring, and Custom Integration script sensors.
- Monitoring Dashboards are currently limited to Monitoring Tables as Widgets.
- Luxul Router-based Agents do not support VPN on demand. To elaborate, we’ll add this capability as soon as Luxul’s team provides us with the required API.
- You can’t configure the static IP address on the Domotz Box before configuring the Agent.
- Lastly, you can’t leverage DHCP on additional VLANs on the Domotz Box.
These release notes cover the changes, including Domotz Pro Cloud, Domotz Agent, and Domotz Pro App. Learn more about our software on our website or read our blog to stay updated with modern network and IT Infrastructure monitoring and management.