We are thrilled to share the latest improvements on Ubiquiti UniFi Controllers, enhancements, new integration scripts, and updates from Domotz.
We highly value your feedback and encourage you to contact our support team at support@domotz.com for any comments, questions, or suggestions you may have.
New features and integrations
New feature
Support Accounts with MFA on Ubiquiti UniFi Controllers integration
Firstly, we introduce support for Multi-Factor Authentication (MFA) within the integration of Ubiquiti UniFi Controllers. This new feature provides enhanced security and flexibility for you by offering two distinct options for account management:
- Option 1 (recommended): Configure a Local Admin Account – This approach is ideal for users who need a simple configuration flow and serves as an effective workaround for your Sites even after the Ubiquiti Cloud Accounts MFA enforcement.
- Option 2: Use the Multi-Factor Authentication Seed – Specifically designed for users who need to comply with stringent security protocols, this option ensures that MFA is fully integrated and operational, providing more protection.
Local UniFi Controller accounts already in use by users would remain unaffected.
Our help article, Ubiquiti UniFi Integration, provides a comprehensive guide to help you implement this feature seamlessly. We encourage you to take advantage of these new capabilities to enhance your network security.
New Integration Scripts
MacOS
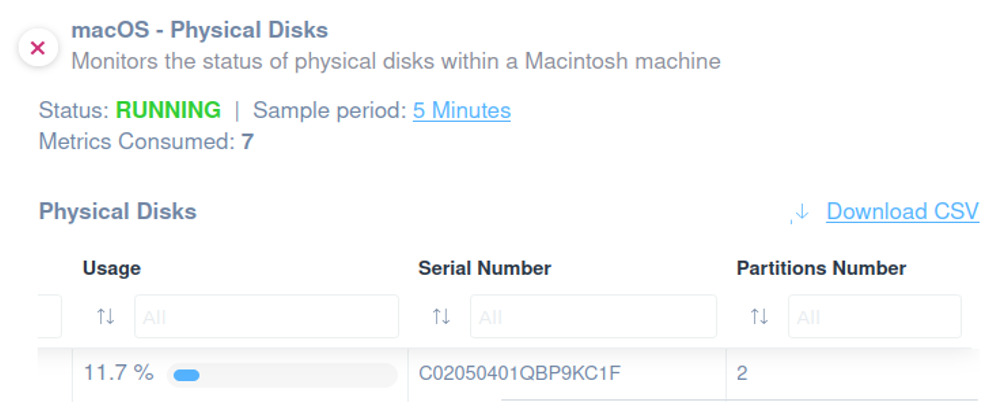
Physical Disks
You can use this script to monitor physical disks on a Macintosh machine.
You will be able to monitor the following:
- ID
- Model
- Status
- Size
- Free space
- Usage
- Serial number
- Partitions number
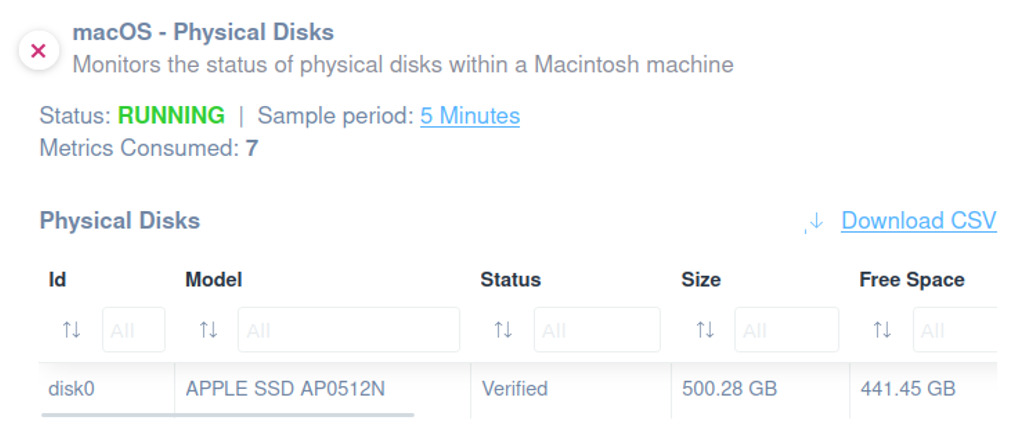
The script uses SSH to execute commands on macOS, and we have validated and tested it on macOS Version 14.5.
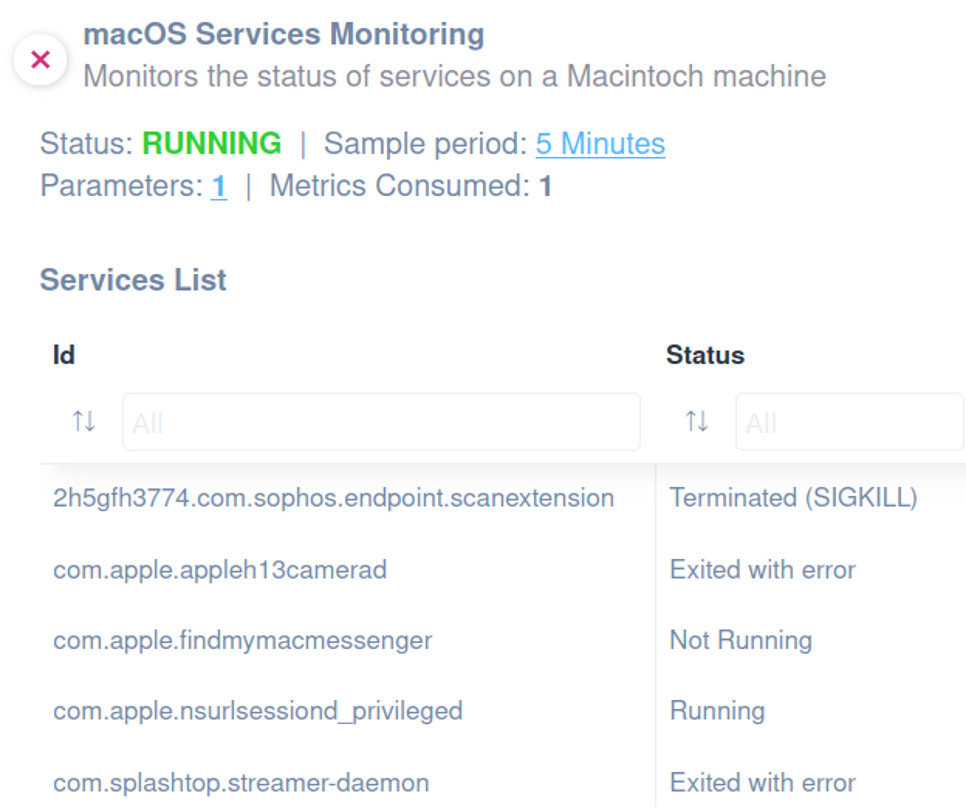
Services
Apply this specific script to monitor the status of services on a Macintosh machine.
You will be able to monitor the following information:
- ID (service name)
- Status
The script uses SSH to execute commands on macOS, and it has been validated and tested on macOS Version 14.5.
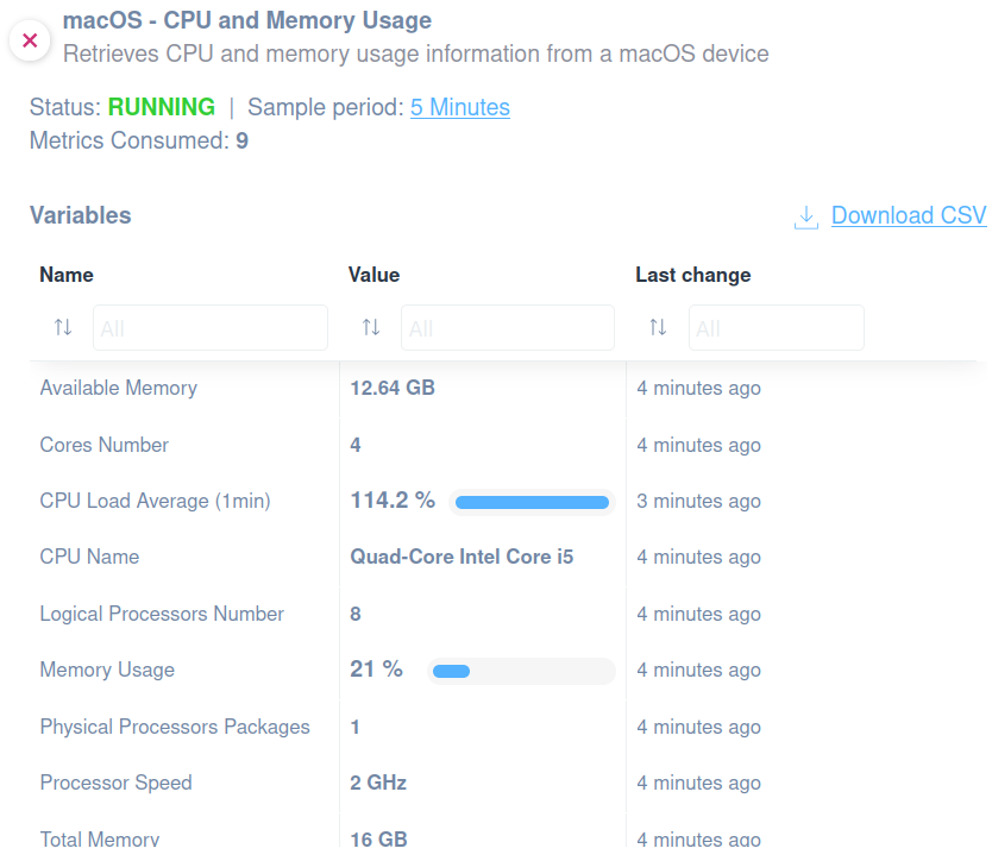
CPU and Memory
We developed this script to simplify the Mac CPU and Memory management.
Easily select and apply the script to extract the following information:
- Total memory
- Available memory
- Memory usage
- CPU Name
- Processor Speed
- Physical Processors Packages
- Logical Processors Number
- Cores Number
- CPU Load Average (1min)
The script has been validated and tested on macOS Version 14.5. It uses SSH as a communication protocol for executing commands on macOS.
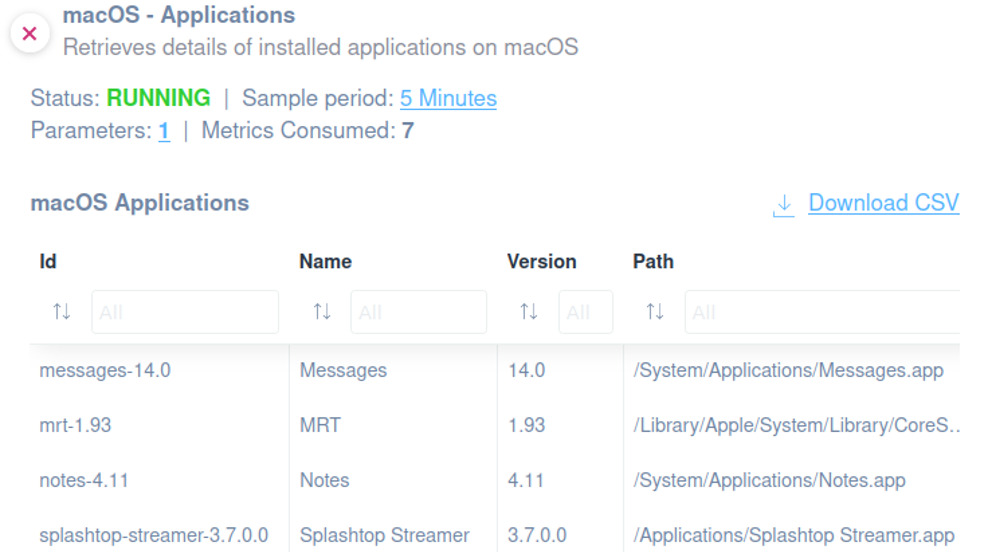
Applications
You can use this script to monitor applications installed on a Macintosh machine.
Use the script to monitor the following information:
- Name
- Version
- Path
- Architecture
- Last Modified
- Source
- Signed by
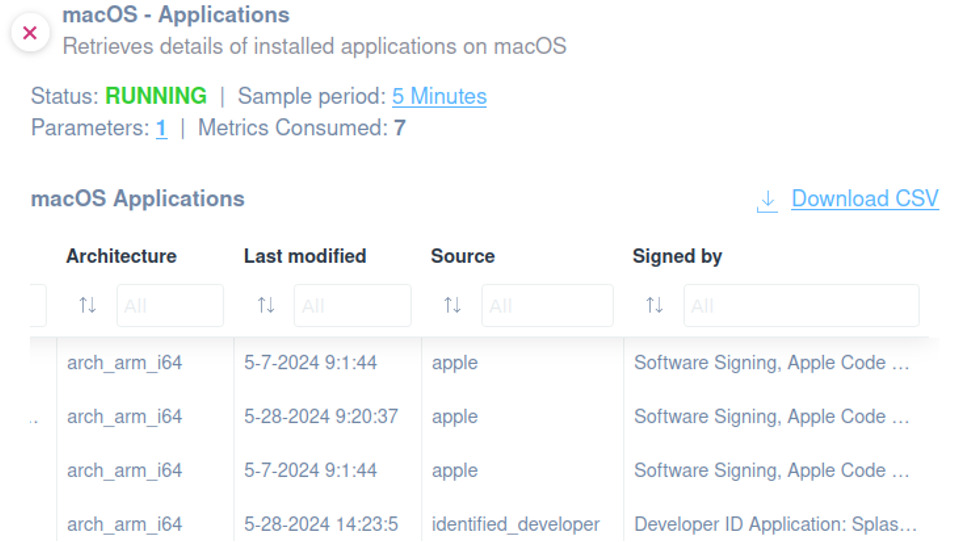
We tested the script and confirmed it works on macOS Version 14.5, using SSH as the communication protocol to execute commands on the system.
VMware ESXi
General Information
You can easily apply this script to oversee your VMWare ESXi general information effectively.
The following information can be monitored:
- Name
- Connection State
- System Model
- System Vendor
- Number of NICs
- Number of HBAs
- Product Version
- API Version
- OS Type
- Product Line ID
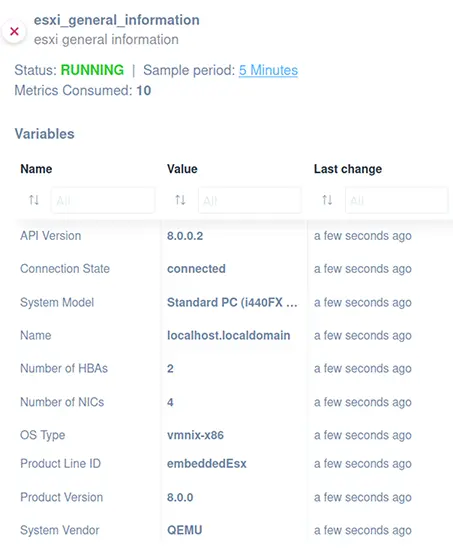
The script uses the HTTP protocol, and it has been validated and tested on VMware vCenter 8.0.2
CPU Details
Use this script to monitor and retrieve detailed CPU information on ESXi hosts.
Apply the script to be able to extract the following:
- CPU Vendor
- Speed (Hz)
- Bus Speed (Hz)
- CPU Name
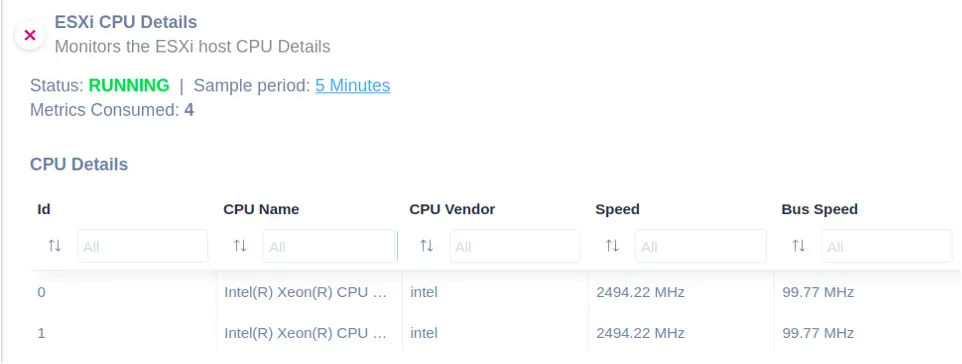
The script has been validated and tested on ESXi 8.0.0. It also uses the HTTPS protocol.
Services
This script might be used to monitor and manage services on ESXi hosts.
The following information can be monitored:
- Name
- Is Required
- Is Uninstallable
- Is Running
- Policy
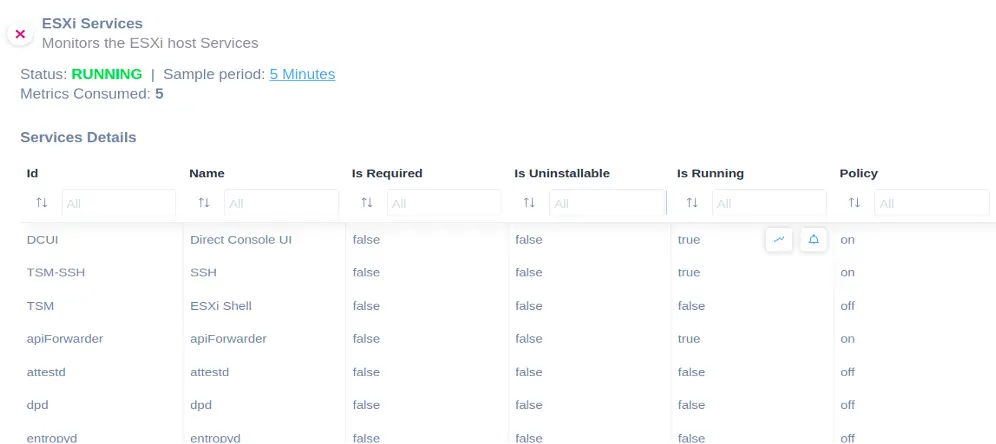
As the previous one, it has been validated and tested on ESXi 8.0.0 and uses the HTTP protocol.
File System Volume
Proactively monitor and manage file system volumes on ESXi hosts by applying our integration script.
Easily apply the script in order to monitor the following:
- Name
- Type
- Access Mode
- Is Accessible
- Capacity
- Block Size (MB)
- Max Blocks
- Major Version
- Version
- Disk Name
- Partition
- Path
- Is VMFS Upgradable
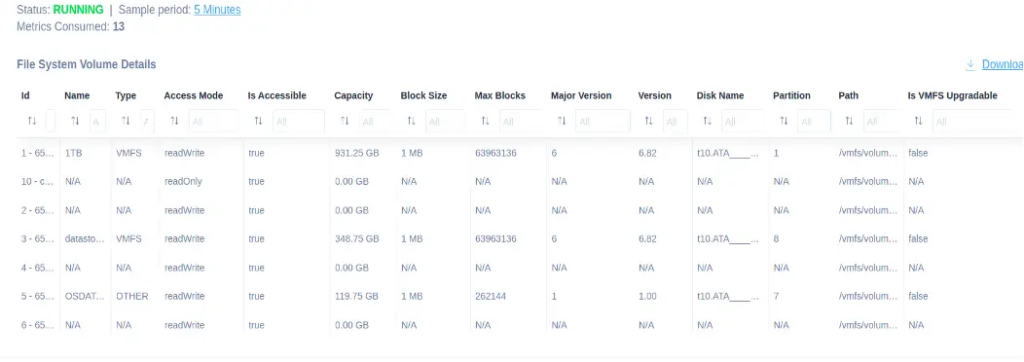
The script uses the HTTPS protocol. It has been validated and tested on ESXi 8.0.0.
Physical NIC Configuration
Use our script to monitor and configure the physical NIC settings on ESXi hosts.
The following information can be monitored:
- Device
- PCI Slot
- Driver
- Link Speed (Mb)
- Duplex
- DHCP Enabled
- IP Address
- Subnet Mask
- Wake-on-LAN Supported
- MAC Address
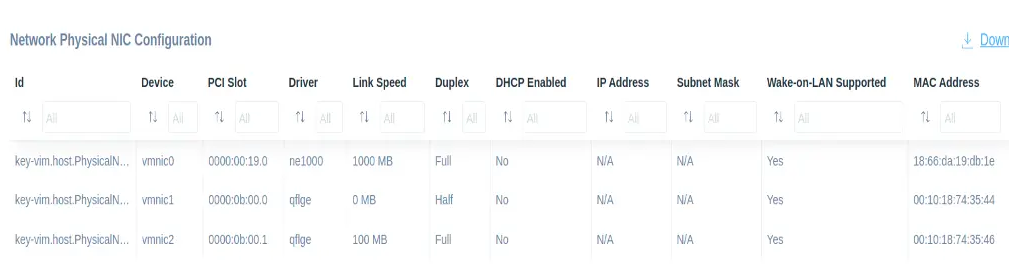
The script has been validated and tested on ESXi 8.0.0 and uses HTTPS protocol.
Virtual NIC Configuration
Monitor and configure the virtual NIC settings on ESXi hosts by applying this script.
You can monitor the following metrics:
- Device
- Port Group
- DHCP Enabled
- IP Address
- Subnet Mask
- MAC Address
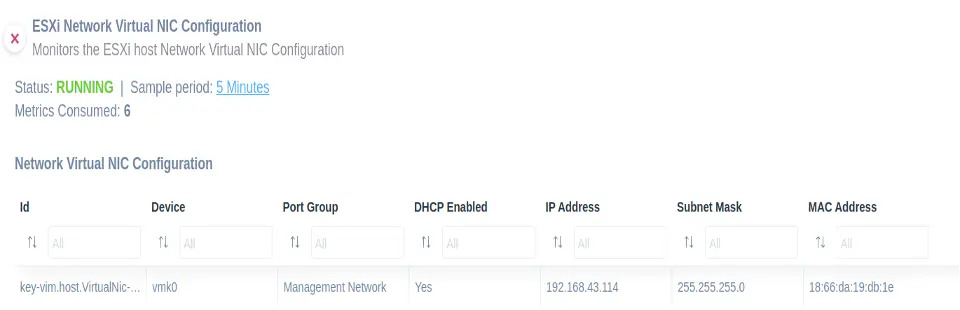
The script has been validated and tested on ESXi 8.0.0 and uses the HTTPS protocol.
CPU and Memory Information
This script lets you gather a detailed view of ESXi hosts’ CPU and memory usage.
The following information can be monitored:
- Memory Usage (GB)
- Memory Size (GB)
- CPU Usage (GHz)
- CPU Speed (GHz)
- CPU Model
- Number of CPU Cores
- Number of CPU Threads
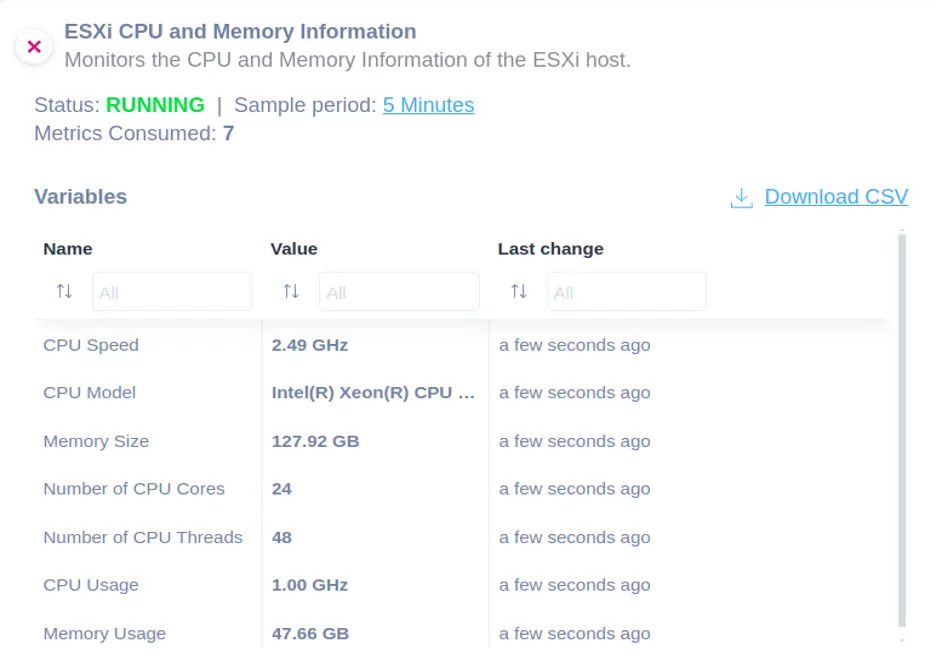
The script uses the HTTPS protocol. It also has been validated and tested on ESXi 8.0.0.
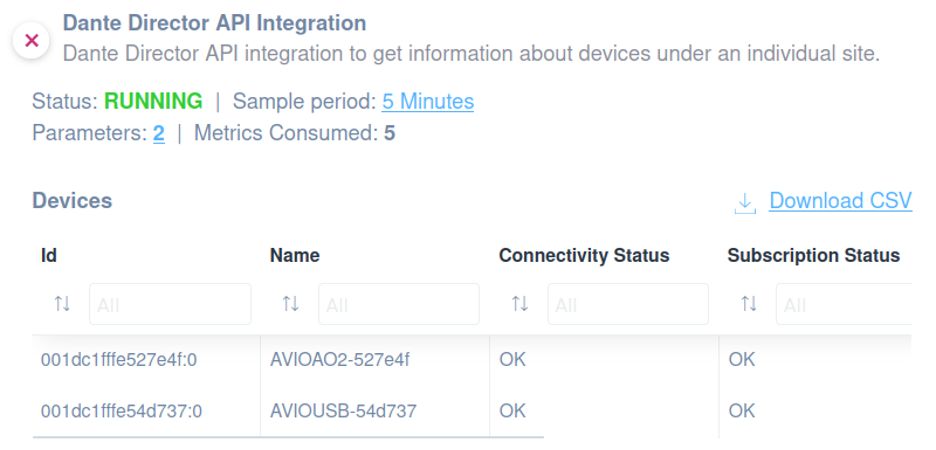
Dante
Director Device Status
Our script integrates seamlessly with the Dante Managed API. This will allow you to easily monitor and manage Dante devices.
It provides comprehensive details on each device, including the following:
- Name
- Manufacturer Name
- Product Model
- Dante Version
- Address
- Status ID
- Clocking Status
- Latency Status
- Connectivity Status
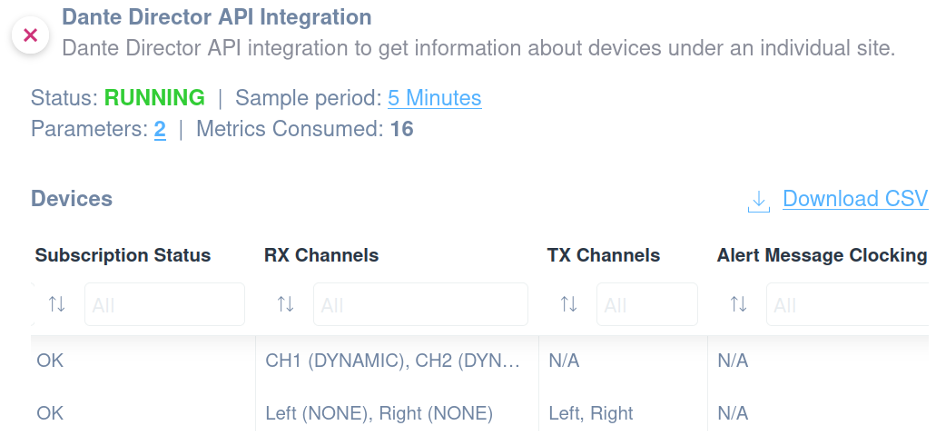
- Subscription Status
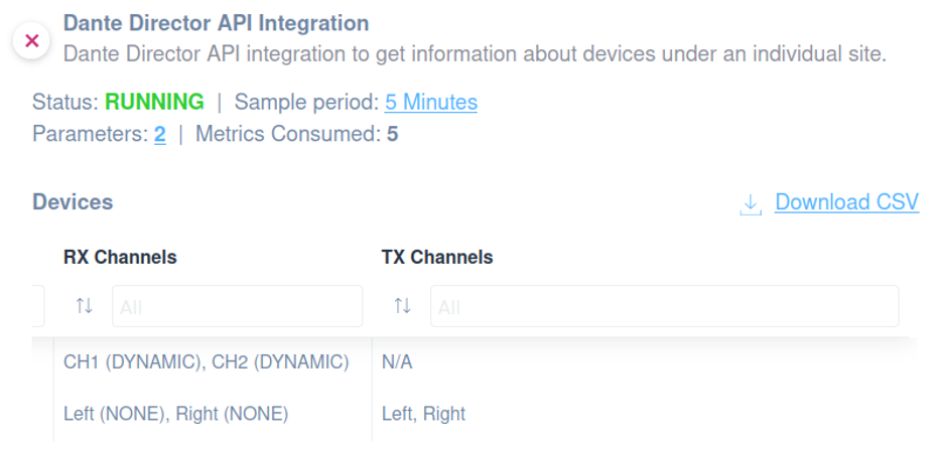
- RX Channels
- TX Channels
- Alert Message Clocking
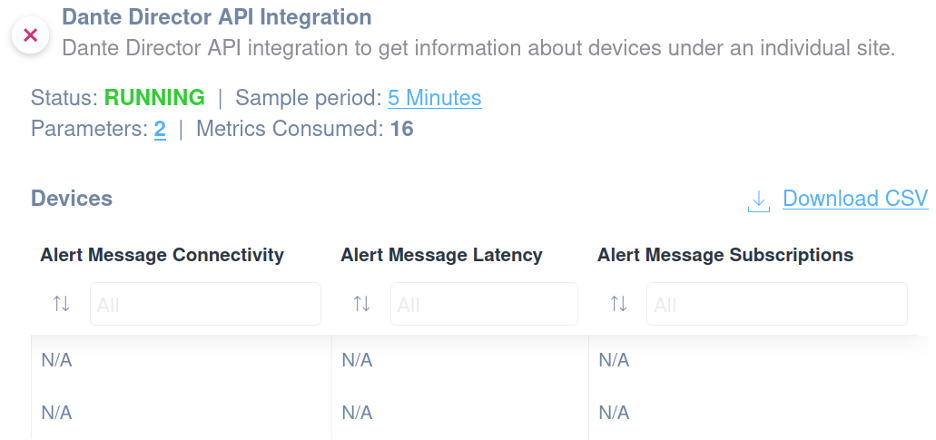
- Alert Message Connectivity
- Alert Message Latency
- Alert Message Subscriptions
The script has been validated and tested with the Dante Director using the Dante Managed API. In addition, it uses the HTTPS protocol.
SonicWall Firewall
Failover Load Balancing Groups
Apply this script to monitor the failover load balancing groups on a SonicWall firewall.
You can get access to the following information:
- Group Name
- Member Name
- IP Address
- Link Status
- Load balancing status
- Probe status
- Main target status
- Alternate target status

The script uses HTTP as a communication protocol.
Enhancements
Collector Settings Section
We’re continuing to work on adding new information and details in the Collector Settings section. These updates aim to further centralize the initial configuration and management processes, allowing users to enjoy a more streamlined and efficient way of managing their collectors.
This month, you’ll see significant improvements regarding the following:
- Access Management
- Support Team
- Manufacturer Support
- Residential Support App
We implement these changes to improve customer information and provide better visibility into key properties, ultimately enhancing the user experience.
Access Management
This section allows you to manage access to people from the same organization to access, in a controlled way, the same pool of Network Collectors. and grant complete access to your Network Collector and Devices to a trusted person with a Domotz Account, even if this person is outside your organization.

Support Team
Through this tab, you can enable access for Domotz Support Team, if requested, when opening tickets.

Manufacturer Support
By accessing this section, you’ll grant access to your Network directly to the manufacturer. Please note that the access will expire 3 hours after it is activated.
Please note that this section is only visible when supported devices are present in the network.
Residential Support App (or residential and integrator use)
In this section, you can enable your Customer to access their network through the Violet – Residential Support App, and manage their permissions, limiting Devices visibility or actions.

New MIBs
- WatchGuard Wireless Access Points
- Pepwave
- Peplink
Fixes
- Re-add “Back Button” for Desktop App users
- Device Interfaces tab: not always displaying reachable devices on the ports
- Preventing Unifi Controller-connected devices from toggle PoE control
- The PoE option was not visible on Switch devices integrated with External Cloud services
- Domotz WebApp login page: freezing when using Keeper password manager
- Collector Settings and Inactive Sites URLs in Persistent Devices emails
- Scroll missing from integrations mf
- Communication channels are constantly being fetched in the integrations of mf
- Preventing IP Addresses List/Range options from being displayed in the Monitoring Configuration view
- ESXi Devices: it was not displaying the Virtual Machine list in the System tab
- Sites Explorer Map: where clustered pins were not being updated correctly when inner Sites status changed
- Auto-Closure feature for HaloPSA Ticketing System, which was causing a wrong update of tickets
- Ubiquiti Unifi devices are erroneously as locked
- Rendering issues on the Ubiquiti Unifi Access Point tab
- Collector Location: Agent Location change broken on MF Collector Settings
- Devices Interfaces tab: showing 1 Reachable Device instead of mapping it directly on the port