
We have exciting new features, custom scripts, and improvements available on Domotz. This month’s exciting new updates include a new discovery mechanism for Azure, the replacement of “Sensors” with “Metrics”, the Serial Number discovery (with Synchro and IT Glue) and more.
In summary, here’s what’s new and improved on Domotz this month.
- GlassWire For Business (GW4B)
- Domotz Channel Partner Program (DCPP)
- New Discovery Mechanism for Microsoft Azure Networks
- Protectli Hardware available with Domotz Pre-Loaded
- Domotz Metrics Replace Sensors
- Serial Number Advanced Management
- Routed Network information available in the Inventory Dashboard
- Action Labels in the Custom Scripts Editor
- New Privacy Policy and Terms and Conditions
- Alerts for IP Conflict Detected
Fix
We are always improving Domotz and welcome your feedback. Please get in touch with our support team at support@domotz.com for help or suggestions.
New features
New Discovery Mechanism for Microsoft Azure Networks
Microsoft Azure Virtual Private Clouds have unique network configurations, which can pose challenges for traditional network discovery mechanisms. The default configuration of the Domotz Collector (Agent) may not effectively discover all the endpoints, such as Virtual Machines, configured within these networks.
Azure networks are typically Layer-3 only networks. When scanned with conventional tools, all endpoints often appear with the same MAC Address as the network gateway, making it difficult for the Collector, configured with default settings, to scan, identify, and monitor these endpoints.
With this new setting we enable the Domotz Collector to be used effectively within Azure networks addressing the issue. This setting allows for discovery on a Layer-3 protocol.
If you have Domotz Collectors within Azure networks and would like to configure them with this new setting to enhance network visibility and monitoring capabilities, please send a request to our support team at support@domotz.com.
This new feature is designed to enhance network monitoring within Microsoft Azure environments, ensuring accurate and comprehensive discovery of endpoints.
Protectli Hardware available with Domotz Pre-Loaded
We have a new partnership with Protectli. This will provide an easy-to-install, Intel-based hardware solution for Domotz users requiring enhanced performance and simple management. This solution comes pre-installed with an Ubuntu operating system and the associated Domotz Collector. It offers the flexibility to add more software services as needed.
The Protectli box is a compact, generic PC designed for versatility. Its standard configuration features both WAN and LAN ports, allowing you to choose the network interface for Domotz. Domotz can scan either port for devices or cloud connectivity. Additionally, the system can be configured to use one port for LAN traffic and a second port for connecting to an Internet Service Provider (ISP). This is especially useful for creating air-gapped solutions within a network.
Note:
As compared to the Domotz Box (Model B-12):
- The Protectli solution offers higher throughput for Internet Speed Testing
- The Protectli solution offers better performance for advanced networks that require SNMPv3 monitoring
- The Protectli solution offers the ability to monitor more VLANs and subnets
- The Protectli solution offers users the ability to run 3rd Party software along with the Domotz Agent.
- The Protectli solution performs better on wider networks (e.g. networks with /16 subnets – also called Big Network scans in Domotz)
- For added security and transparency, the Protectli solution uses coreboot as focused on the boot and BIOS process. For more information, please visit this article.
As a matter of fact, the above mentioned features require higher hardware resources which are somehow limited on the Domotz Box (based on an ARM chipset – as opposed to the Protectli one based on an Intel one). For this reason, if you need a more powerful (but still dedicated) hardware for scanning and monitoring your network, we recommend using the Protectli one.
You can easily access to the Protectli store directly from the Domotz Portal. There, you can explore and purchase this hardware solution.
This new feature enhances the available hardware options, allowing you to select the right solution for your network monitoring needs. For more information, please visit the dedicated Domotz-Protectli integration page.
New Custom Scripts
You can use the custom scripts to monitor and manage network-connected devices, cloud services, and web applications. By using standard network protocols, these scripts will allow you to retrieve valuable data and execute actions on the monitored devices and services.
This month, we released the following:
- Crestron TSW – General Monitoring
- Lenovo XClarity
- General Health
- Power Supply Health
- Storage Health
- Temperatures
- Cooling System Health
- Memory Health
- Processors Health
- Linux Updates (apt-based)
- Count
- List
- IBM iSeries AS400 – Power Action
- Proxmox
- General monitoring info
- VM List
Crestron TSW – Connection and Calendar Synchronization Status
You can apply our custom script to your Creston TSW touchscreen to extract connection and calendar synchronization status. The script has been validated and tested on the Crestron TSW-760.
You may find this script inside the Domotz Integration Scripts Library.
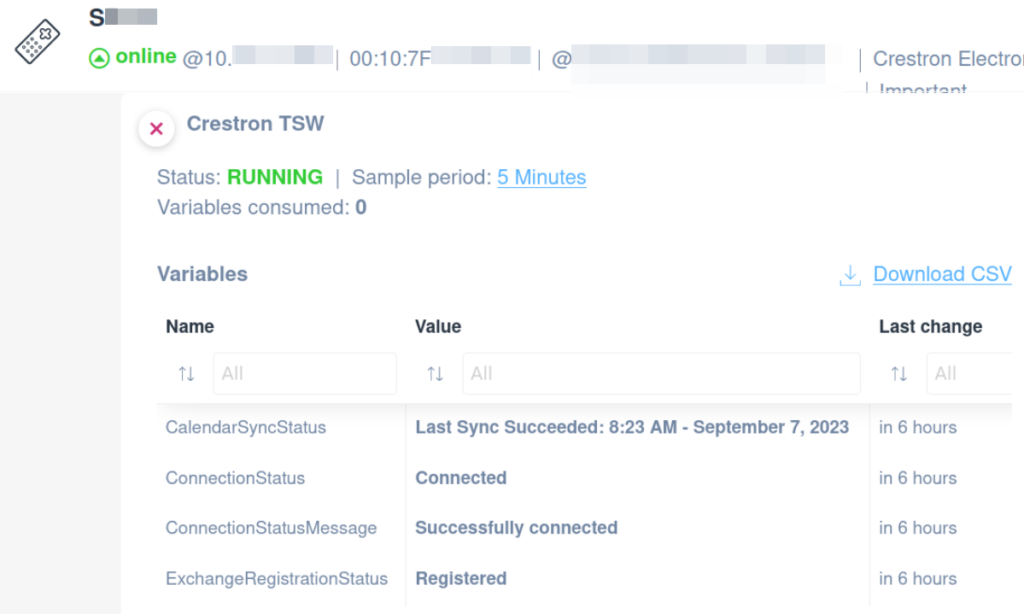
Device Status and Variable Overview
1. The device, "Crestron TSW," is currently running, as indicated by the status "RUNNING."
2. The sample period is set to 5 minutes, with zero variables consumed.
3. A table lists variables with three columns: "Name," "Value," and "Last change."
4. For "CalendarSyncStatus," the last sync succeeded at 8:23 AM on September 7, 2023.
5. "ConnectionStatus" is marked as "Connected," while "ConnectionStatusMessage" shows "Successfully connected."
6. "ExchangeRegistrationStatus" is labeled as "Registered."
7. All listed variables show their last change occurring "in 6 hours."
8. An option to download the CSV of this data is available.
Lenovo XClarity
You can apply our new integration scripts to monitor Lenovo servers with XClarity controllers.
You will be able to monitor the following:
- General/Health
- Power Supply Health
- Storage Health
- Temperatures
- Cooling System Health
- Memory Health
- Processors Health
The scripts have been validated and tested on XClarity 8.42. You may find these scripts inside the Domotz Integration Scripts Library.
General/Health
This script will help you to monitor your servers general health. When applied, it creates a variable section with the following:
- Cooling Devices: cooling devices status
- Local Storage: local storage status
- Memory: memory status
- Power Modules: Power Supply Units status
- Processors: processors’ status
- System: general system status
- Restarts: the number of system restarts or reboots
- State: the state of the OS
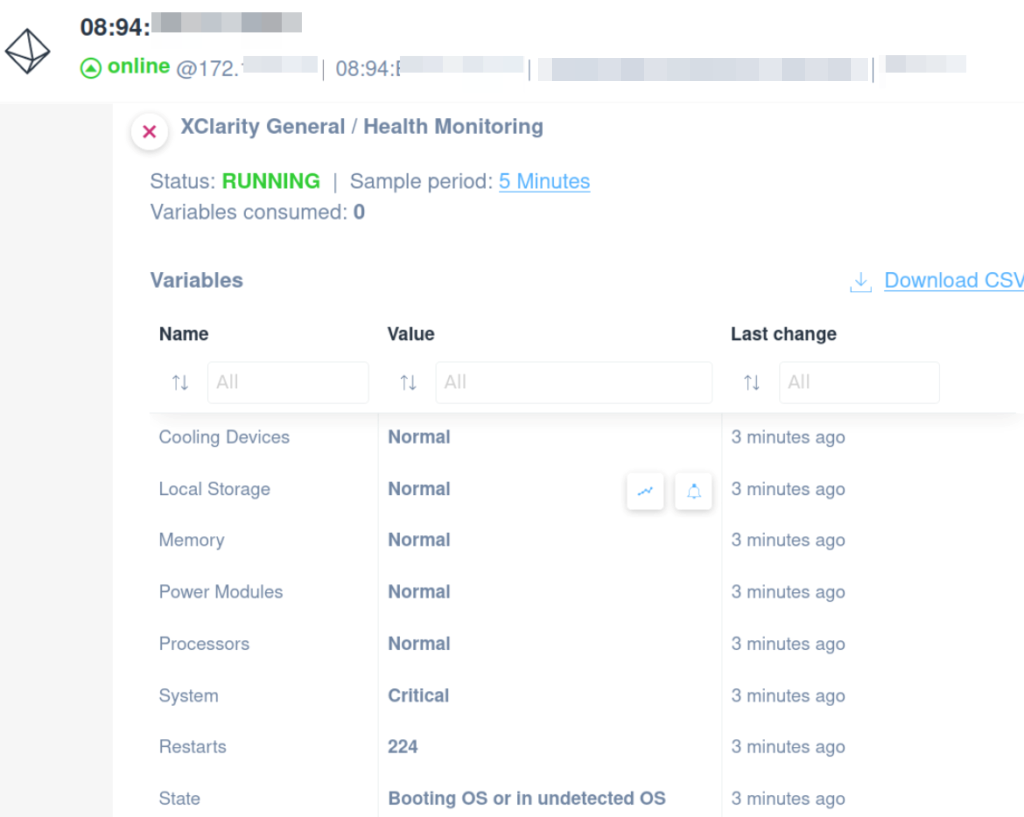
XClarity Health Monitoring Overview
1. The status is displayed as "RUNNING" in green, indicating the system is operational.
2. The sample period for monitoring is set to "5 Minutes."
3. No variables are consumed, with a count of "0."
4. Under "Variables," various system components are listed with their statuses:
- Cooling Devices: Normal
- Local Storage: Normal
- Memory: Normal
- Power Modules: Normal
- Processors: Normal
- System: Critical
- Restarts: 224
- State: Booting OS or in undetected OS
5. The "Last change" column indicates all changes occurred "3 minutes ago."
6. Options to download the data in CSV format are available.
Power Supply Health
This script can monitor your servers the Power Supply Unit(s) (PSU). When applied, it creates a a table section with the following columns:
- PSU id
- Status
- Rated Power (W)
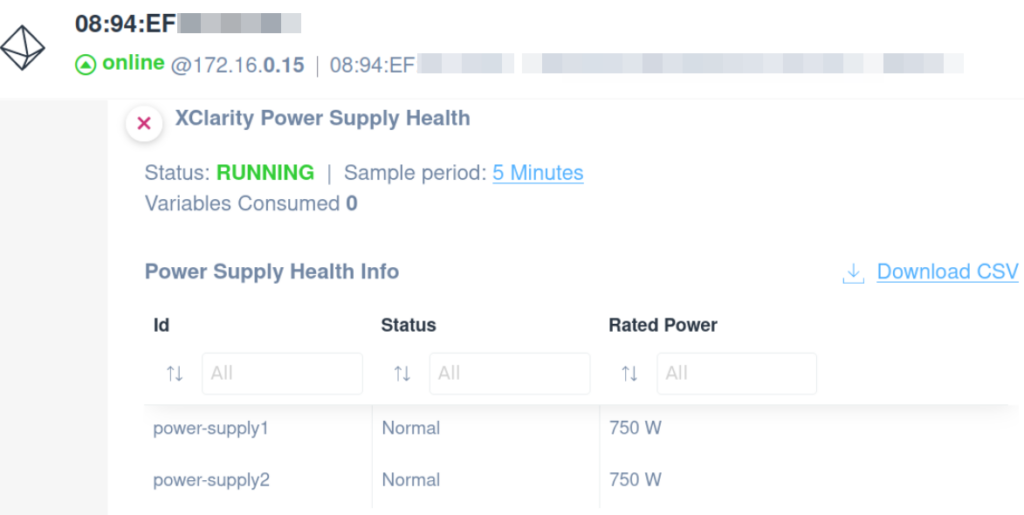
XClarity Power Supply Health Overview
1. The device with MAC address 08:94:EF is online, shown with an IP address of 172.16.0.15.
2. The status of the XClarity Power Supply Health is RUNNING with a sample period of 5 minutes and zero variables consumed.
3. The Power Supply Health Info section displays a table with the columns: Id, Status, and Rated Power.
4. Two power supplies are listed:
- power-supply1: Status is Normal, Rated Power is 750 W.
- power-supply2: Status is Normal, Rated Power is 750 W.
5. Option to download the table as a CSV file is available.
Storage Health
The script can monitor your servers storage health. When applied, it creates a variable section with the following:
- Drive Name
- Status
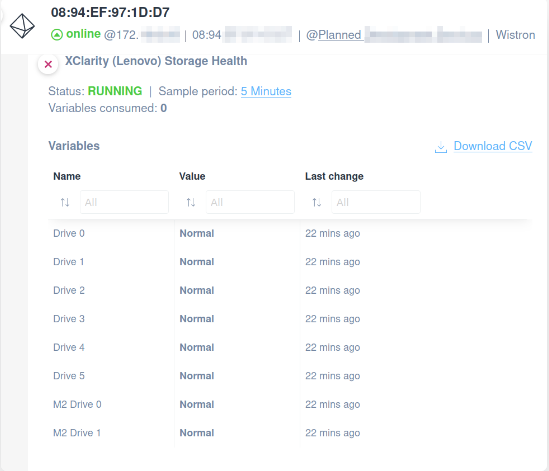
Network Device Storage Health Overview
1. The device identified by MAC address 08:94:EF:97:1D:D7 is online with the IP address listed.
2. The device is currently running, as indicated by the status "RUNNING."
3. The storage health section refers to "XClarity (Lenovo) Storage Health."
4. Sample data is collected every 5 minutes, with no variables consumed.
5. A table displays variable information:
- Columns include Name, Value, and Last change.
- Drives 0 through 6 and M2 Drives 0 and 1 all have a status of "Normal."
- The last change for each drive was recorded 22 minutes ago.
6. There's an option to download the information as a CSV file.
Temperatures
This script can monitor the internal hw components temperatures and their reset thresholds. When applied, it creates a a table section with the following columns:
- Component
- Temperature in F
- Temperature in C
- Warning Reset
- Warning
- Soft Shutdown
- Hard Shutdown
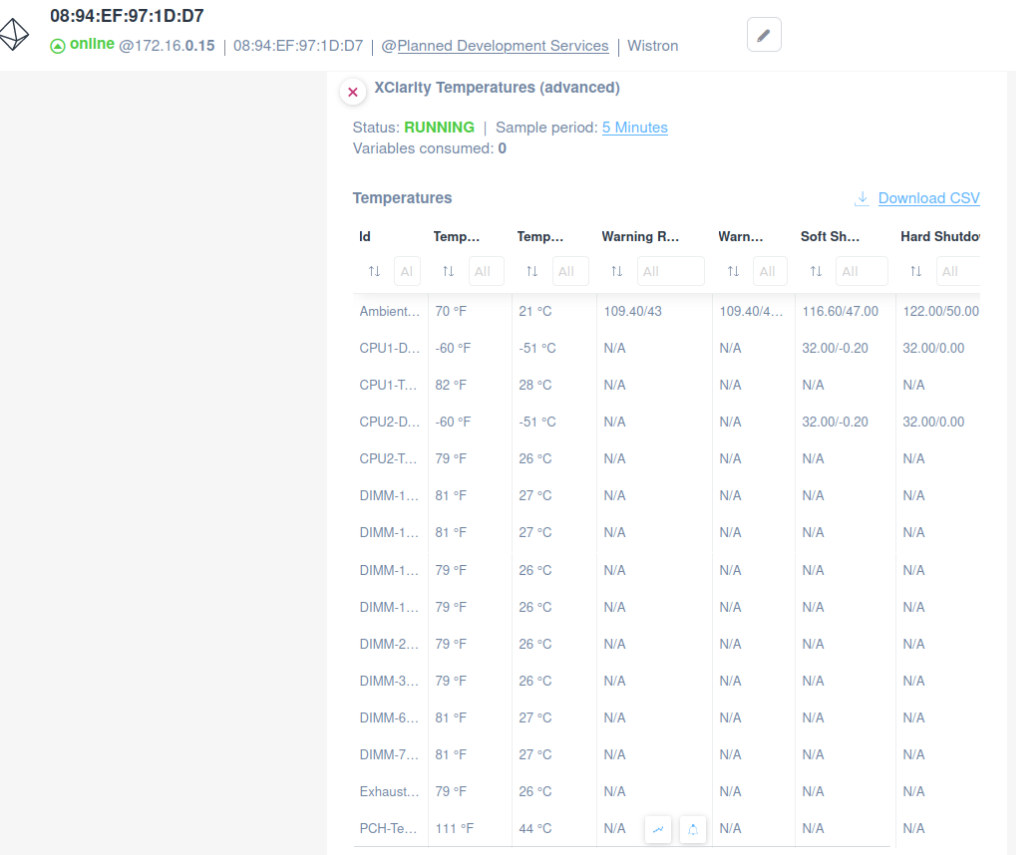
Server Temperature Monitoring Dashboard
1. The dashboard displays a list of server components with their respective temperature readings in both Fahrenheit and Celsius.
2. It shows the current status as "RUNNING" and mentions a sample period of 5 minutes.
3. The table includes columns for:
- Component ID
- Current temperature in Fahrenheit (Temp...)
- Current temperature in Celsius (Temp...)
- Warning thresholds in both Fahrenheit (Warning R...) and Celsius (Warning R...)
- Soft shutdown temperature ranges
- Hard shutdown temperature ranges
4. Components listed include Ambient, CPU temperatures, DIMM slots, Exhaust, and PCH temperature.
5. Some temperature fields show numerical values while others display "N/A," indicating data is not available.
6. A download option for CSV is available for data export.
Cooling System Health
This script can monitor your servers fans heath and properties. When applied, it creates a a table section with the following columns:
- Fan IT
- Speed Value
- Speed Percentage
- Status
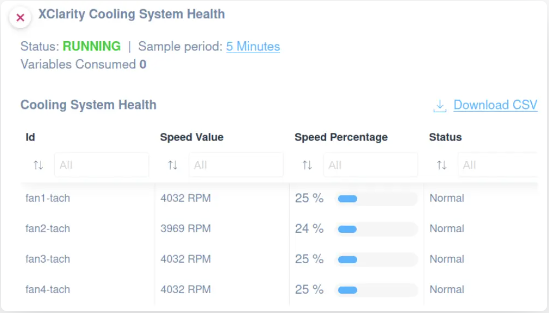
XClarity Cooling System Health Status Overview
1. The system status is indicated as "RUNNING" with a sample period of 5 minutes and zero variables consumed.
2. The Cooling System Health table lists fan IDs with corresponding metrics.
3. For each fan (fan1-tach to fan4-tach), details are provided:
- Speed Value: Displays rotational speed in RPM (revolutions per minute).
- Speed Percentage: Shows the operational speed as a percentage, with a visual progress bar.
- Status: Indicates the current operational state, which is "Normal" for all fans.
4. There is an option to download the data as a CSV file.
Memory Health
This script can monitor your servers memory and its properties. When applied, it creates a a table section with the following columns:
- Memory bank ID
- Status
- Type
- Capacity
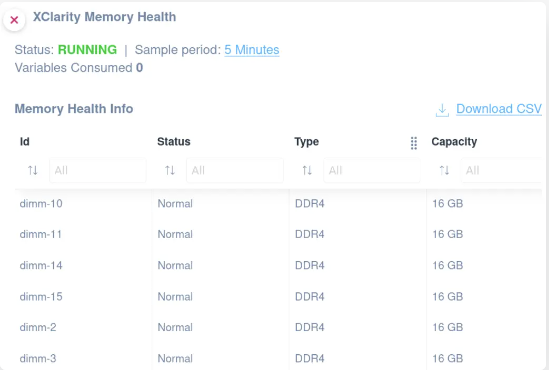
Memory Health Information Dashboard
1. The dashboard shows the status of XClarity Memory Health, which is currently "RUNNING."
2. The sample period is set to "5 Minutes," with "0 Variables Consumed."
3. The "Memory Health Info" table lists details of memory modules, with columns for "Id," "Status," "Type," and "Capacity."
4. Each memory module, such as "dimm-10" and "dimm-3," has a status marked as "Normal," the type as "DDR4," and each has a capacity of "16 GB."
5. A "Download CSV" option is available for exporting this data.
Processors Health
This script can monitor your servers CPU(s). When applied, it creates a a table section with the following columns:
- CPU ID
- Status
- Clock Speed
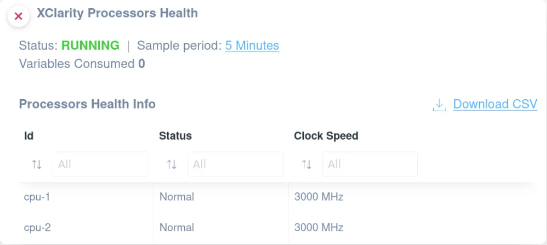
XClarity Processors Health Overview
1. The status of the processors health check is displayed as "RUNNING".
2. The sample period for checking is set to "5 Minutes".
3. No variables have been consumed, indicated by "Variables Consumed 0".
4. Under "Processors Health Info," there is information about each processor:
- "Id" lists the processor identifiers, such as "cpu-1" and "cpu-2".
- "Status" shows the health status of each processor, marked as "Normal".
- "Clock Speed" presents the operating speed, here shown as "3000 MHz" for both processors.
5. A "Download CSV" link is available for exporting the data.
Linux Updates (apt-based)
Monitor Linux Updates Count and List on an apt-based distributions with our custom scripts:
- Linux Updates Count – this script, upon entering a list of packages to track, it retrieves the count of the updates currently available:
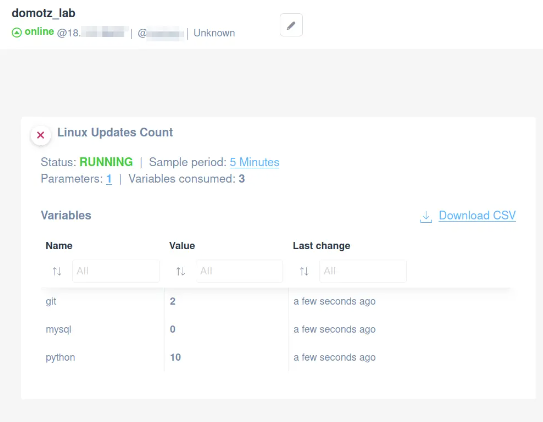
Linux Updates Count Dashboard
1. The dashboard is labeled "Linux Updates Count".
2. Status shows as "RUNNING" with a sample period of "5 Minutes".
3. It involves "1" parameter and has consumed "3" variables.
4. The "Variables" section lists three items with corresponding values and last change times.
- "git" has a value of "2", changed "a few seconds ago".
- "mysql" has a value of "0", changed "a few seconds ago".
- "python" has a value of "10", changed "a few seconds ago".
5. A "Download CSV" option is available for exporting the data.
- Linux Updates List – this script, upon entering a list of packages to track, it retrieves a list of the updates currently available:
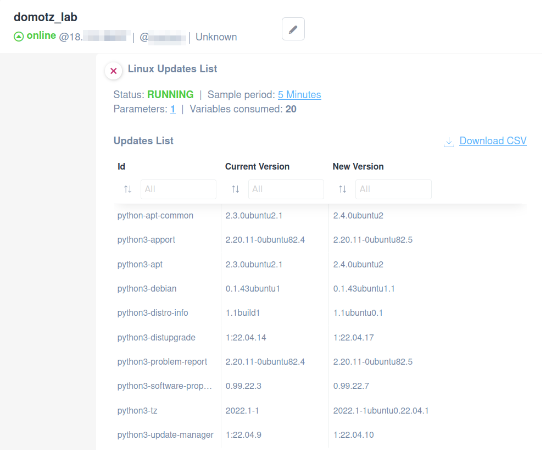
Linux Updates List Overview
1. The header section displays a lab named "domotz_lab" with the current status as online.
2. The updates section shows the status of Linux updates: currently running, with a sample period of 5 minutes. One parameter is used, and 20 variables are consumed.
3. The "Updates List" table contains three columns: Id, Current Version, and New Version.
4. Each row in the table lists software components, their current version, and their new available version for update.
5. Notable entries include updates for "python-apt," "python3-apport," and "python3-distupgrade," among others.
6. A "Download CSV" option is available for exporting the updates list.
Find these scripts in our library You can use them as they are, or you might customize them according to your requirements.
IBM iSeries AS400 Power Actions
This script will allow you to remotely shutdown or reboot an IBM iSeries AS400 server directly from Domotz:
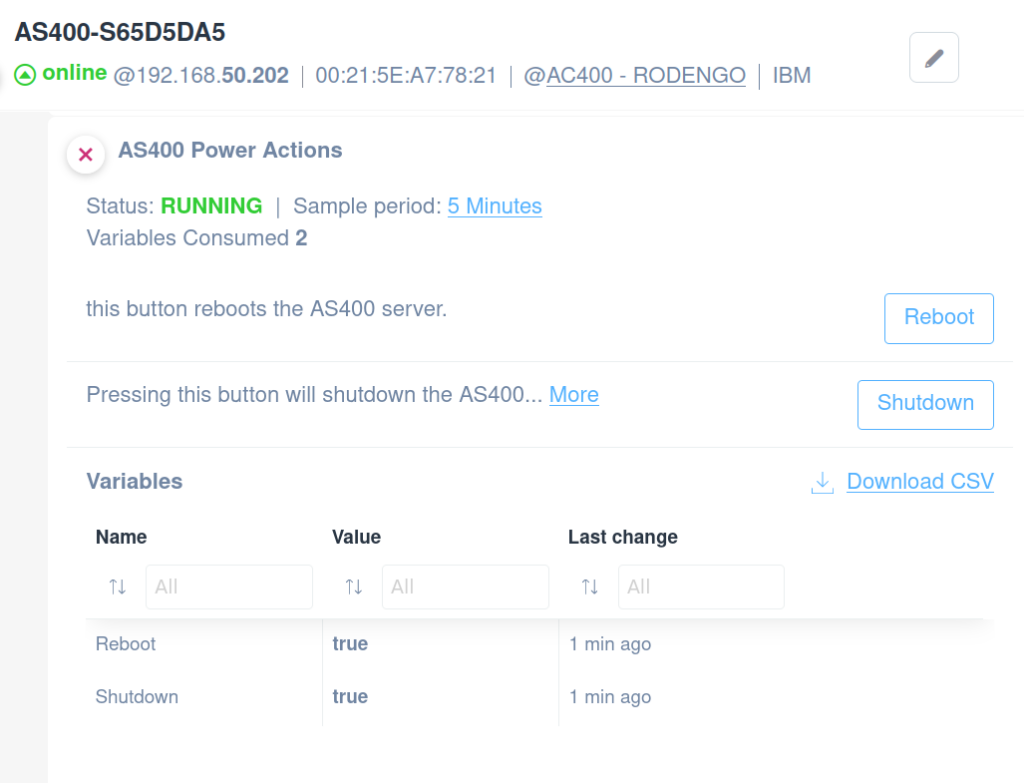
AS400 Server Management Dashboard
1. The server with ID AS400-S65D5DA5 is currently online with IP address 192.168.50.202, displaying a status of RUNNING.
2. The sample period for monitoring is set to 5 minutes, and 2 variables have been consumed.
3. To reboot the AS400 server, press the "Reboot" button.
4. To shutdown the server, press the "Shutdown" button.
5. The "Variables" section lists names and values: "Reboot" and "Shutdown" both set to "true" with the last change occurring 1 minute ago.
6. Option to download the variable data as a CSV file is available via the "Download CSV" link.
Please note that this script has been tested and works only on the Italian version of OS400. If you are using OS400 in another language, please email support@domotz.com requesting a script for your language.
Proxmox
Monitor you Proxmox host with the following Domotz Integration Scripts.
Proxmox General
This script can monitor your Proxmox performance by creating a variable section with the following:
- Average seek time
- Buffered Reads
- CPU BogoMips
- DNS extension
- FSYNC/s
- HD size
- Regex/s
- Version
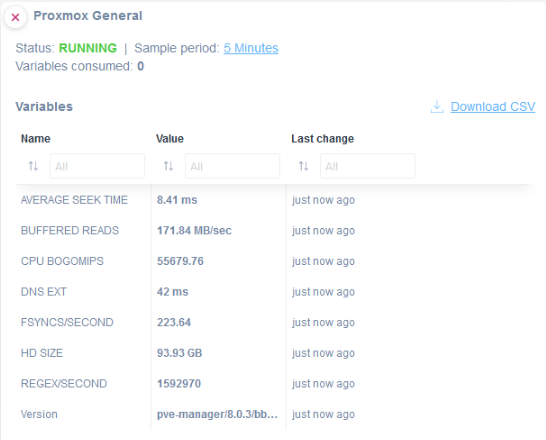
Proxmox General Status and Variables
1. The status of Proxmox is indicated as "RUNNING."
2. The sample period is set to 5 minutes.
3. No variables have been consumed, as the count shows 0.
4. A list of variables is displayed with columns for their names, values, and the last change time. Some of the variables include:
- AVERAGE SEEK TIME: 8.41 ms
- BUFFERED READS: 171.84 MB/sec
- CPU BOGOMIPS: 55679.76
- DNS EXT: 42 ms
- FSYNCS/SECOND: 223.64
- HD SIZE: 93.93 GB
- REGEXSECOND: 1592970
- Version: pve-manager/8.0.3/bbb...
5. Each variable shows a timestamp of "just now ago" for the last change.
6. There is an option to download the data in CSV format.
Proxmox VM List
This script will provide a list of the virtual machines currently configured in your Proxmox host, along with their status and properties. When applied, it creates a table with the following columns:
- VMID
- Name
- Status
- Memory
- Boot Disk Size (Boot disk usage in Gb)
- Processors (Number of Cpus)
- PID (Process ID)
- Net0 MAC (MAC address of the network interface)
- Net0 bridge (Network bridge configuration)
- OS type
- Error(s) (Errors during data retrieval on that specific VM)
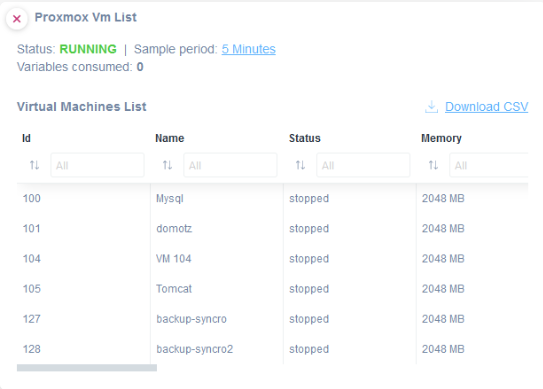
Proxmox Virtual Machines List Overview
1. The page displays a list of virtual machines (VMs) within Proxmox, with detailed information for each.
2. The status at the top indicates "RUNNING" with a sample period of five minutes and shows that zero variables have been consumed.
3. The table includes columns for VM ID, Name, Status, and Memory.
4. Each VM has a unique ID and a corresponding name.
5. The Status column shows that all VMs listed are "stopped."
6. The Memory column indicates each VM uses 2048 MB.
7. There is an option to download the list as a CSV file.
Improvements
Domotz Metrics Replace Sensors
We are excited to introduce this significant change, the renaming from “Domotz Sensors” to “Domotz Metrics.” This update represents more than just a name change. It is part of a broader effort to provide a more comprehensive and streamlined approach to measuring and monitoring your digital assets.
What’s New with Domotz Metrics
- Information-Based Metrics: The shift from “Sensors” to “Metrics” is part of a new approach that focuses on the type of information or data vectors you monitor from your devices. This update allows you to significantly reduce the number of metrics needed to monitor your assets efficiently.
- Consolidated Monitoring: We’ve brought all the properties of a digital asset into one, so you can monitor through Domotz. This includes monitoring via SNMP templates, checking TCP ports, applying one of the publicly available Custom Scripts, or writing your own Custom Scripts and integrations.
- No Frequency Limitations: We’ve removed any restrictions on how frequently you can poll for information. This means you can access real-time data whenever needed, ensuring you’re always in the know.
This transition to “Metrics” is designed to give you more flexibility and precision in your monitoring activities. It significantly enhances your user experience by improving the usability of pre-configured SNMP templates for the most commonly monitored devices.
Why Was This Change Necessary?
The previous model had usability limitations, as “sensors” were associated with each data point collected and depended on the frequency of data collected. This led to increased costs and limited adoption.
Benefits of the New Model
- Pre-configured SNMP Metrics are associated with the type of information you collect, not the number of data points.
- Metrics are independent of the polling frequency, allowing you to increase frequency without increasing costs.
- Our web app provides greater clarity and detail, offering better control over the number of metrics you use.
- More flexibility and control over the data you need from your network-based devices.
The following table contains some examples to give you a better idea of the benefits introduced:
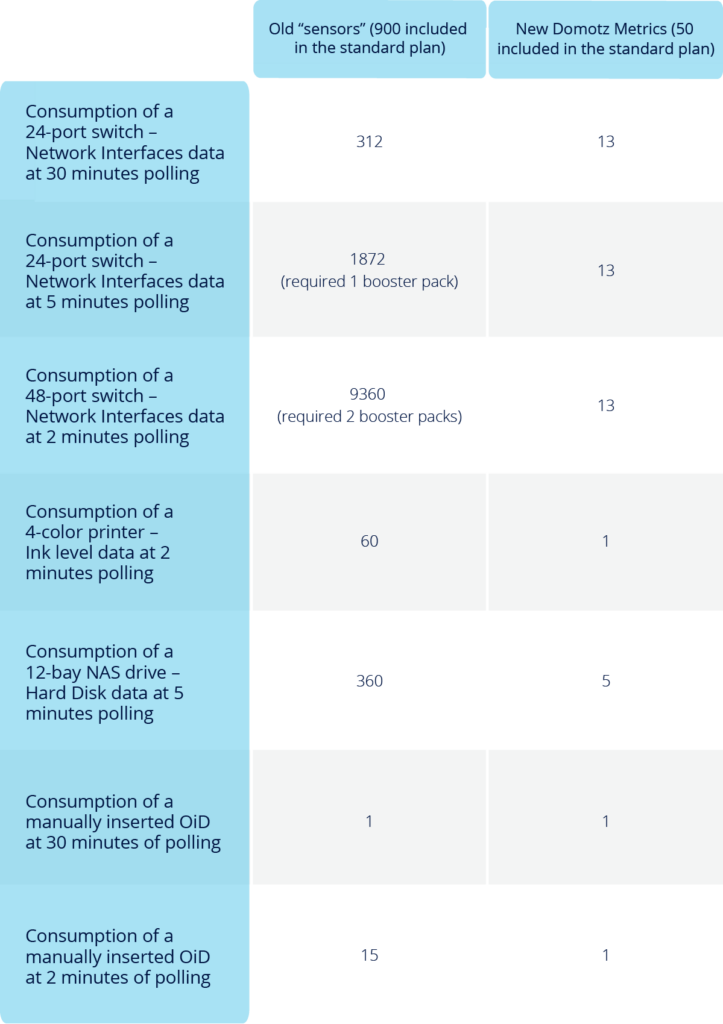
Comparison of Old Sensors and New Domotz Metrics Consumption
1. For a 24-port switch with network interfaces data at 30-minute polling, the old sensors consume 312, while the new Domotz metrics consume 13.
2. A 24-port switch with network interfaces data at 5-minute polling consumes 1872 in old sensors, requiring 1 booster pack, compared to 13 in new Domotz metrics.
3. A 48-port switch with network interfaces data at 2-minute polling consumes 9360 in old sensors, requiring 2 booster packs, while consuming 13 in new Domotz metrics.
4. A 4-color printer with ink level data at 2-minute polling consumes 60 in old sensors and 1 in new Domotz metrics.
5. A 12-bay NAS drive with hard disk data at 5-minute polling consumes 360 in old sensors and 5 in new Domotz metrics.
6. A manually inserted OiD at 30 minutes of polling consumes 1 in both old sensors and new Domotz metrics.
7. A manually inserted OiD at 2 minutes of polling consumes 15 in old sensors and 1 in new Domotz metrics.
This update empowers you to make the most of your monitoring activities, reducing costs and providing more clarity and flexibility in your operations. If you have questions or concerns about this change, please get in touch with us at support@domotz.com. For more details, you can read our guide “Explaining Domotz Metrics“.
Serial Number Advanced Management
Going on, we’ve significantly improved how serial numbers are managed within Domotz.
- Integration with IT Glue and Syncro: Building upon last month’s release, we’ve expanded the support for serial number synchronization to include IT Glue and Syncro. This ensures that your asset records are consistent across Domotz, IT Glue, and Syncro, streamlining your documentation processes.
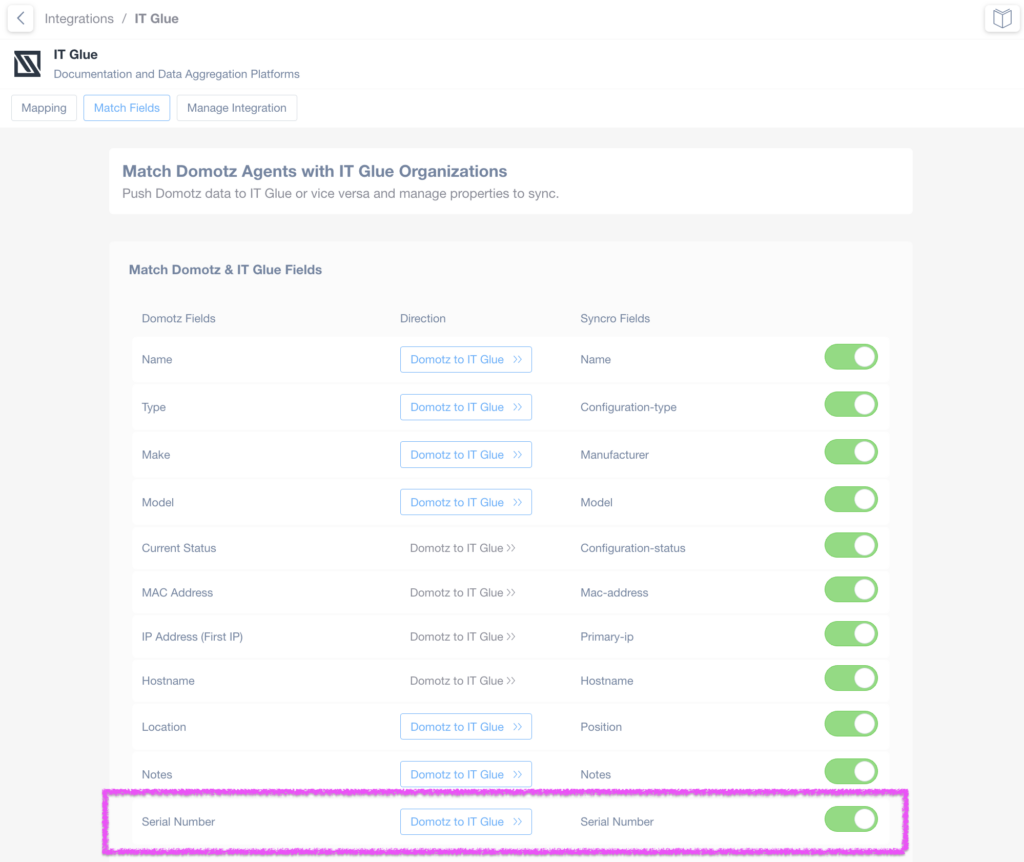
Mapping Domotz to IT Glue Fields.
1. In the central table, Domotz fields are listed on the left. Corresponding Syncro fields are on the right.
2. The "Direction" column indicates "Domotz to IT Glue" for syncing data.
3. Each row shows a specific field mapping, such as "Name" to "Name," "Type" to "Configuration-type," and so on.
4. Toggle switches on the right are activated, confirming these fields are set to sync.
5. The "Serial Number" row at the bottom is highlighted, indicating it is important or requires attention.
- Manual Serial Number Override: We’ve introduced the ability for users to manually override and customize the serial number field directly within the Domotz App/WebApp. This gives you greater flexibility and control over your asset records, allowing you to match them precisely to your needs.
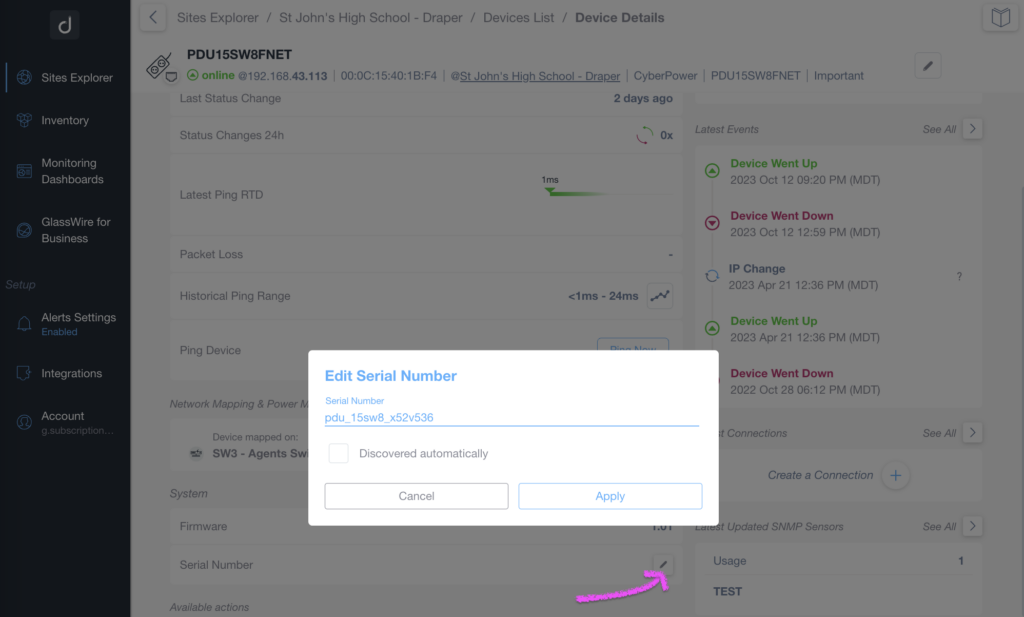
Editing a Serial Number in Device Details
1. Open the "Device Details" page for the specific device named "PDU15SW8FNET."
2. Locate the "Edit Serial Number" dialog box that appears.
3. In the "Serial Number" field, you can view or modify the current serial number, which is "pdu_15sw8_x52v536."
4. To automatically discover a serial number, check the "Discovered automatically" option.
5. To save any changes made to the serial number, click "Apply."
6. If you do not wish to save changes, click "Cancel."
- Public API Access: The serial number field is now accessible and editable through the Public API. This means you can automate and integrate serial number management tasks, making maintaining accurate asset records at scale easier. Detailed information can be found in our API documentation.
- Enhanced Integration Suggestions: Serial numbers are now utilized in our integrations with systems like ConnectWise Manage, Syncro, and IT Glue to suggest mappings between Domotz Devices and assets in external platforms. This ensures a seamless and efficient integration experience.
With these improvements, we aim to provide you with robust tools for efficient asset management, documentation, and integration.
Routed Network information available in the Inventory Dashboard
This enhancement will simplify the management of Routed Layer-3 Networks, also known as private subnets. With this improvement, you can now conveniently review and manage the configuration of your private subnets directly from the Inventory dashboard.
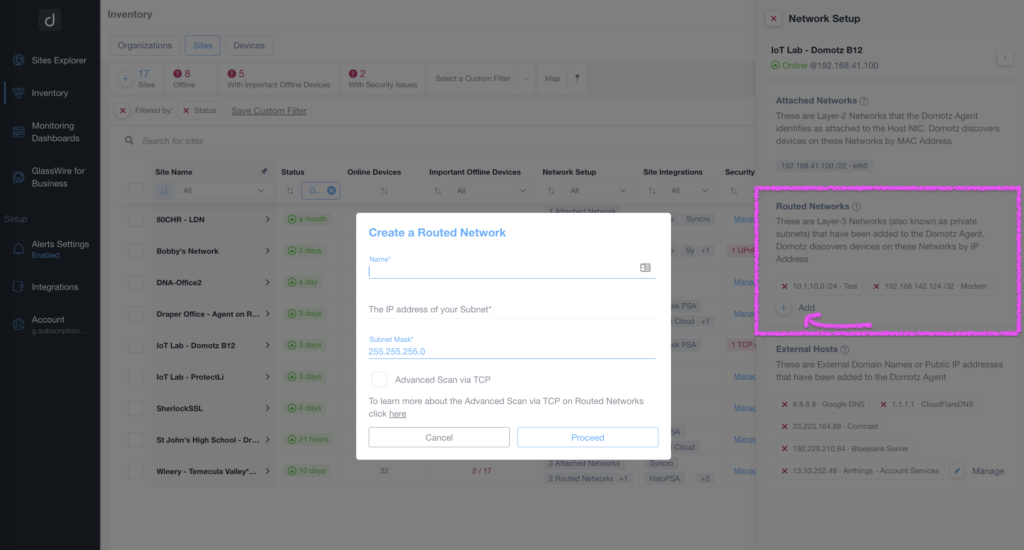
Creating a Routed Network in Domotz.
1. In the Network Setup section, locate the "Routed Networks" panel on the right.
2. Click "Add" under the Routed Networks section to begin creating a routed network.
3. In the "Create a Routed Network" dialog, enter a name for the network in the "Name" field.
4. Enter the IP address of your subnet in the designated field.
5. Specify the subnet mask, such as "255.255.255.0", in the "Subnet Mask" field.
6. Optionally, check "Advanced Scan via TCP" if needed.
7. Click "Proceed" to finalize the creation of the routed network.
This new functionality allows for seamless access to critical information about your private subnets, simplifying network management tasks. Whether you need to add a new configuration, monitor, or troubleshoot Routed Layer-3 Networks, you can now easily access and manage them, all within the Inventory dashboard.
This enhancement reflects our ongoing commitment to provide you with comprehensive tools and features for effective network management.
Action Labels in the Custom Scripts Editor
Custom Scripts will now be on more easier to create within Domotz. When working in the Custom Scripts editor, you can use the “Label” feature to quickly jump to a specific function.
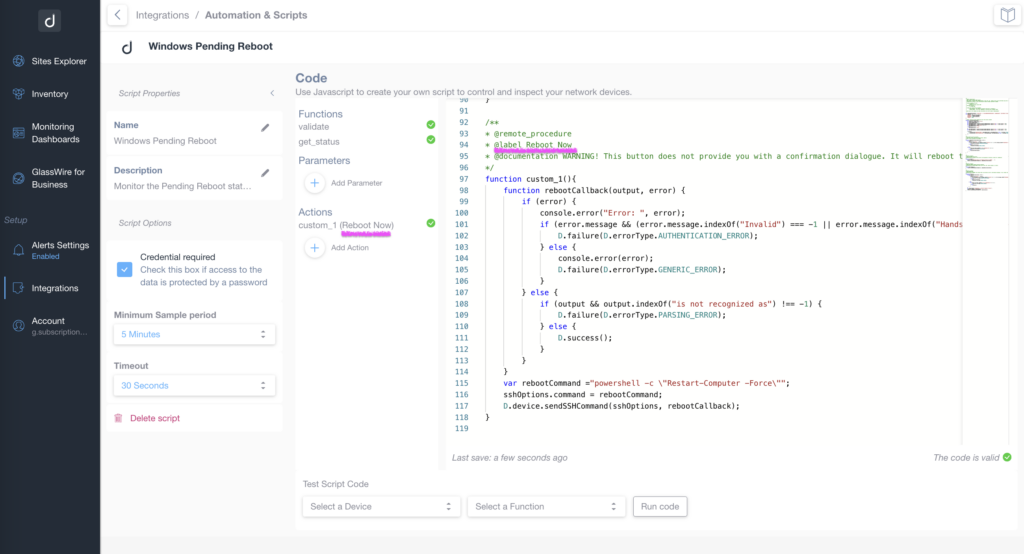
Script Configuration for Windows Pending Reboot
1. In the "Script Properties" section on the left, the script is named "Windows Pending Reboot," with a description stating it monitors the pending reboot status.
2. Under "Script Options," check the "Credential required" box if data access needs password protection. Set the "Minimum Sample period" to 5 minutes and "Timeout" to 30 seconds. Optionally, delete the script using the "Delete script" option.
3. In the "Code" section, add or modify functions and parameters. The script includes functions like "validate" and "get_status" with spaces to add more.
4. In "Actions," "Reboot Now" is highlighted, indicating it triggers an immediate system reboot without a confirmation prompt.
5. Test the script by selecting a device and ensuring the code is valid before running it.
This enhancement streamlines your workflow when editing Custom Scripts, making locating and navigating to specific actions easier. Adding labels offers improved organization and clarity, helping you create and maintain Custom Scripts more efficiently.
New Privacy Policy and Terms and Conditions
Our updated Privacy Policy and Terms and Conditions, version 3.0.0-20230920, are out. These updates align with our commitment to safeguarding your privacy and ensuring that your experience with Domotz is secure and transparent.
These revised documents reflect our continuous efforts to protect your data, provide clear terms of service, and address how your information is used in compliance with current legal standards.
As a valued member of our community, it is important for you to review and understand these updated documents. Your privacy and trust are paramount to us, and we encourage you to read our revised Privacy Policy and Terms and Conditions in their entirety to stay informed about how we manage your data.
Your feedback and trust are essential as we continue to improve our services, and we appreciate your ongoing support. If you have any questions or concerns regarding these updated documents, please do not hesitate to contact us for further clarification.
Alerts for IP Conflict Detected
For new users who registered after the beginning of October 2023, Domotz has introduced a new Alert Profile that triggers when an IP Conflict is detected on one of the networks monitored through the Domotz Collector.
This valuable feature enhances network troubleshooting by alerting users to potential IP conflicts, which can lead to network disruptions and security vulnerabilities. With this alert, users can proactively address IP conflicts, ensuring network stability and data integrity.
This capability will be extended to all our users in the coming updates, providing comprehensive coverage for monitoring and managing IP conflicts. Please note that, at this time, the default custom filters for All Sites (available under the Inventory Dashboard) must be removed to eliminate this alert profile.
Fix
We’ve fixed the following issues:
- The OS Monitoring feature for Windows PC/Server disc scans was causing an uncaught exception.
- There were Inventory Queries performed twice when applying custom filters.
- When an Agent that was part of a Custom Filter was removed, it caused the Inventory Dashboard for sites to return an error.
- Meraki Integration: there was an issue while parsing the data retrieved from the Meraki cloud.
- Juniper integration: The JunOS driver did not allow generic port mapping to work as expected.
- There was an issue preventing the configuration of the Cisco CBS-350 for the Configuration Management functionality.
- Surgex SQUID Support fix for an issue in the firmware reference.
- ZIP Code was wrongly reported (with a hash code) in the monthly PDF reports.
- M-LAB-based Speed Test failed on the Domotz Collectors configured on the Domotz Box.
- Monitoring Dashboards and Tables were not sorting devices correctly via IP addresses.
Known limitations
- Alerts for IP Conflict cannot be removed without removing the default custom filter for all the Agents.
- There is no central repository for all the alerts configured on SNMP PreConfigured, OS Monitoring, and Custom Integration script sensors.
- Monitoring Dashboards are currently limited to Monitoring Tables as Widgets.
- Luxul Router-based Agents do not support VPN on demand. To elaborate, we’ll add this capability as soon as Luxul’s team provides us with the required API.
- You can’t configure the static IP address on the Domotz Box before configuring the Agent.
- Lastly, you can’t leverage DHCP on additional VLANs on the Domotz Box.
These release notes cover the changes, including Domotz Pro Cloud, Domotz Agent, and Domotz Pro App. Learn more about our software on our website or read our blog to stay updated with modern network and IT Infrastructure monitoring and management.