We have exciting new features, SNMP templates, custom scripts, and improvements available on Domotz. This month’s exciting new updates include editing and deleting the Custom Filters directly on the Monitoring Dashboard and Inventory Dashboards, search metrics in the Monitoring Dashboards, synchronization of Serial Numbers with Syncro, new Fortinet Switches and Firewall support, and more.
In summary, here’s what’s new and improved on Domotz this month.
- Edit and delete Custom Filters
- Synchronize Serial Number Information with Syncro
- Enhanced Metric Search for Monitoring Tables
- Configure Custom Script Parameters via Public API
- Email in case of Configuration Management failure
- Additional MIBs available in the Domotz Database
- New SNMP Templates (Supermicro, Watchguard)
We are always improving Domotz and welcome your feedback. Please contact our support team at support@domotz.com for help or suggestions.
New features
Network Configuration Management added for FortiGate Firewalls
Our network configuration management features are now available on FortiGate Firewalls to help you stay on top of crucial changes happening in your network infrastructure.
As you can see in the following image, you can now automatically backup the running configuration files of your FortiGate Firewalls.
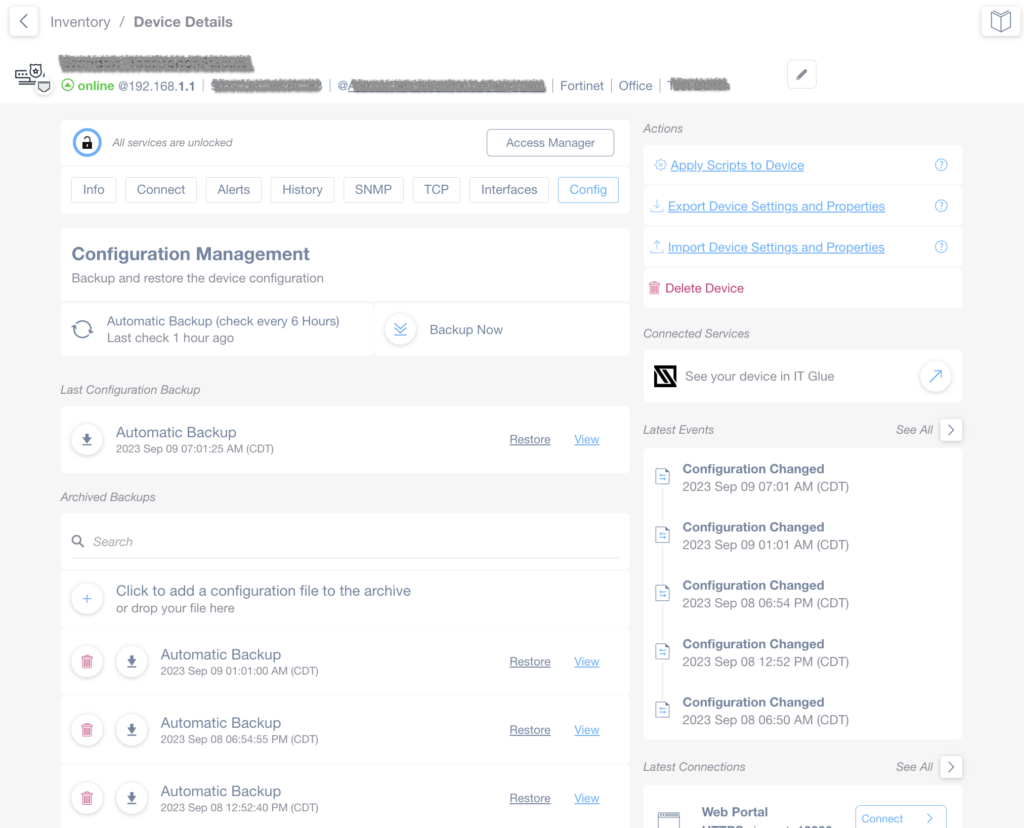
Additionally, Domotz will keep track of the configuration changes over time and notify you if there are any changes to help you easily identify network configuration issues. We’ll also alert you about any configuration misalignment.
For detailed guidance on configuring this functionality, please refer to our documentation.
FortiSwitch PoE control and Port Mapping
We are thrilled to announce that we have added FortiSwitch PoE Control and Port Mapping to our network management capabilities suite. Domotz now supports Fortinet FortiSwitch models, enhancing the ability to manage your network infrastructure efficiently.
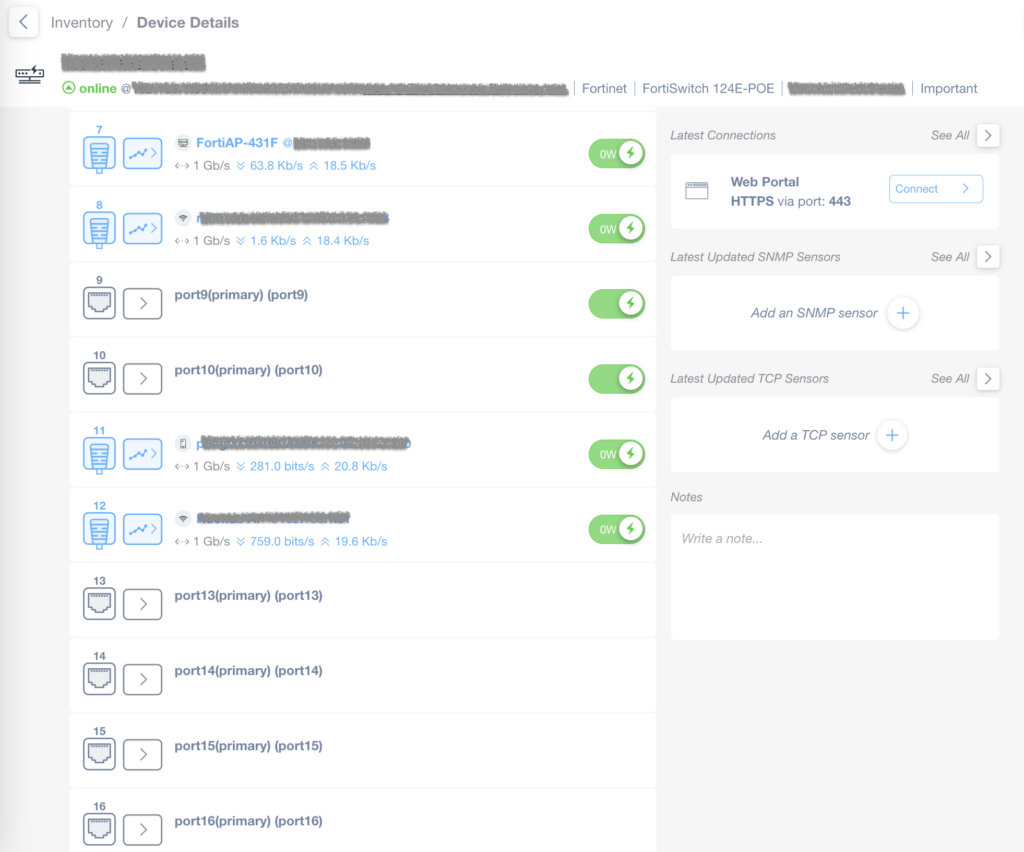
With this feature, you can automatically extract the list of devices connected to each port of FortiSwitches. This invaluable Port Mapping functionality provides a clear and detailed overview of which device is connected to which port, simplifying network troubleshooting and device identification. As a matter of fact, this information is also used in the Automatic Network Topology Map.
Moreover, for switches equipped with Power over Ethernet (PoE) capabilities, Domotz enables you to exercise precise control over the PoE status of each port. Whether you need to power cycle a device or manage power allocation efficiently remotely, this feature helps you to take immediate action.
The PoE control functionality is accessible both within the list of interfaces for the specific switch and in the device view for the device connected to that port. This seamless integration ensures that you can easily make informed decisions and manage your PoE devices.
We are committed to enhancing your network management experience and providing you with the tools you need to maintain a resilient and efficient network. Your feedback is essential in shaping these improvements.
Please consult our comprehensive instructions on leveraging FortiSwitch PoE Control and Port Mapping.
New Custom Scripts
You can use the custom scripts to monitor and manage network-connected devices, cloud services, and web applications. By using standard network protocols, these scripts will allow you to retrieve valuable data and execute actions on the monitored devices and services.
This month, we released the following:
- APC – UPS
- iDRAC
- IBM iSeries – AS400
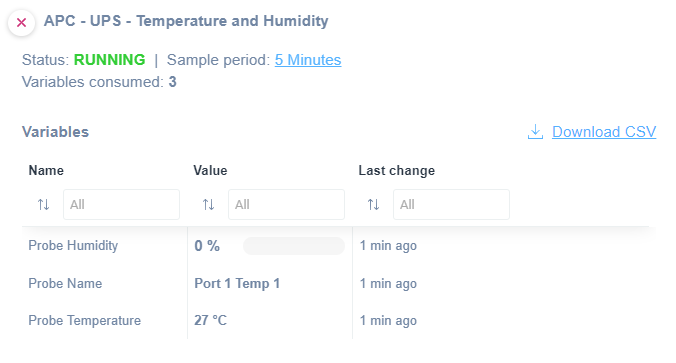
APC – UPS
You can apply our custom script to monitor an APC UPS Room Temperature and Humidity. That script uses SNMP to retrieve detailed information about room temperature and humidity where an APC UPS resides. The script has been validated and tested on APC Smart-UPS X 3000 version 6.8.2. You can find this script in our Library or on github. Just customize the drivers to fit your needs.
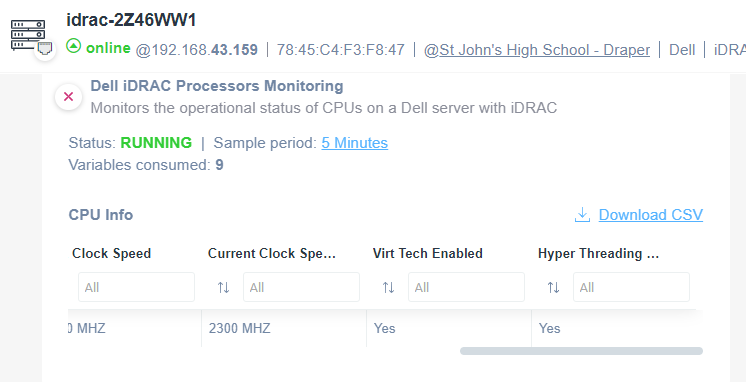
iDRAC
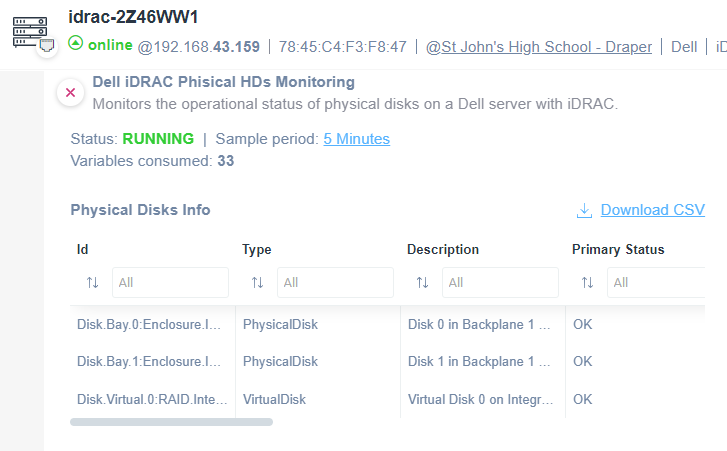
You can apply our new scripts to monitor Physical HDs, RAID, Memory, Fans, and Processors on a Dell Server equipped with an iDRAC controller. They use SSH as a communication protocol.
You will be able to monitor the following:
- Physical Hard Drives status and information
- Raid status and configuration
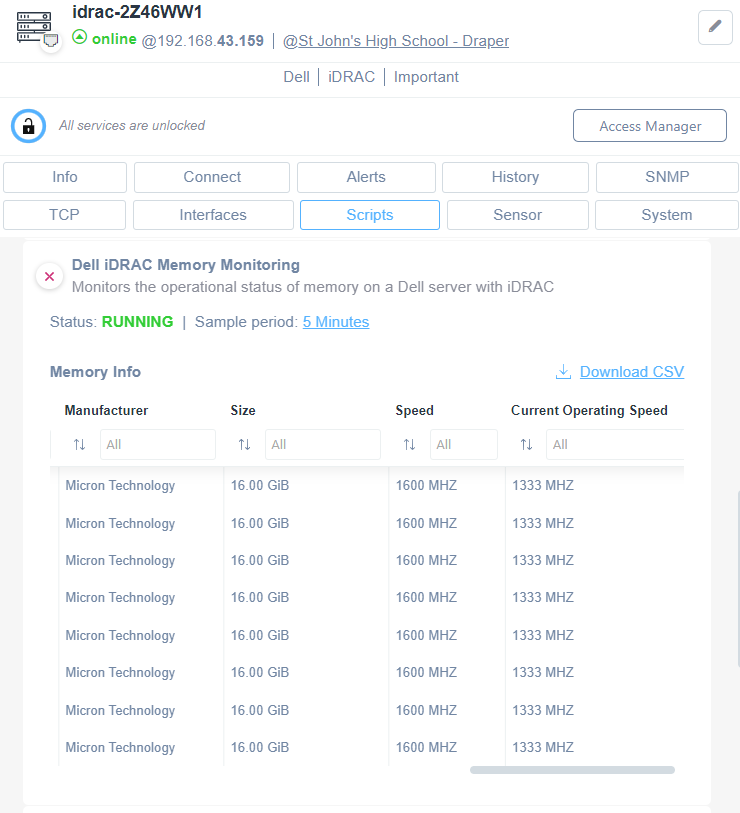
- Memory status and information
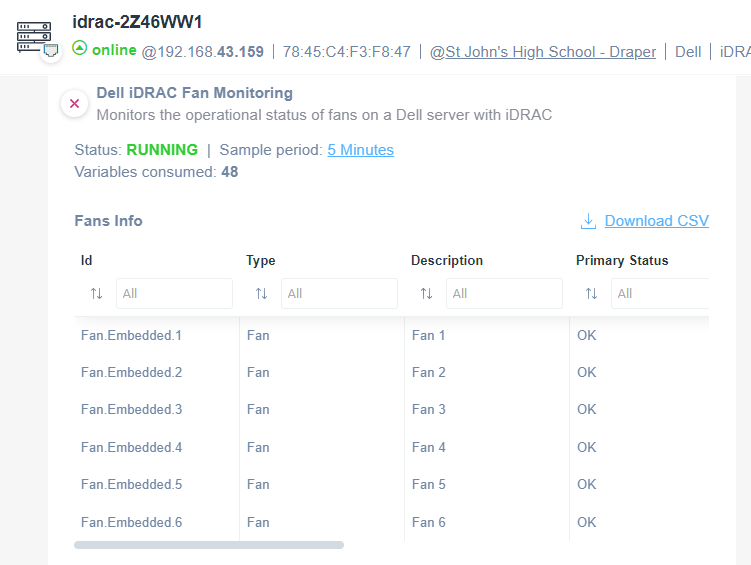
- Fans status and information
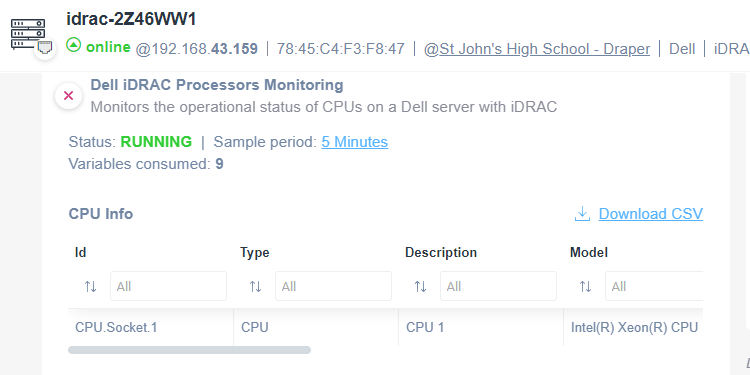
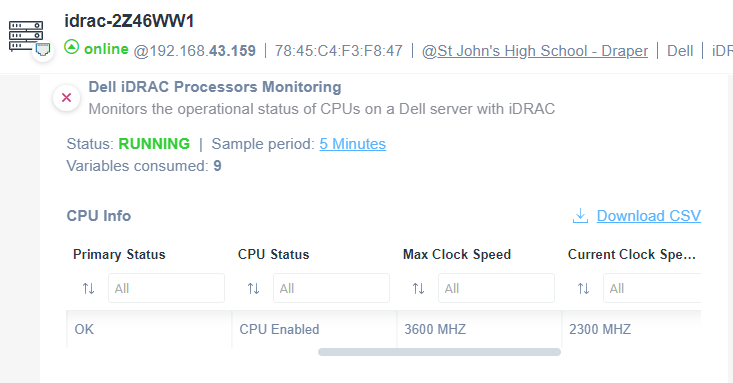
- Processors status and information
The scripts have been validated and tested on iDRAC 7, firmware 2.6.5.
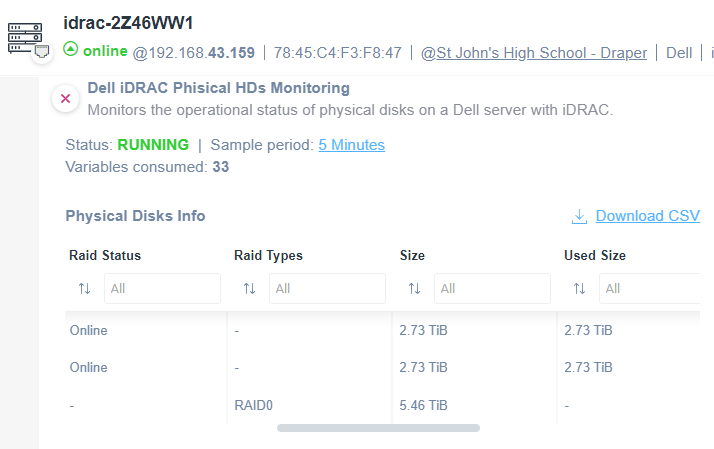
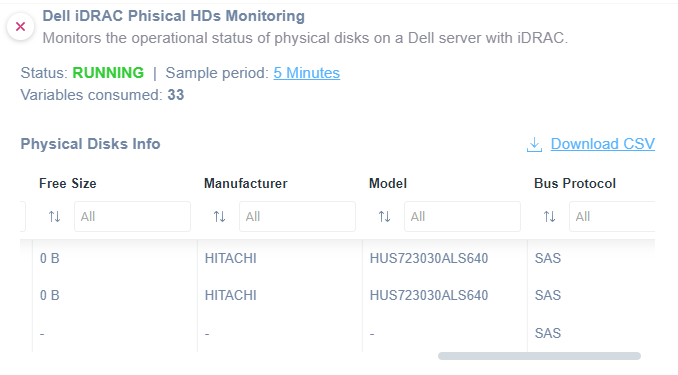
Physical Hard Drivers status and information
- Type
- Description
- Primary Status
- Raid Status
- Raid Types
- Size
- Used Size
- Free Size
- Manufacturer
- Model
- Bus Protocol
You can find this script in our Library or on github. Just customize the drivers to fit your needs.
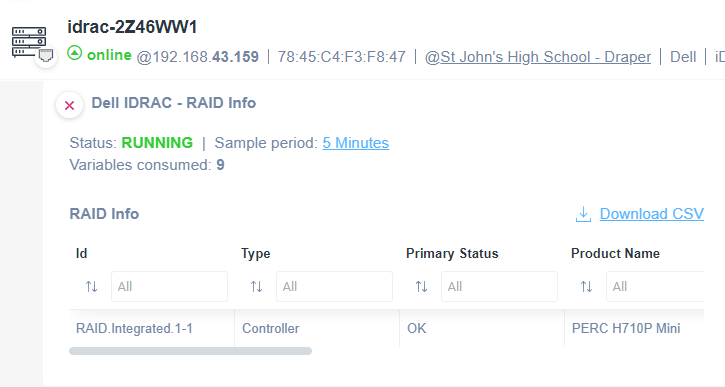
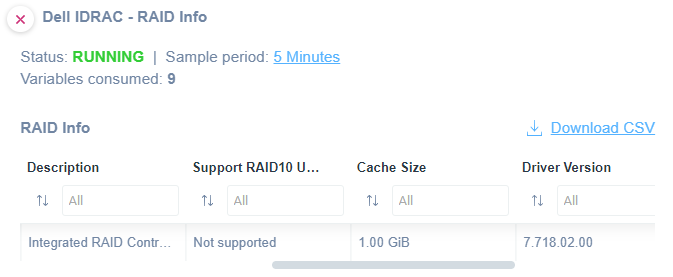
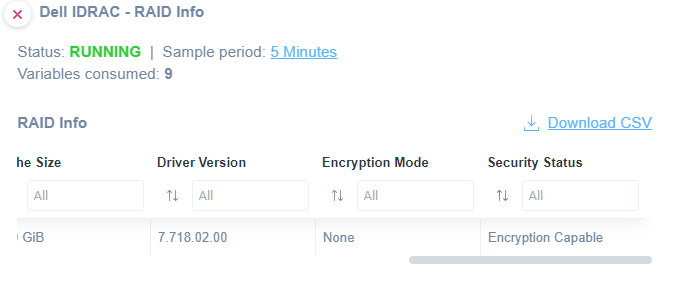
Raid status and configuration
- Type
- Primary Status
- Product Name
- Description
- Support RAID 10 Uneven Spans
- Cache Size
- Driver Version
- Encryption Mode
- Security Status
You can find this script in our Library or on github. Just customize the drivers to fit your needs.
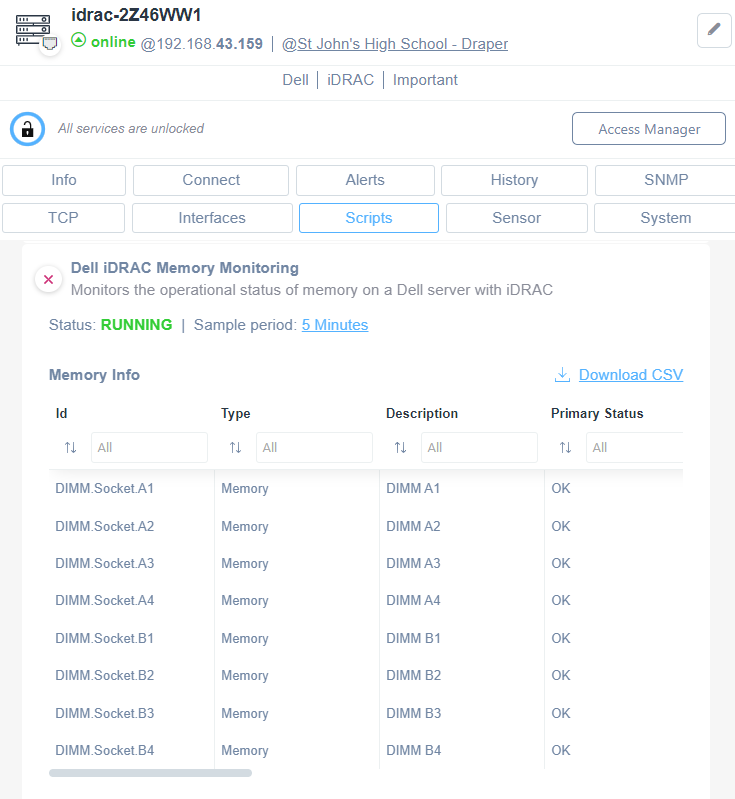
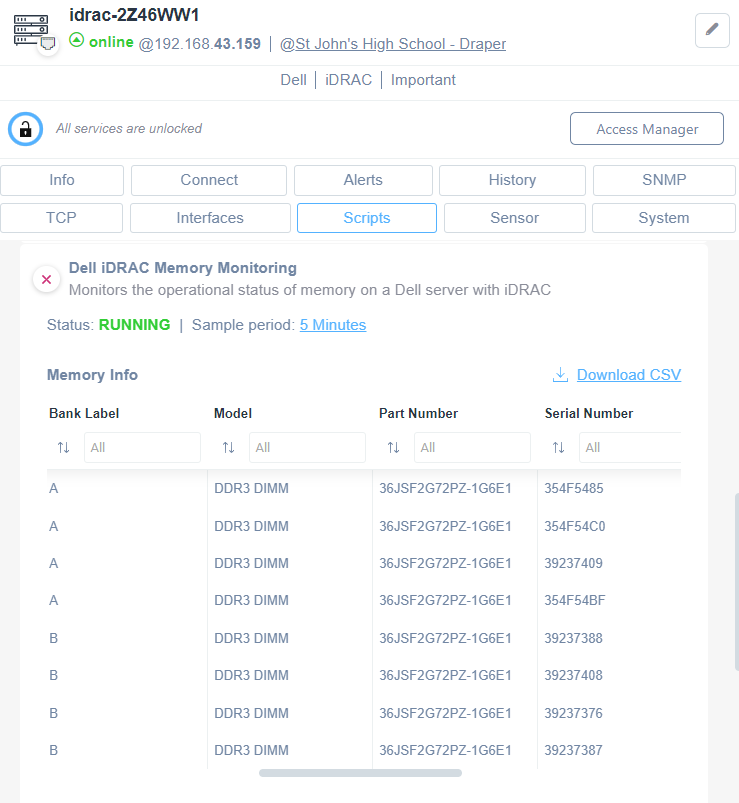
Memory status and information
- Type
- Description
- Primary Status
- Bank Label
- Model
- Part Number
- Serial Number
- Manufacturer
- Size
- Speed
- Current Operating Speed
You can find this script in our Library or on github. Just customize the drivers to fit your needs.
Fans status and information
- Type
- Description
- Primary Status
- Redundancy Status
- Active Cooling
- Variable Speed
- PWM (Pulse Width Modulation percentage)
- Current Reading
You can find this script in our Library or on github. Just customize the drivers to fit your needs.
Processors status and information
- Type
- Description
- Model
- Primary Status
- Max Clock Speed
- Virt Tech Enabled
- Hyper-Threading Enabled
You can find this script in our Library or on github. Just customize the drivers to fit your needs.
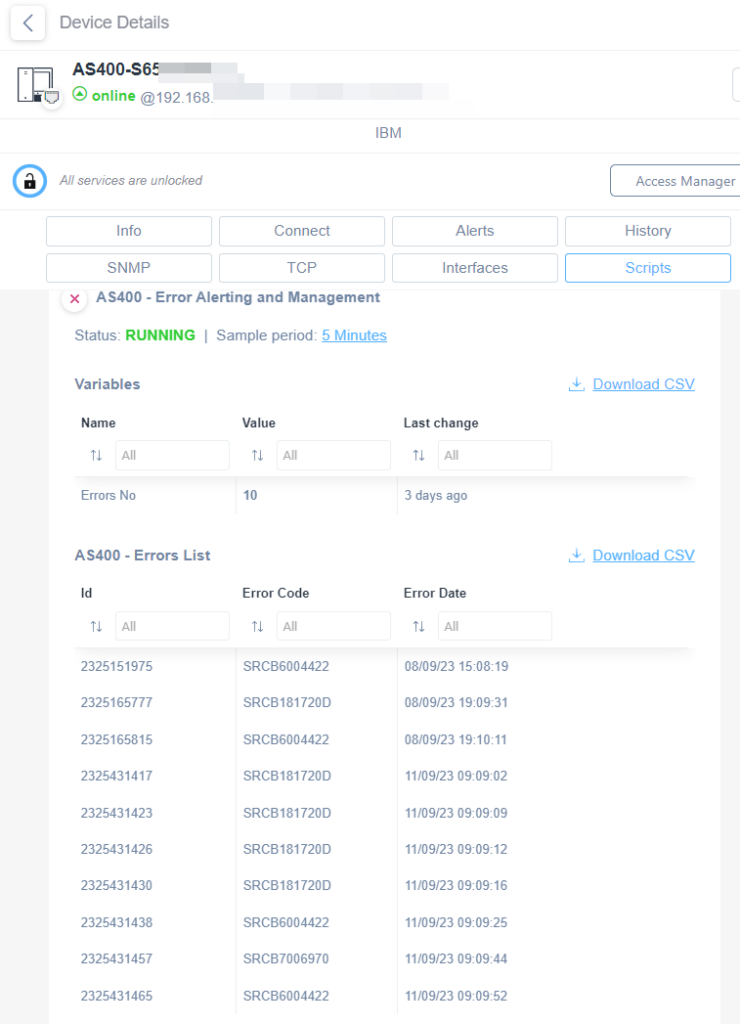
IBM iSeries – AS400
To monitor an IBM iSeries AS400, you can apply this script which uses Telnet as communication protocol.
You will be able to monitor the following:
- The total of errors/issues/problems present in the system
- A complete list of the errors/issues/problems present in the system
Please note that this script has been tested and works only on the Italian version of OS400. If you are using OS400 in another language, please send an email to support@domotz.com requesting a script for your language.
Improvements
Edit and delete Custom Filters
Going on, we released another important enhancement that simplifies the process of managing Custom Filters in both the Inventory Dashboards and Monitoring Dashboards. You can now edit and delete existing Custom Filter rules directly from these sections.
To adjust your Custom Filters, simply access the selection for Custom Filters, and you’ll notice a new “Edit” button.
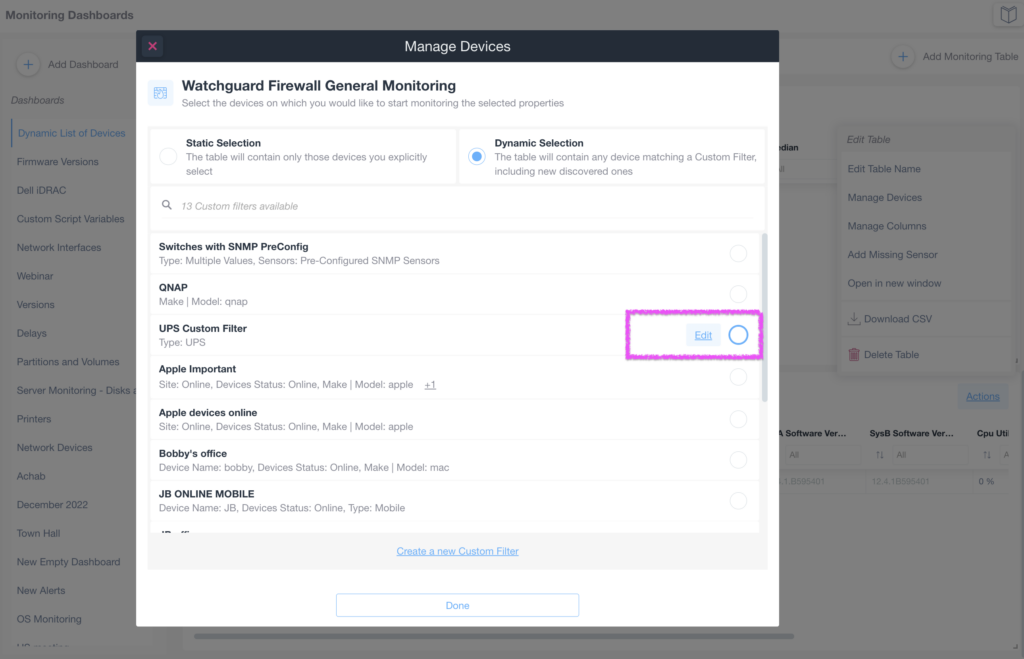
Clicking this button will open a new configuration tab, allowing you to define new rules and conditions for your filtering criteria.
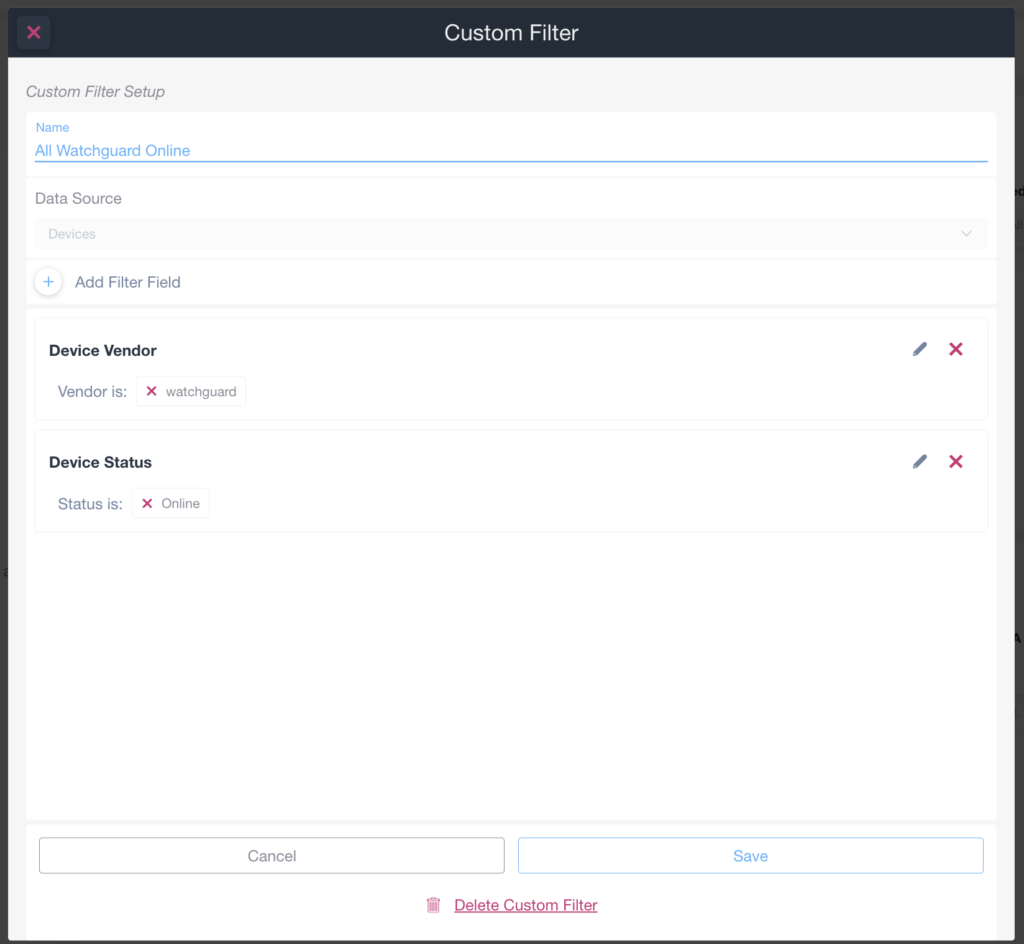
This improvement offers greater flexibility and control over your Custom Filters, eliminating the need to navigate to a separate editing interface. Whether you are working within the Inventory Dashboards or the Monitoring Dashboards, the ability to edit Custom Filter rules seamlessly streamlines your network monitoring and management tasks.
Synchronize Serial Number Information with Syncro
Our recent enhancement lets you easily synchronize Serial Number information between Domotz and Syncro. This news offers more comprehensive data synchronization capabilities when integrating Domotz with the Syncro platform.
When configuring Documentation and Data synchronization between Domotz and Syncro, you can now select the synchronization of Serial Number information in addition to the existing data fields (such as Device name, type, model, location, etc.).
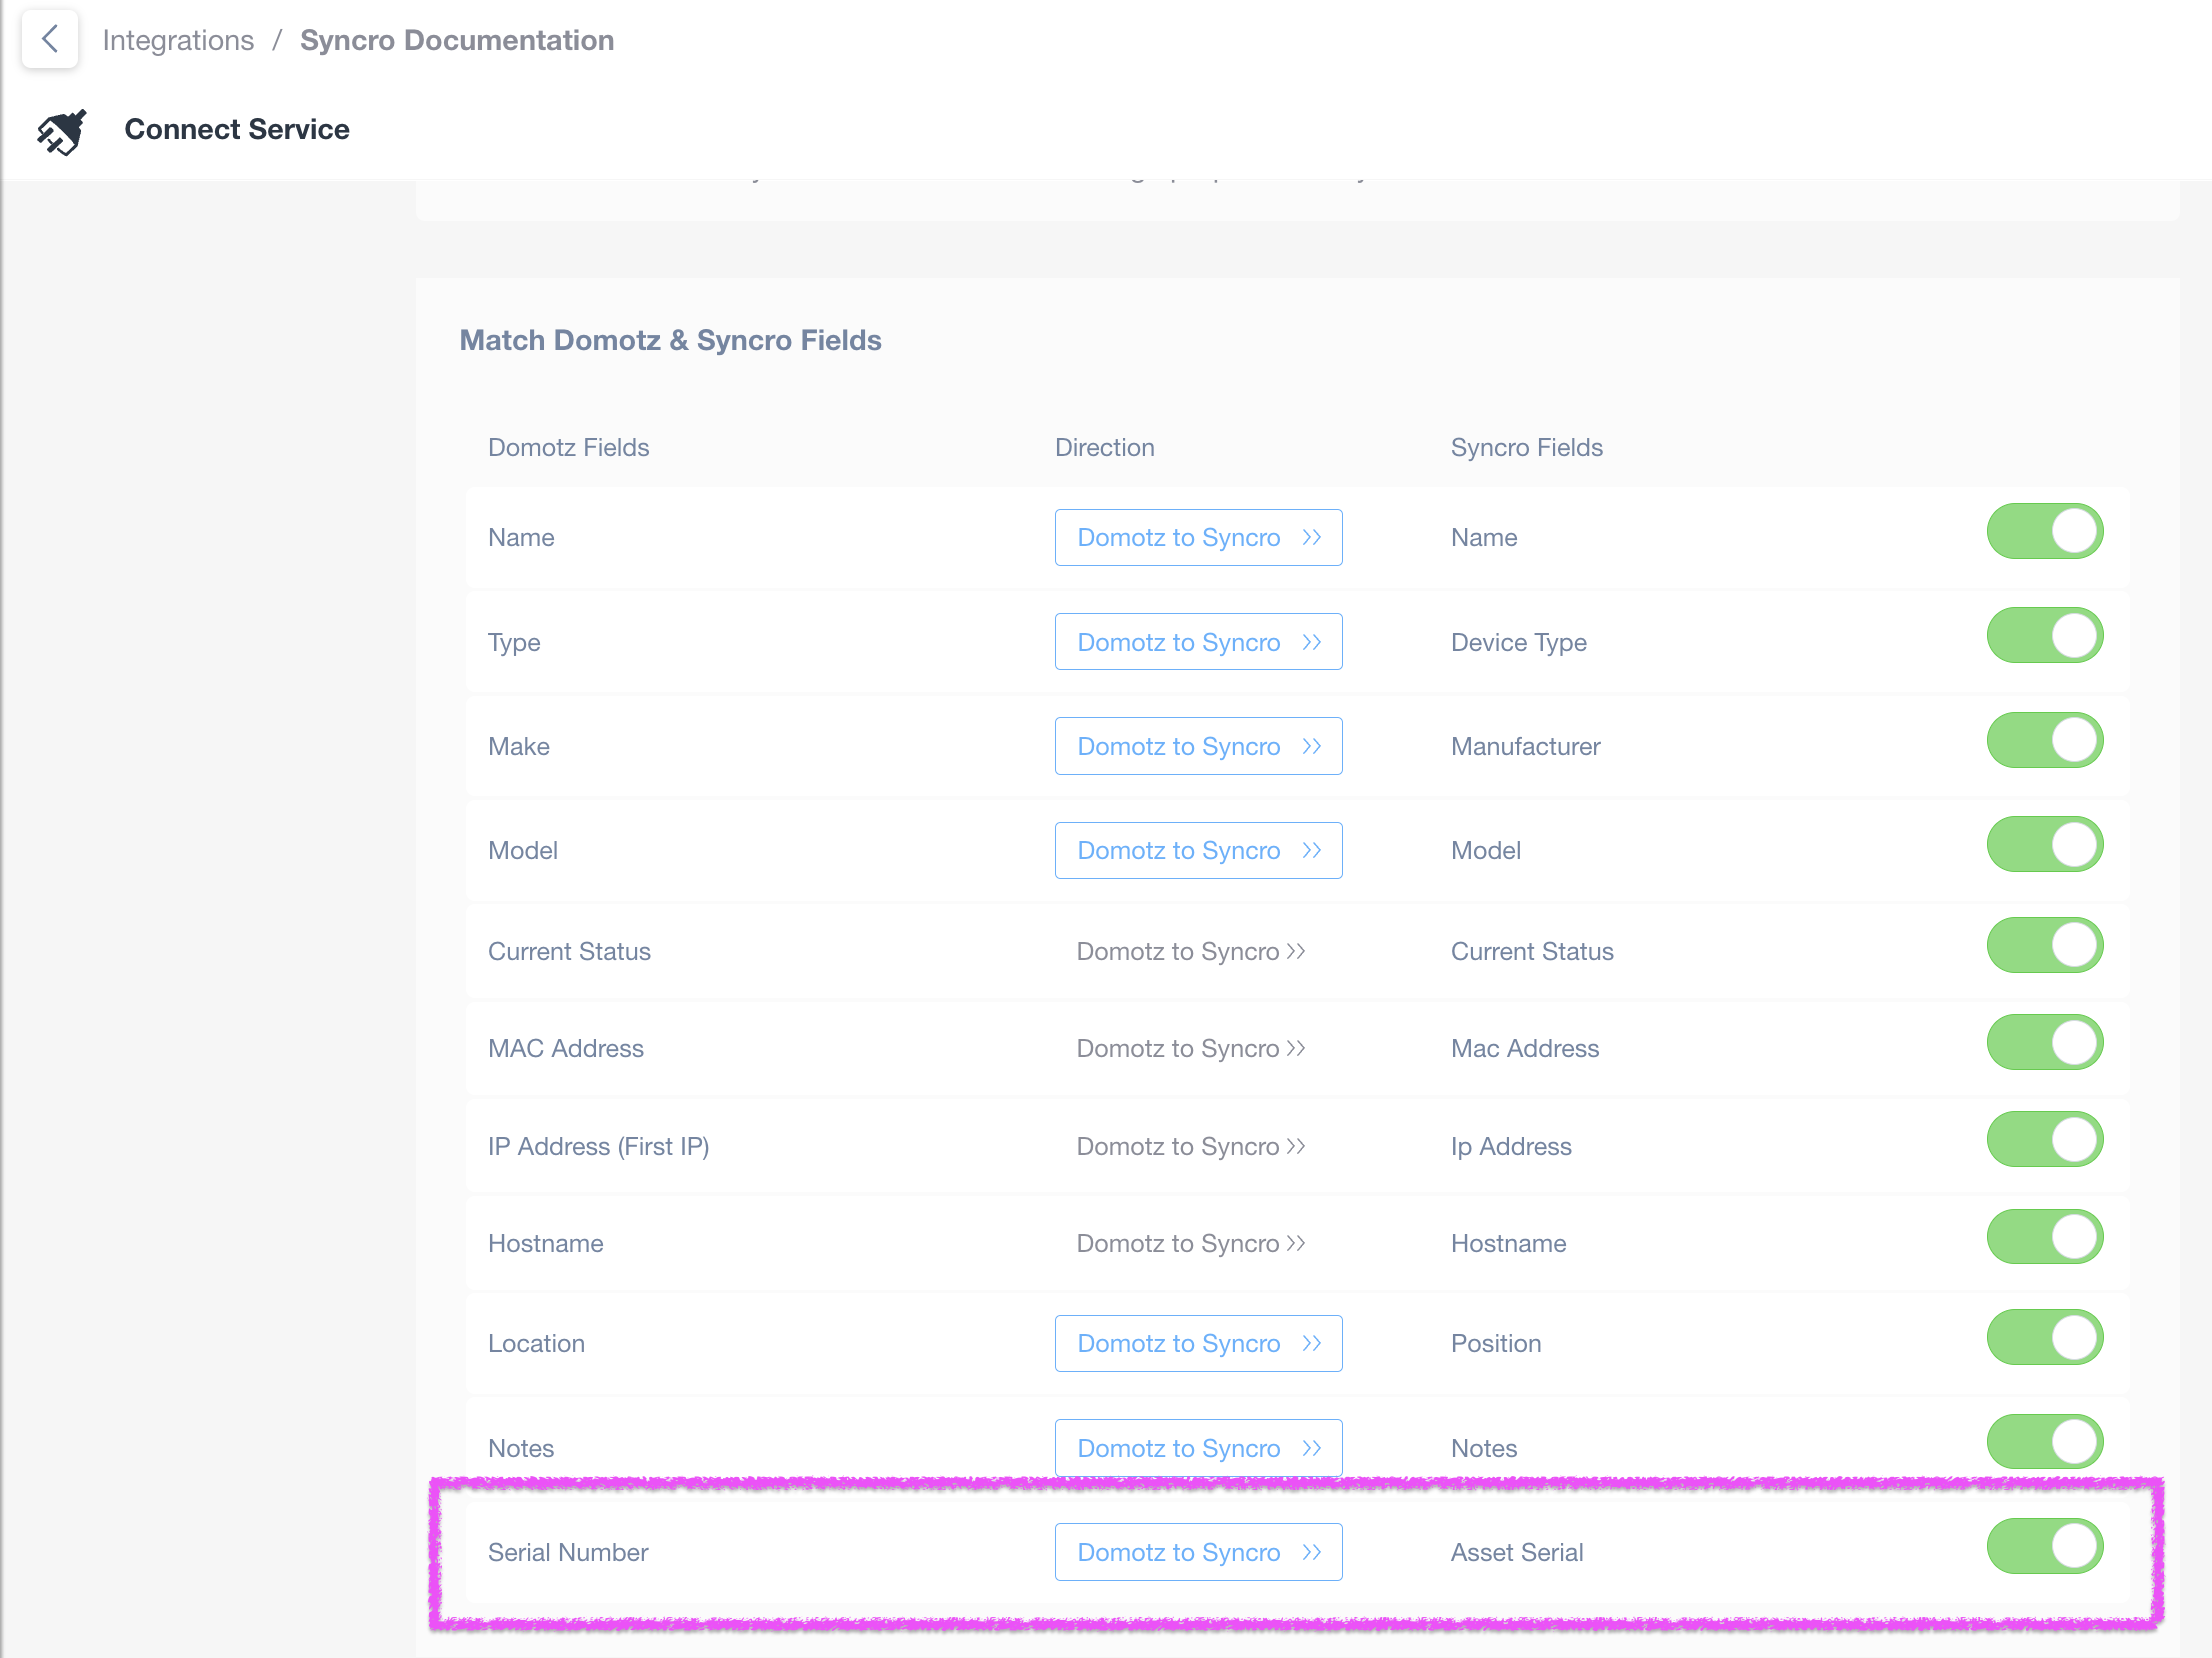
This synchronization allows you to maintain accurate Serial Number records across both platforms effortlessly. Whether you need to track assets, facilitate support, or streamline your asset management processes, this improvement ensures that your Serial Number data remains consistent and current in Domotz and Syncro.
For detailed guidance on configuring this Serial Number synchronization and maximizing the benefits of this integration, please refer to our documentation.
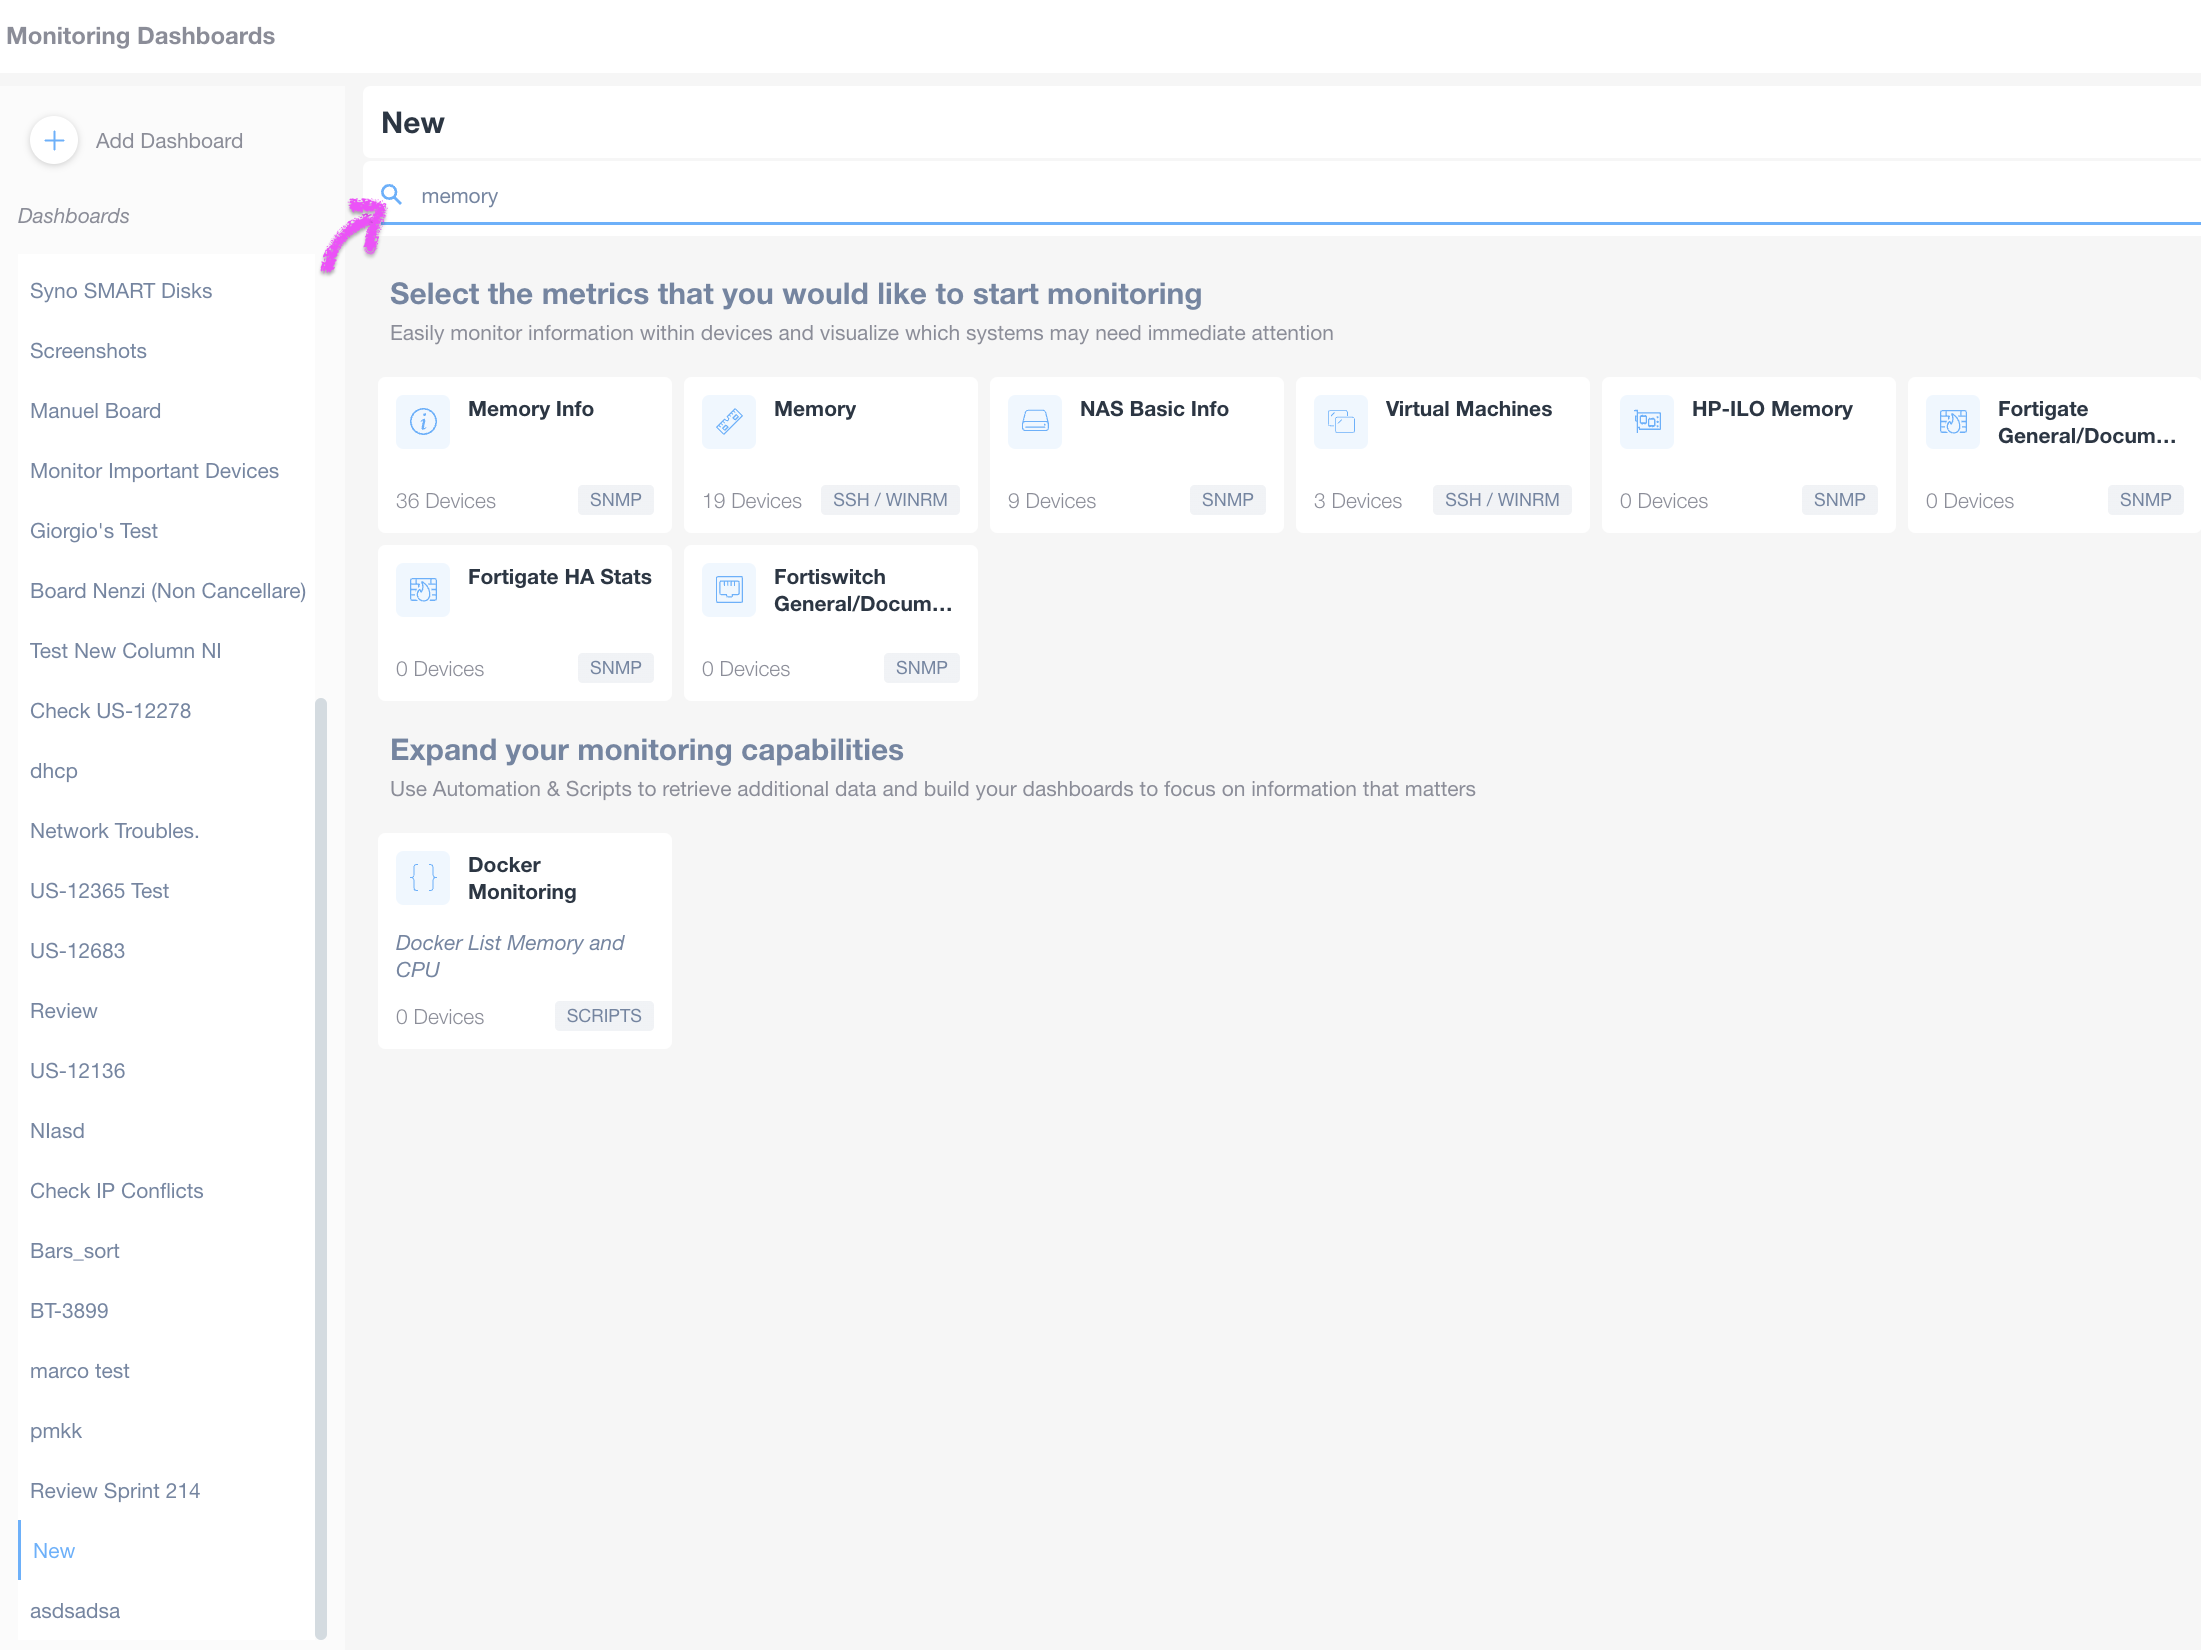
Enhanced Metric Search for Monitoring Tables
We have introduced an intuitive and user-friendly metric search feature that effortlessly enables you to find and add metrics to your Monitoring Tables.
With this improvement, when adding a new Monitoring Table, you now have the ability to search among all available metrics, including both built-in and custom metrics generated by Automation and Scripts.
This powerful search capability simplifies the selection of metrics, ensuring that you can quickly and accurately define the metrics you want to monitor.
Whether you track network performance, device health, or specific custom metrics (e.g. CPU or Memory), this enhancement significantly reduces the time and effort required to configure your Monitoring Tables. It offers a seamless and efficient experience when customizing your network monitoring dashboards.
For detailed information on how to use Monitoring Dashboards, please visit our documentation.
Configure Custom Script Parameters via Public API
We are delighted to introduce the possibility of defining parameters for Custom Scripts during the association of scripts to devices via the Public API.
This enhancement simplifies and expedites the configuration of Custom Scripts, enabling you to perform mass associations of scripts to multiple devices with ease and efficiency. By leveraging the Public API, you can now automate the process of custom script configuration, enhancing your network monitoring and management capabilities.
For detailed information on defining parameters for Custom Scripts via the Public API and performing script associations, we invite you to consult our comprehensive documentation available at: Create Custom Driver Association.
Email Notification for Configuration Management Failure
Improve the reliability and oversight of your network configuration management. Domotz now incorporates a proactive mechanism to alert the Team Leader account (admin account) via email if there are any failures when attempting to read configuration files from supported network devices.
This release ensures that the primary account holder of a Domotz Account is promptly notified if the automatic backup of configuration files (every 6 hours) encounters any issues or fails for any reason.
By receiving timely email notifications of configuration management failures, you can take immediate action to address and resolve any potential issues, safeguarding the integrity and security of your network configurations.
We remain dedicated to enhancing your network management experience and providing robust tools for comprehensive network oversight. If you have any questions or require assistance with this new email notification feature, please don’t hesitate to contact our support team.
Additional MIBs available in the Domotz Database
Additional MIB files are available for the following devices.
- Wyse
- TPDIN-Monitor-Web3
- Thecus
Additionally, you can search for their OIDs from Domotz.
New SNMP Templates
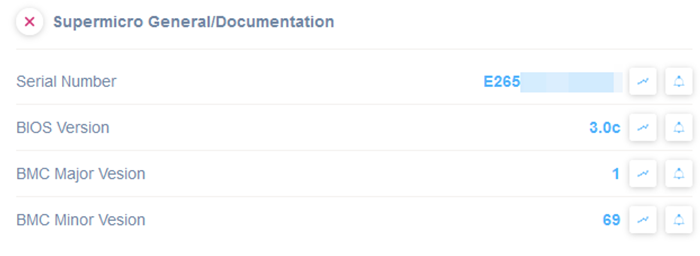
Supermicro
Use Domotz to monitor Supermicro server performance and system performance proactively. Get quick access to crucial information and simplify your Supermicro remote monitoring using our pre-configured SNMP templates.
The available pre-configured SNMP templates are the following:
- General Monitoring
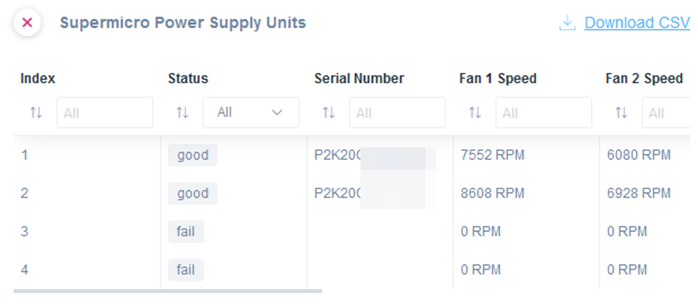
- Power Supply Units Monitoring
Receive notifications about system issues to resolve remote system management issues in advance. Get a better insight into the performance of the servers you manage to improve your overall server management.
WatchGuard VPN tunnels and VPN general documentation
Use our new pre-configured SNMP templates to simplify your WatchGuard remote monitoring.
Apply the “VPN Tunnels Monitoring” to monitor the current active VPN Tunnels:
- local IP address
- remote IP address
- inbound/outbound traffic rate
Use the General VPN Information Monitoring to monitor General VPN information such as total VPN entries and total Inbound/outbound IPsec packet rate.
Fix
We’ve fixed the following issues:
- The RTD monitoring failed on huge networks due to too many samples to be managed.
- A rare condition caused the failure in unlocking Dell iDRAC devices.
- Special UTF-8 characters were not correctly displayed on Monitoring Dashboards (when the view was open in compact mode).
- There was an issue preventing a Team Member, elevated to impersonate the admin account, to activate new Agents.
- Panamax PDU Outlet (and other minor brands) consistency was not working under specific circumstances. This issue caused the list of associated devices to the PDU outlets to be removed.
- SNMP Template was failing in extracting the negotiated bandwidth on interfaces with a speed higher than 2.5Gbps
- Under specific circumstances, unlocking the Windows server was impossible due to failed serial number retrieval.
Known limitations
- There is no central repository for all the alerts configured on SNMP PreConfigured, OS Monitoring, and Custom Integration script sensors.
- Monitoring Dashboards are currently limited to Monitoring Tables as Widgets.
- Luxul Router-based Agents do not support VPN on demand. To elaborate, we’ll add this capability as soon as Luxul’s team provides us with the required API.
- You can’t configure the static IP address on the Domotz Box before configuring the Agent.
- Lastly, you can’t leverage DHCP on additional VLANs on the Domotz Box.
These release notes cover the changes, including Domotz Pro Cloud, Domotz Agent, and Domotz Pro App. Learn more about our software on our website or read our blog to stay updated with modern network and IT Infrastructure monitoring and management.