We’ve just released exciting features on Domotz, including powerful integration scripts and support for new hardware integrations.
Read on to learn about all the new functionalities we’ve released in the last few weeks. In summary, here’s what’s new on Domotz this month.
- Microsoft Windows Update Agent (WUA) Script
- Crestron Touch Screen Monitoring and Management Script
- RabbitMQ Monitoring
- Configuration Management for Cisco CBS Series
- Improved support for Alerting on various Sensors
- Support for Multiple Networks under Cisco Meraki Cloud connection
- Self-service moving of Agents to new Hardware
- Manage Custom Integrations through Public API
- Quick connection to Netgear Insights portal
- Slimmer Template for Monitoring Network Switch Interfaces
- Several fixes
What’s new
Monitor and control the Microsoft Windows Update Agent (WUA)
We’ve got a new integration for Microsoft Windows Systems. Monitor the status of the Windows Update Agent (WUA) to get notifications if there are critical or security-related updates you need to install on your Windows Systems.
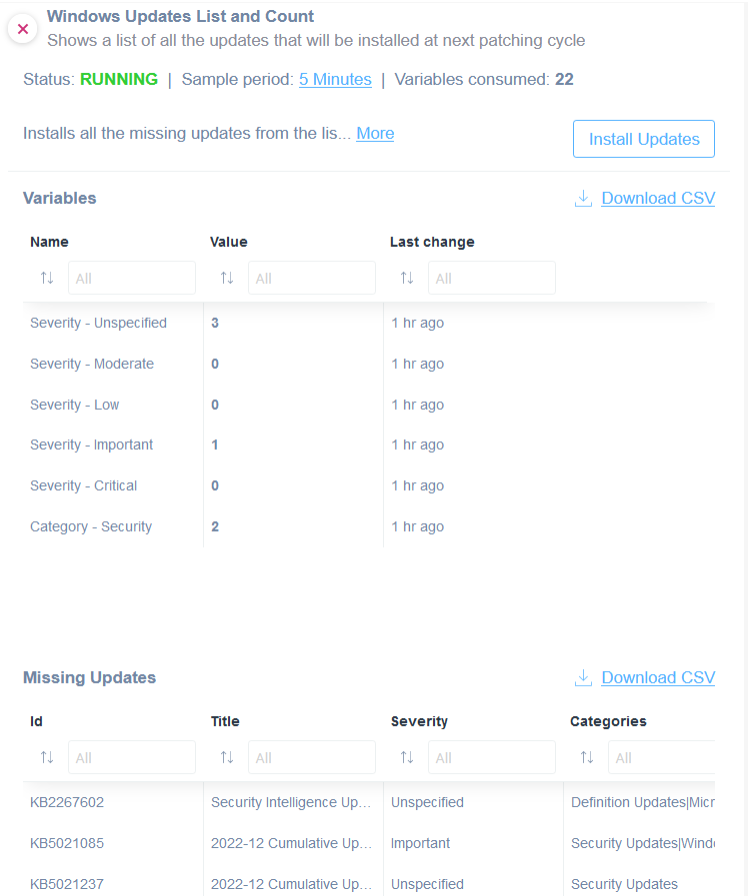
The new monitoring and control integration allows you to check the amount and type of updates ready to be applied on your Windows Systems. Moreover, you apply the updates directly from Domotz.
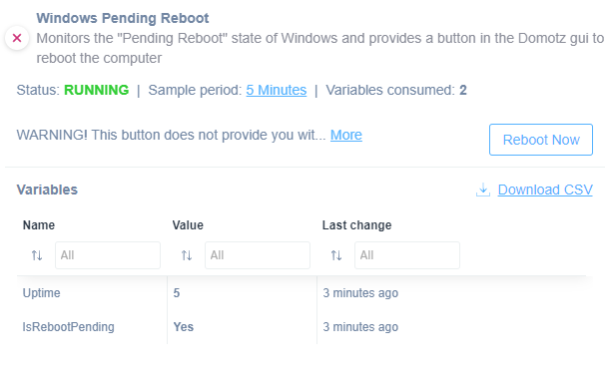
Additionally, with this new integration, you can check if pending updates are waiting for a system reboot before they can be applied. Then, issue a reboot command directly from Domotz too.
Learn how to start using Microsoft Windows Update Agent Monitoring and Management.
Crestron Touch Screens Monitoring and Management Script
We’ve got a new integration that allows you to monitor the status of Crestron Touch Screens from Domotz.
With this new integration for Crestron Touch Screens, you can easily review the vital parameters of devices installed at your customers’ sites:
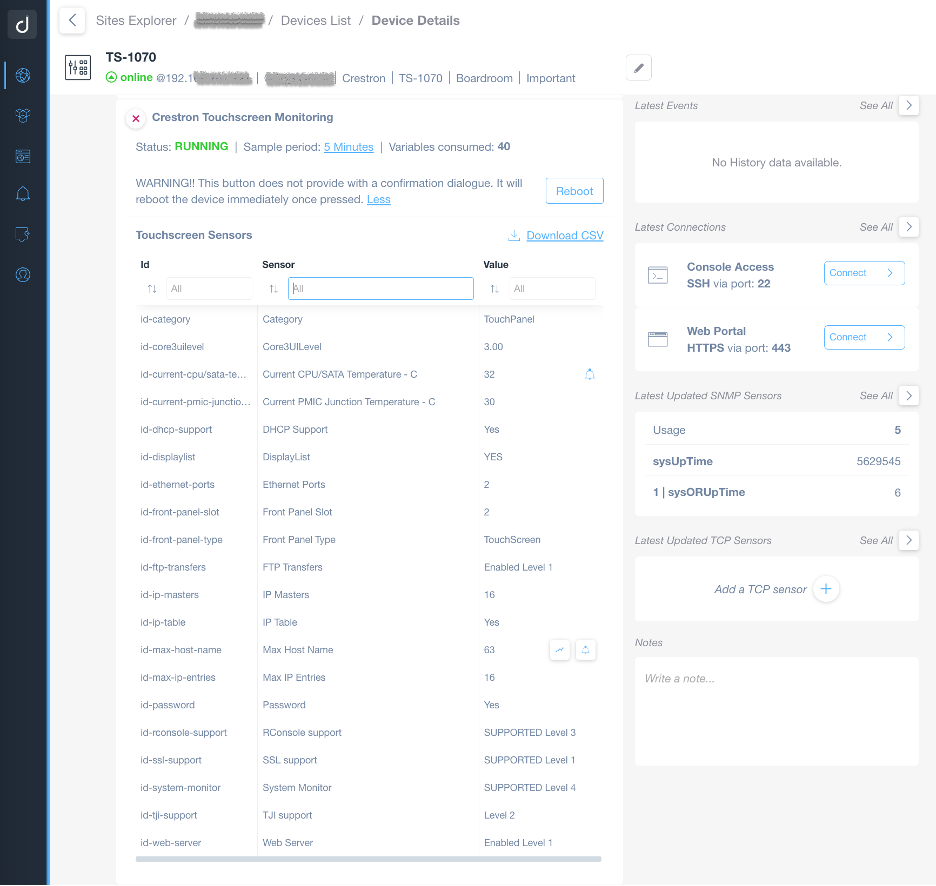
You can configure the monitoring on all the Crestron Touch Screens to ensure that configurations and vital parameters are within the normal range. For instance, you can now monitor the temperature of the CPU or the Power Management Integrated Circuit (PMIC) and configure an alert on those parameters to get a notification if there is a malfunction in the system.
Additionally, the new integration allows you to issue a reboot command for a Crestron Touch Screen. Always maintain control of the Crestron Touch Screen systems you are remotely monitoring and managing.
Learn how to start using Crestron Touch Screen Monitoring and Management.
RabbitMQ Monitoring
We’ve also got a new monitoring integration for RabbitMQ systems. You can now perform RabbitMQ system monitoring directly from Domotz. Leveraging our Custom Integration Drivers framework, you can proactively monitor the configuration and performance of your RabbitMQ server.
Review the vital parameters of a RabbitMQ system installed on your data center:
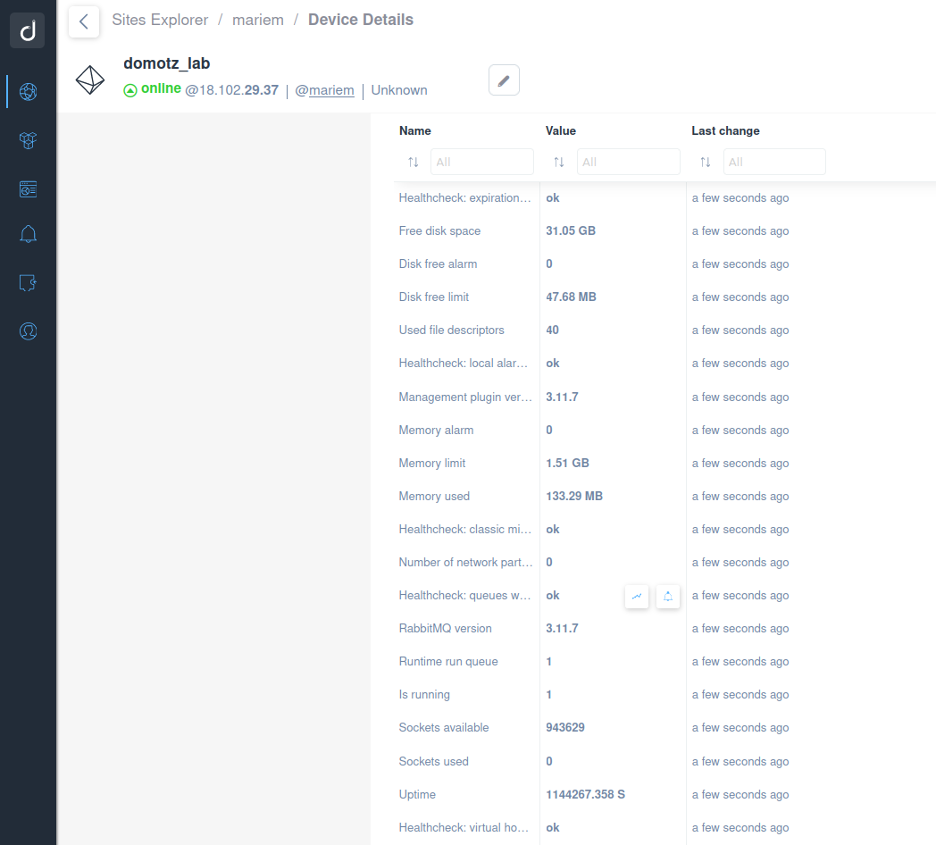
You can also see if there are unacknowledged messages or if the Queues or Exchanges configured for your RabbitMQ instance are consuming too many resources.
You can easily understand which of the Queue or Exchange has the majority of messages to be handled and troubleshoot any issue on your message broker system.
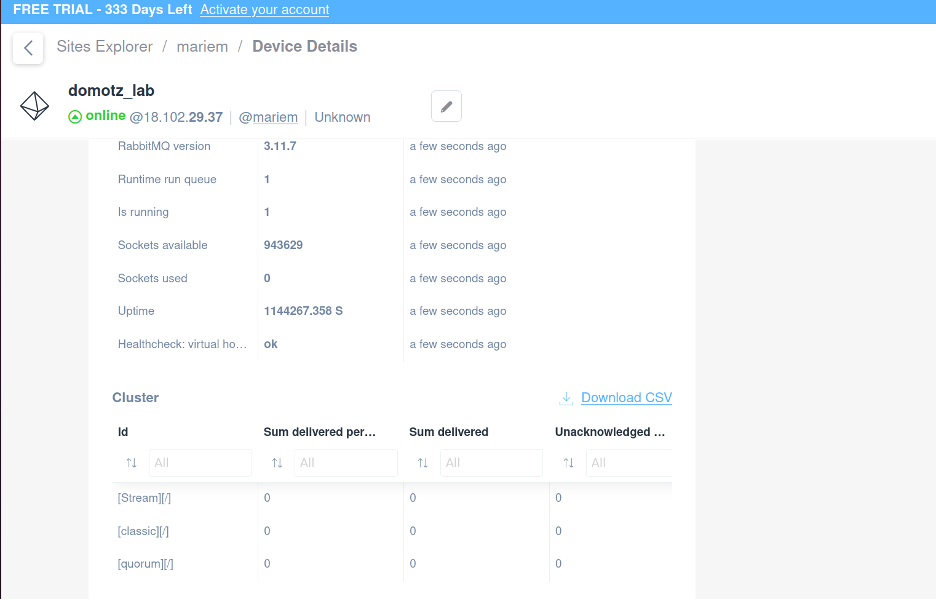
Configure an alert if the number of unacknowledged messages breaches a certain threshold which might not be healthy for your message broker system and, therefore, for your business.
Learn more about how to monitor RabbitMQ nodes and clusters.
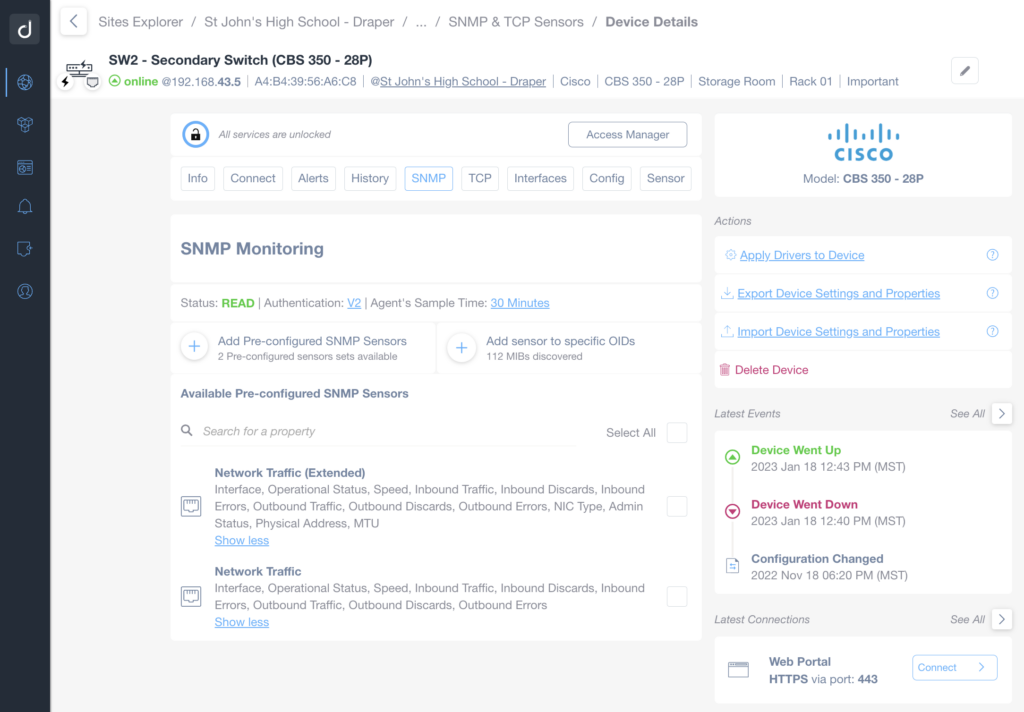
Configuration Management for Cisco CBS Series
Our network configuration management features are now available on the Cisco CBS Series switches to help you stay on top of crucial changes to your critical network infrastructure.
You can now automatically back up the running configuration files of your Cisco CBS devices.
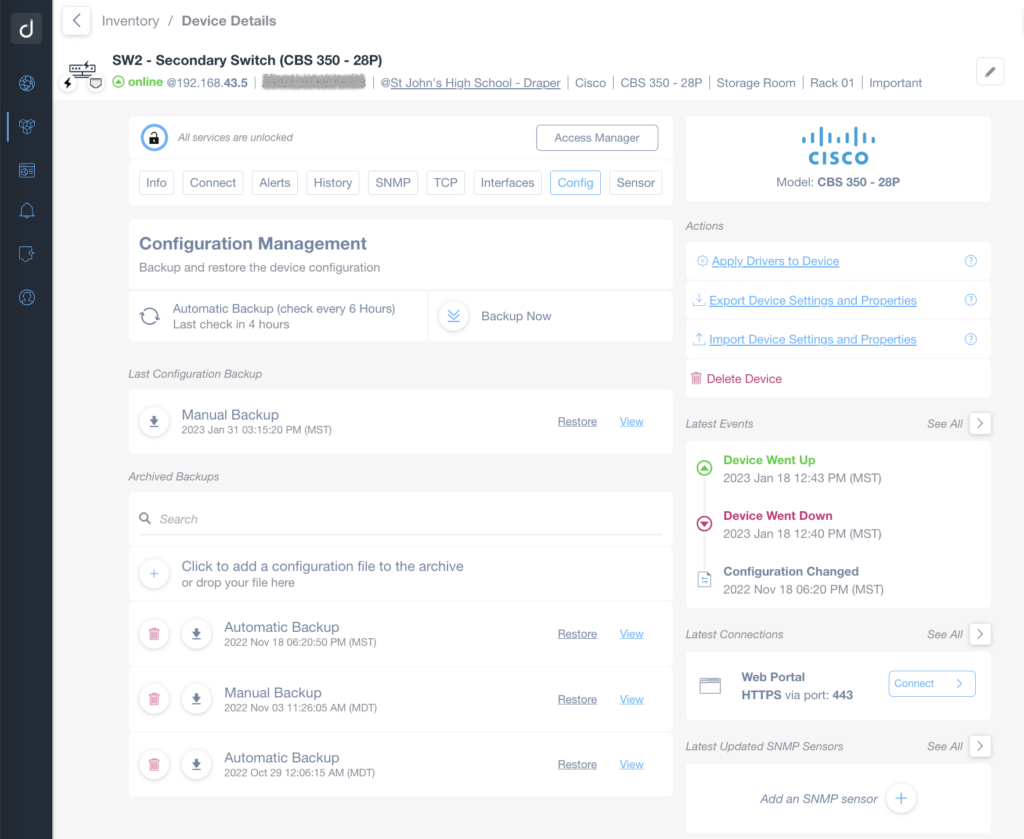
Additionally, Domotz will keep track of the configuration changes over time and notify you if there are any changes to help you quickly identify network configuration issues. We’ll also alert you about differences between the startup and runtime configurations which means there is a misalignment.
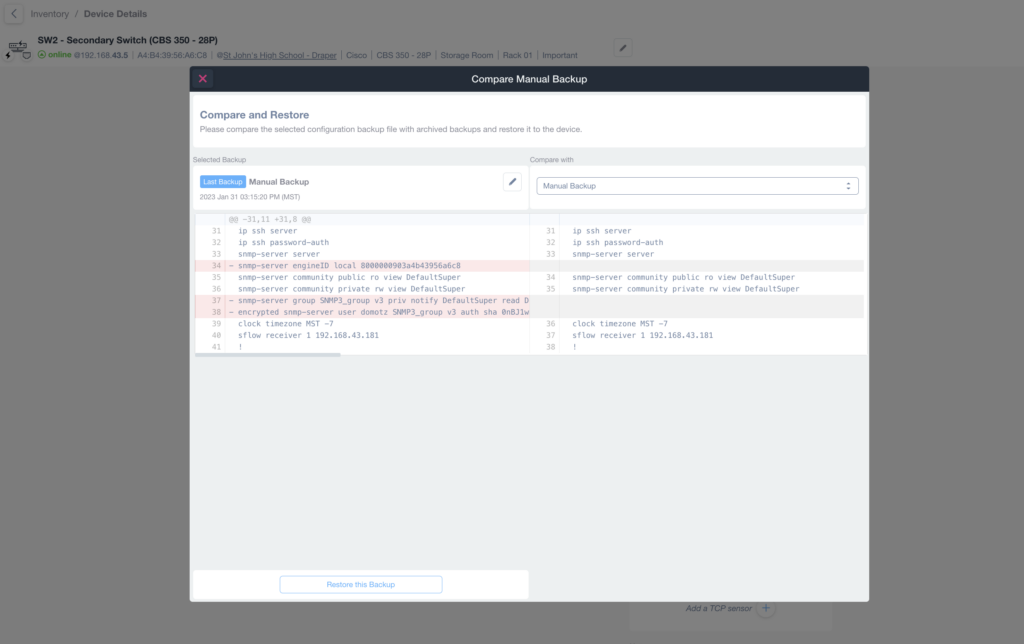
For more information, please visit Network Configuration Management and the instruction page to enable your Cisco CBS system.
Improvements
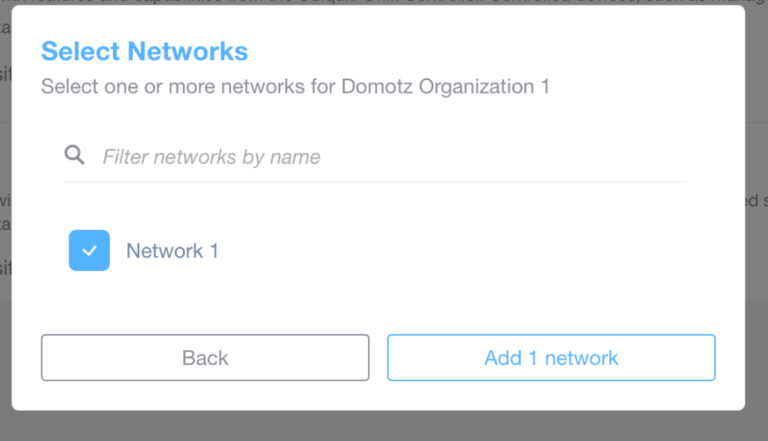
Support for Multiple Networks under Cisco Meraki Cloud connection
We have just released an improvement to our robust integration with the Cisco Meraki Cloud.
The integration now allows you to choose among multiple organizations (retrieved from the Cisco Meraki Cloud) and all the networks available for those organizations. Domotz users can now extract and see additional information for all the WiFi Access Points configured under different “Networks” in the Cisco Meraki Cloud instead of selecting a single Network.
For more information, please refer to further details about the Domotz Cisco Meraki Integration.
Improved support for Alerting on various Sensors
Specifying the unit when configuring an alert condition on OS Sensors, SNMP PreConfigured Sensors, Custom Integration sensors, and other variables is now possible.
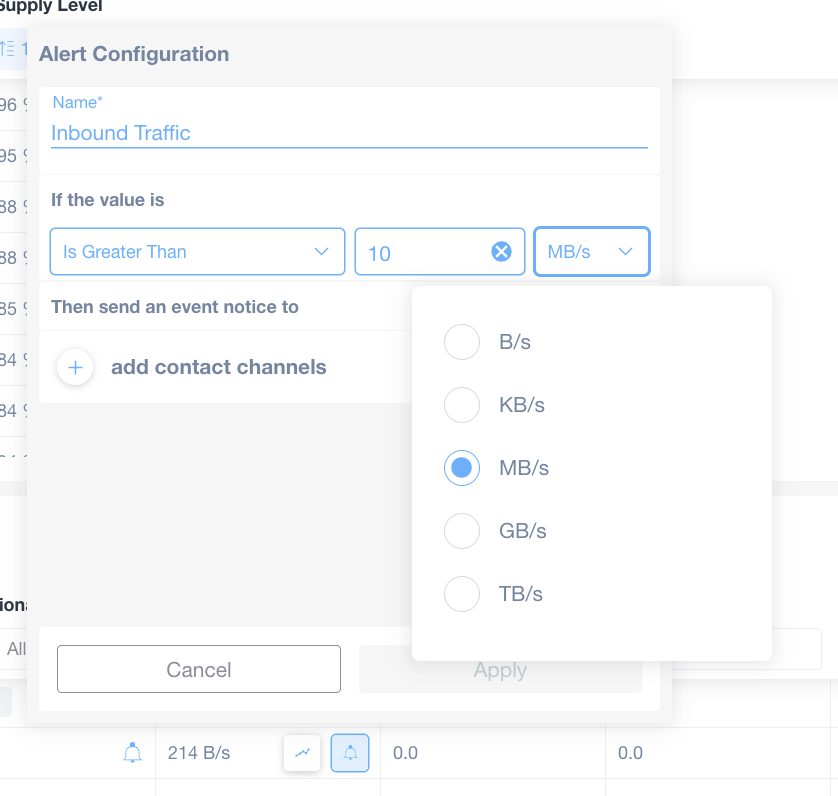
This way, it is easier to read notifications on your Ticketing System or email when something happens on the remote networks you are taking care of.
Self-service move Agent to New Hardware
When configuring a new Domotz Agent, you are now able to choose if you’re using a new Domotz agent or replacing a previously configured one:
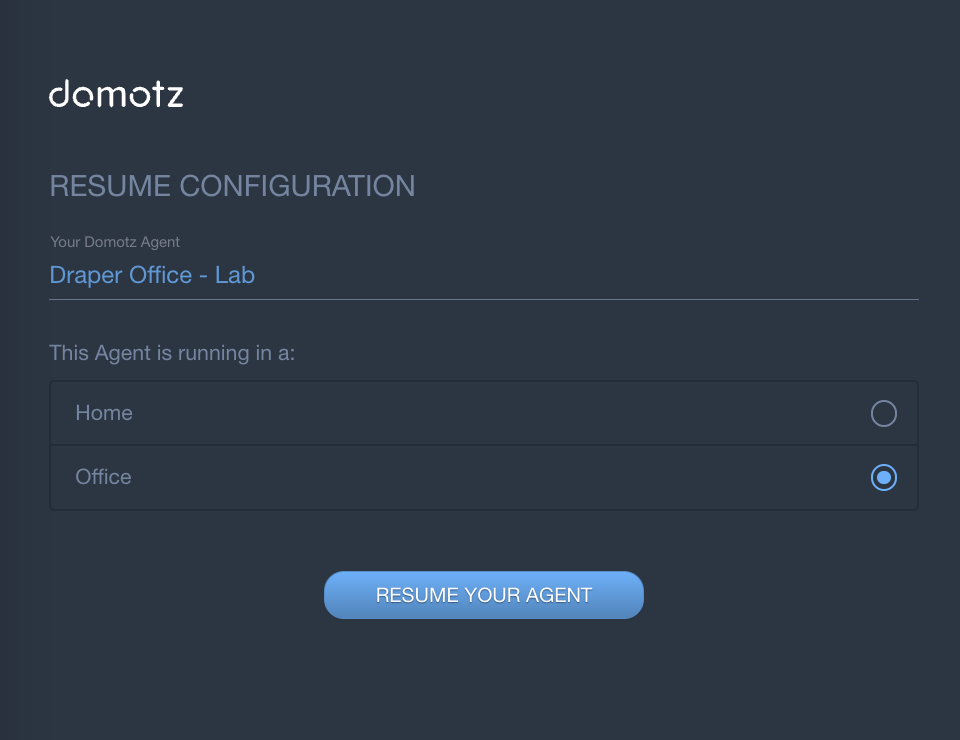
In this way, you no longer need to contact our Support Team if you need to replace the hardware hosting a Domotz Agent. You will be entirely independent in this process.
For more information, please visit Move the Domotz Agent to a new Hardware.
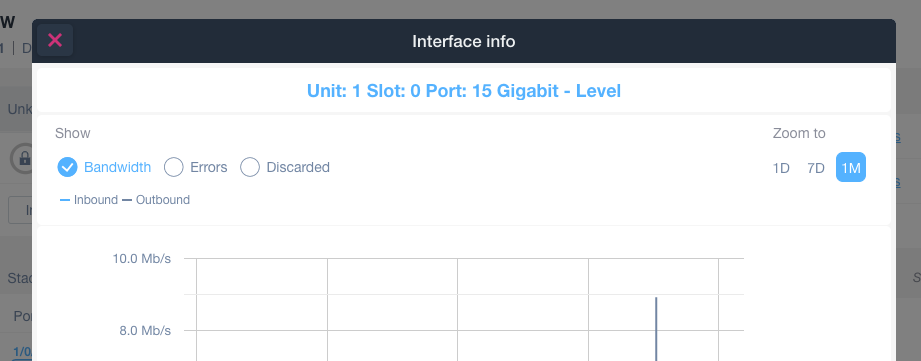
Improved list of Network Interfaces for Switches
We have redesigned the logic for ordering ports in the Network Interfaces tab for switches.
The new logic reports the “virtual” interfaces at the bottom of the list.
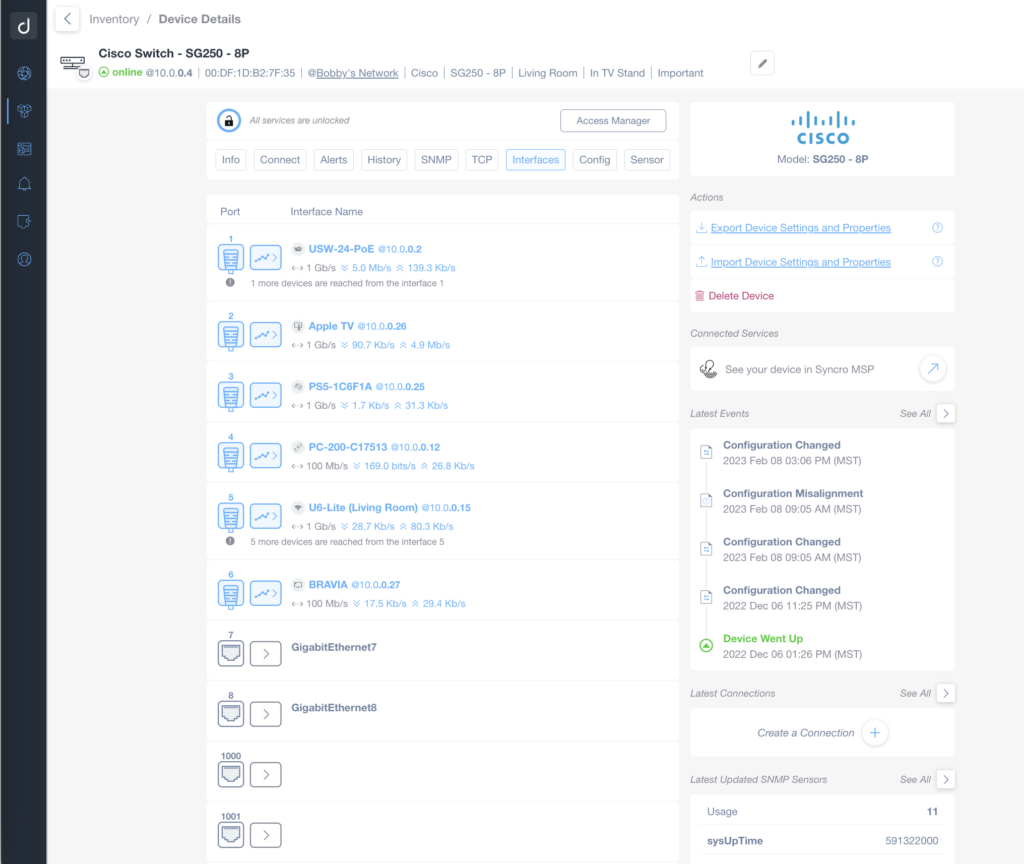
The new logic should help when you’re using stacked switches or when you’re using multiple VLANs on the switch itself.
Moreover, with the new logic, when opening the details of a specific port, even if there is a device attached to the interface, the detail of the port will also display its natural description/name at the top of the page:
Manage Custom Integrations through Public API
It is now possible to control the application and execution of the Custom Integration scripts to the specific devices directly using the Domotz Public API:
Custom Drivers – Via Public API
In particular, you can retrieve all the possible Custom Integration drivers configured under an account, attach the integration to the specific device, or even execute a custom action using the Domotz Public API.
This allows you to create your own logic. For example, react to events happening on the Domotz Platform.
For instance, you can connect your Domotz data to a system (e.g., Make.com). Leveraging the Domotz WebHooks and Domotz Public API, you can issue a Reboot command to a Windows System in response to an event (e.g., the update installed requires a reboot).
For more info, please visit the page on Make.com (formerly Integromat): processing Webhook events with Domotz.
Device Management information under the Inventory Insights column
Within the Inventory Dashboard, under the Devices tab, it is now possible to filter for all the devices that require authentication for specific integrations (e.g., UPS, PDU control, etc.):
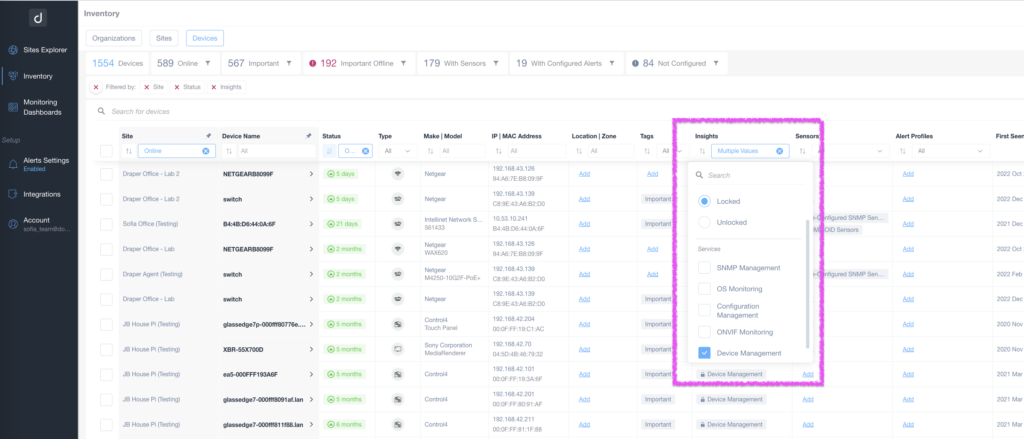
This way, you can quickly identify all the devices with advanced integrations across all the different sites/Agents configured.
Slimmer Template for Monitoring Network Switch Interfaces
We are pleased to announce the release of a new slimmer SNMP PreConfigured template for monitoring via SNMP a Network Switch. The old one has been renamed “Network Traffic (Extended)”, while the new one is simply: “Network Traffic”
This new template allows you to extract a reduced number of columns about the network interfaces, while using almost half of the resources of the previous template (in terms of sensors consumption). This allows you to save resources while still getting the necessary information about your network. We hope you enjoy this new template and find it useful to save on the amount of sensors consumed for each Network Switch you want to monitor.
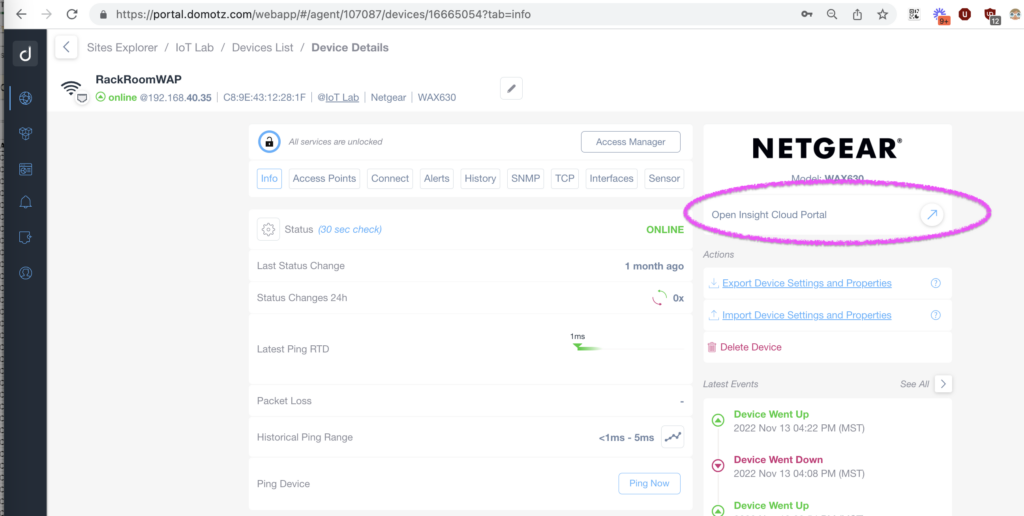
Quick connection to Netgear Insights portal
When we discover a Netgear device on a network, the details page of the device now includes a direct link to the Netgear Insight Cloud Portal:
Additional MIBs available in the Domotz Database
Additional MIB files are available for the following devices. Additionally, you can search for their OIDs from Domotz:
- XUPS
- Comba
- Hanwha Techwin
Fix
We’ve fixed We’veollowing issues:
- The Device History was not correctly displayed.
- Mobile Push Notifications were not received on Android devices.
- Multi-protocol analyzer for the internal driver could not be correctly triggered on devices using the same Vendor.
- FortiGate firewall identification/unlock is not working for prompt messages, including “#.”
- D”e to an error, users were not allowed to filter columns in the Custom Integration tables.
- Reporting of the Wrong OS Monitoring headers in the monitoring tables.
- On some networks, all the available IPs on a Routed subnet were reported as online.
- The inability of MarketPlace users to install new Agents when there was an Agent collaboration in place.
Known limitations
- There is no central repository for all the alerts configured on SNMP PreConfigured, OS Monitoring, and Custom Integration driver sensors.
- Monitoring Dashboards are currently limited to Monitoring Tables as Widgets.
- Luxul Router-based Agents do not support VPN on demand. To elaborate, we’ll add this capability as soon as Luxul’s team provides us with the required API.
- You can’t configure the static IP address on the Domotz Box before configuring the Agent.
- Lastly, you can’t leverage DHCP on additional VLANs on the Domotz Box.
To conclude, these release notes cover the changes in the Domotz Pro service since the previous one. Furthermore, these changes include Domotz Pro cloud, Domotz Agent, and Domotz Pro App.
Lastly, to learn more about our network monitoring software or our Know Your Networks Blog.