We’ve just released exciting new features on Domotz, including alerts on SNMP sensors, OS monitoring sensors, and custom integration drivers, which many of you have been waiting for. Exciting new features this month include a more powerful alerting mechanism for the following SNMP sensors:
Read on to learn about all the new functionalities we’ve released in the last few weeks. In summary, here’s what’s new on Domotz this month.
- More advanced and powerful alerts
- Integration with make.com (formerly Integromat)
- Additional scripts for monitoring Kubernetes
- Improvements to External Host monitoring
- Enhancements to the Sites Explorer
- Support for multiple Customers in the Syncro Integration
- Custom Integration Drivers list via Public API
- Additional MIBs
What’s new
More advanced and powerful alerts
You can now set alerts on the following sensors:
These new features rely on a new mechanism for alerting, which is more powerful. This new mechanism allows you to configure more sophisticated alerting rules.
A more powerful alerting mechanism
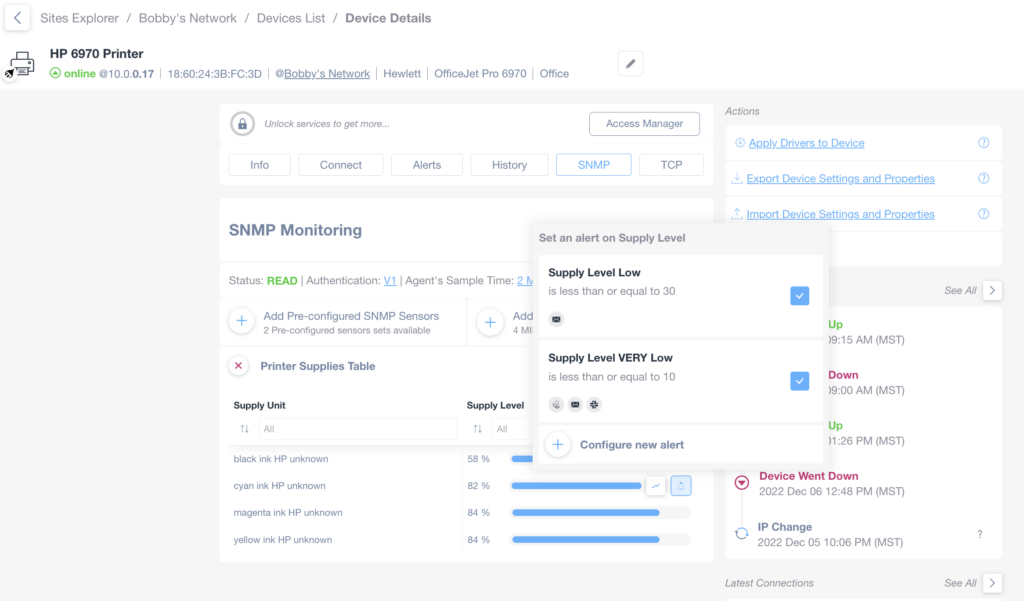
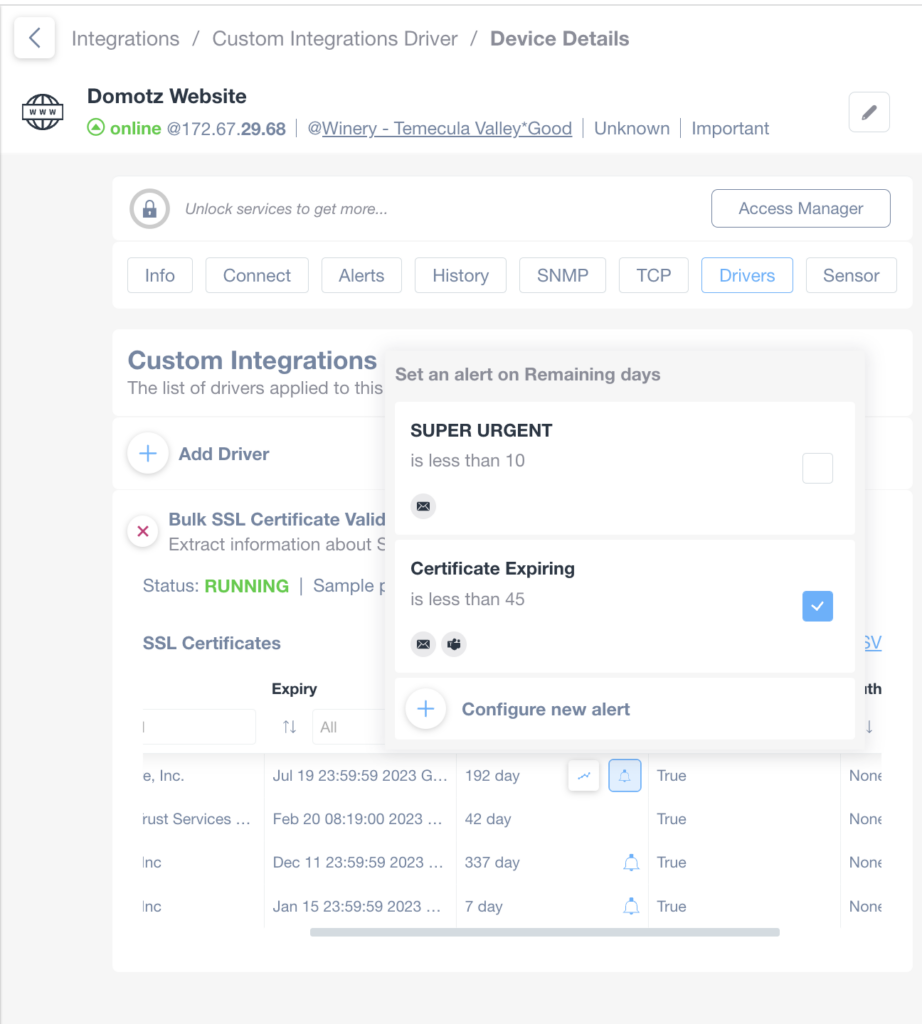
Thanks to our new alerting mechanism, you can receive an alert for the different metrics on different contact channels. For instance, receive an alert on a specific Contact Channel if a metric breaches a certain threshold. Moreover, you can receive a different alert, for instance, on a different Contact Channel, if a metric breaches a different threshold. Our new alerting mechanism offers you greater flexibility in creating alerts for the metrics you care about.
Moreover, you can also easily apply and re-use the same alert profile for the same type of sensor:
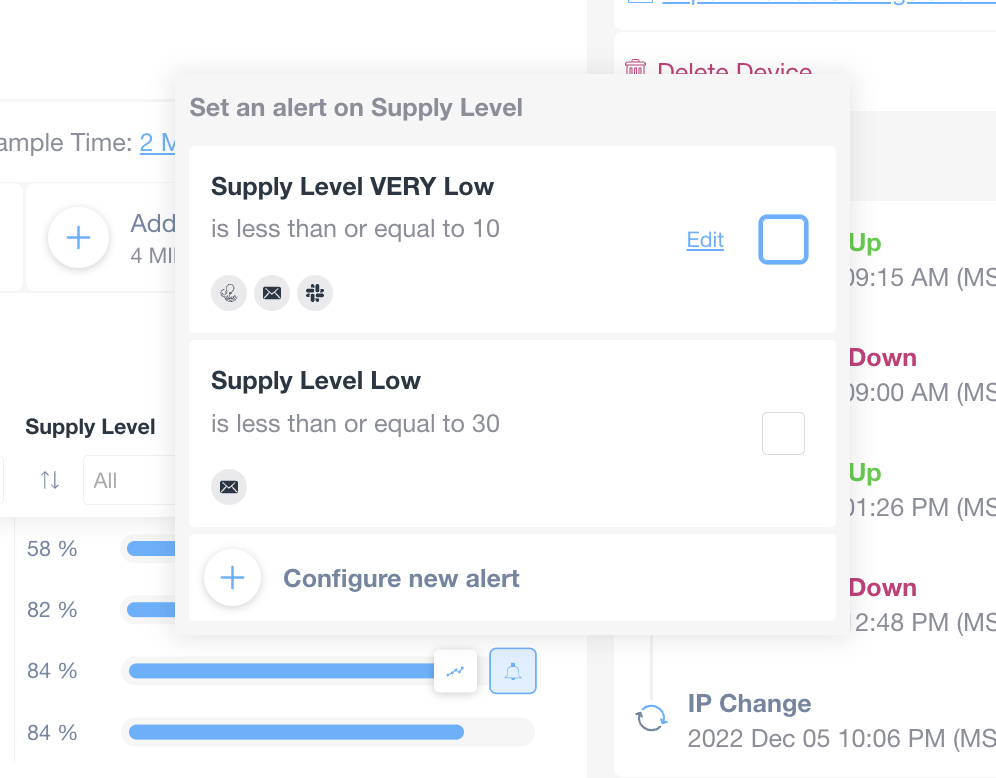
Similarly, if you edit an existing Alert Profile, all the sensors using that Alert Profile will inherit that change too.
Each Alert has an internal state (depending if the condition to trigger the notification is met or resolved). If you connect an external Ticketing System to Domotz, the tickets will update and resolve automatically if the auto-resolve functionality is available.
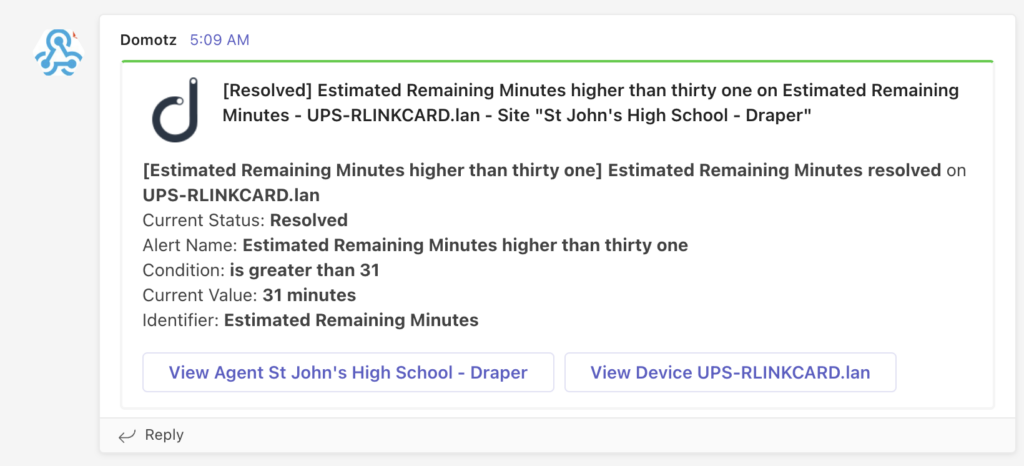
Similarly, when receiving messages on the chat channel (Telegram, Slack, Microsoft Teams) of your preference, we’ll highlight the status of the trigger in the message itself. For example, below is an alert example of when a particular sensor’s value breaches the alert condition:
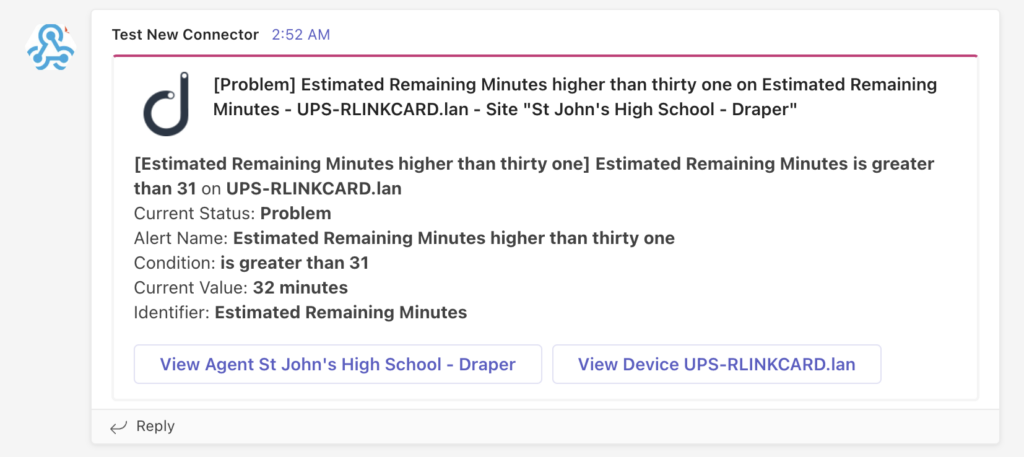
And this is when that same value returns within the acceptable range:
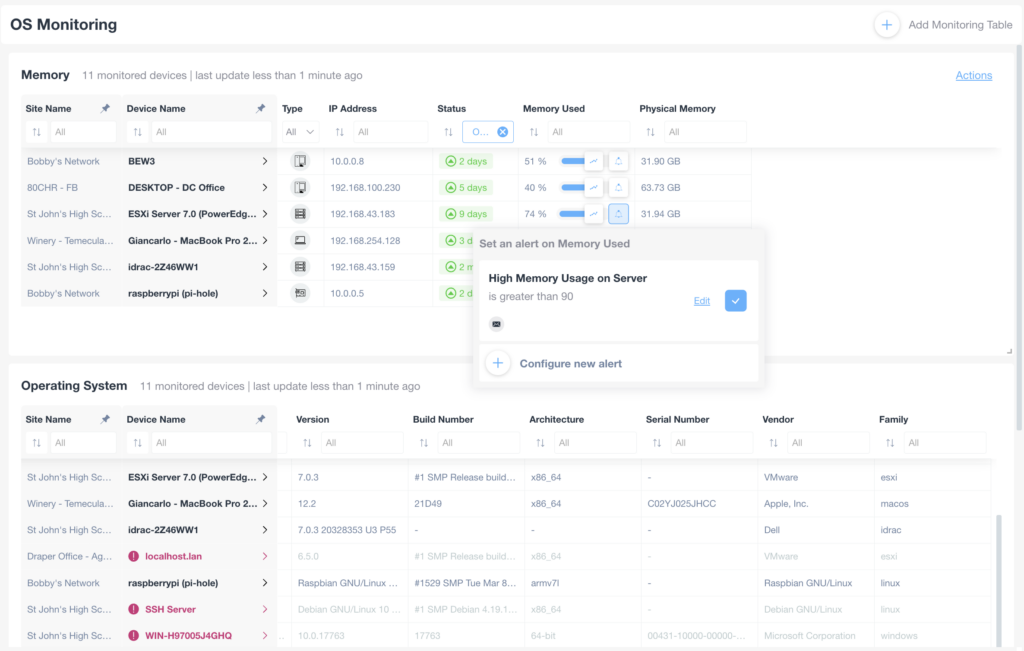
You can configure your alerts in the relevant tab of the Device Details section (i.e., SNMP tab for the PreConfigured SNMP Sensors, Drivers tab for the Custom Integration Drivers, and System for the OS Monitoring ones):
Moreover, you can also configure these new alerts in the Monitoring Tables of the custom Dashboards:
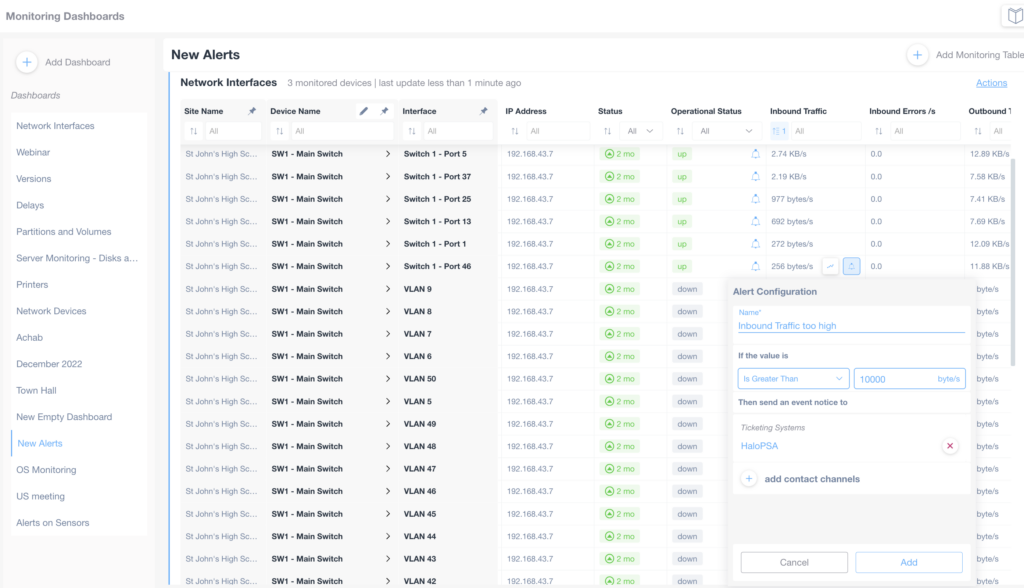
By enabling you to configure these alerts from the monitoring dashboard, you can now configure the same type of alert on the same type of variable across multiple devices and sites/networks:
Make.com (formerly Integromat) integration
You can now process WebHook events which Domotz generates with Make.com (formerly Integromat).
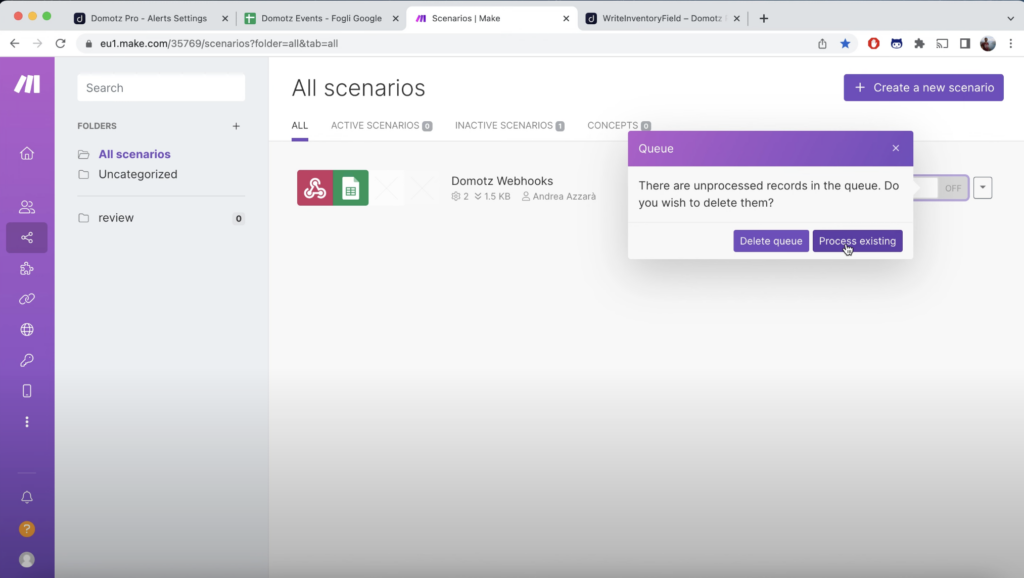
This new integration enables the processing of Domotz data in a custom way. The Domotz Public API is already an easy way to retrieve data out of Domotz with a polling mechanism, the Domotz WebHooks provide external systems with constant updates more efficiently.
However, processing WebHooks usually requires a self-hosted Web Server that receives the WebHook from Domotz and transforms the data for a target system.
With the new integration with Make.com, you get a simple system (based on Integromat) to process Domotz WebHooks for you. For instance, below are entries in a Google Sheet from events the Domotz Platform triggers (device status), which the Make.com integration then processes:
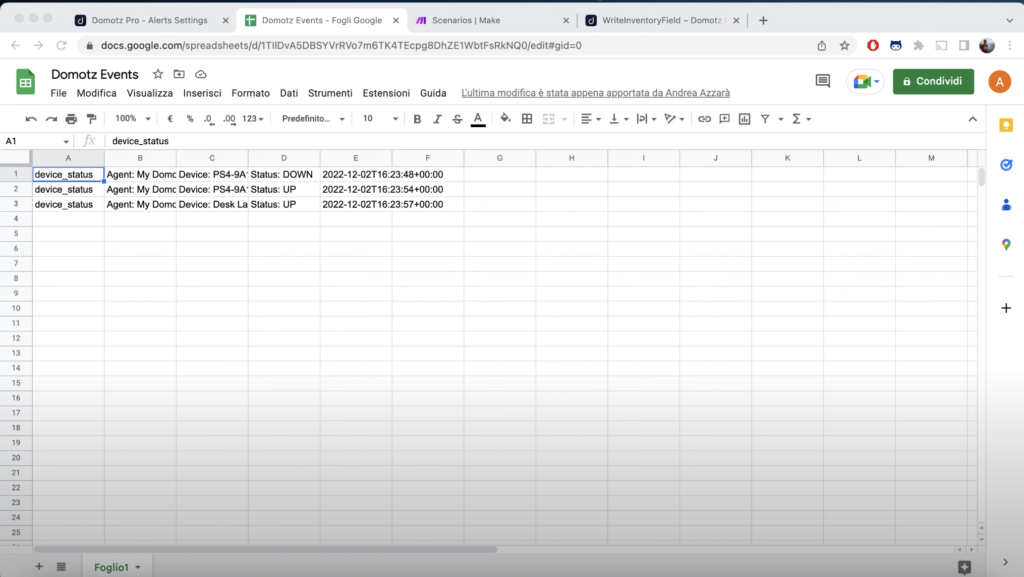
For more information, please visit Make Integromat integration page.
Improvements
Additional scripts for monitoring Kubernetes
Three additional scripts are now available for monitoring Kubernetes.
- kubernetes_scheduler.js – this script can extract information about the Kubernetes scheduler (such as CPU consumption, fds open and max, memory usage, etc.).
- kubernetes_cluster_state.js – this script allows the Domotz user to retrieve status data about the Kubernetes clusters.
- kubernetes_kubelet.js – this script extracts Kubernetes kubelet metrics by HTTP agent from Prometheus metrics endpoint.
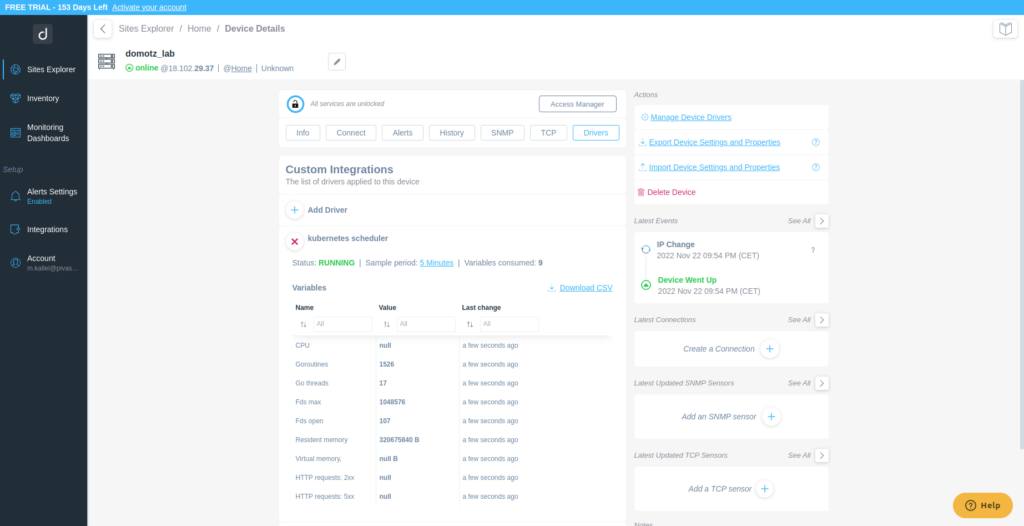
For more information, please visit the Kubernetes Monitoring Integration page.
Improvements to External Host monitoring
You can now monitor External hosts/IP Addresses (see Add an external hostname/IP for more information) based on available services (e.g. WebService on port 80 or 443) rather than simply on the availability of the ICMP (Ping) service.
Some public services (or, in general, public IP addresses/hosts) do not allow to be monitored via ICMP (Ping). On the other hand, they usually offer a specific service (for instance, an http/https Web Server on port 80 or port 443, which you can use to monitor and define the status of that specific external Host/IP address. A new version of the Domotz Agent can now use this mechanism to monitor external Hosts.
For more information about this capability and how to configure a Domotz Agent to monitor an external host/IP Address based on the available service (instead of ICMP), please contact our Support (support@domotz.com).
Improved Sites Explorer view
The Sites Explorer view has gotten an update so that it is easier to identify sites with Important Devices offline, as opposed to the ones with all the Important Devices online:
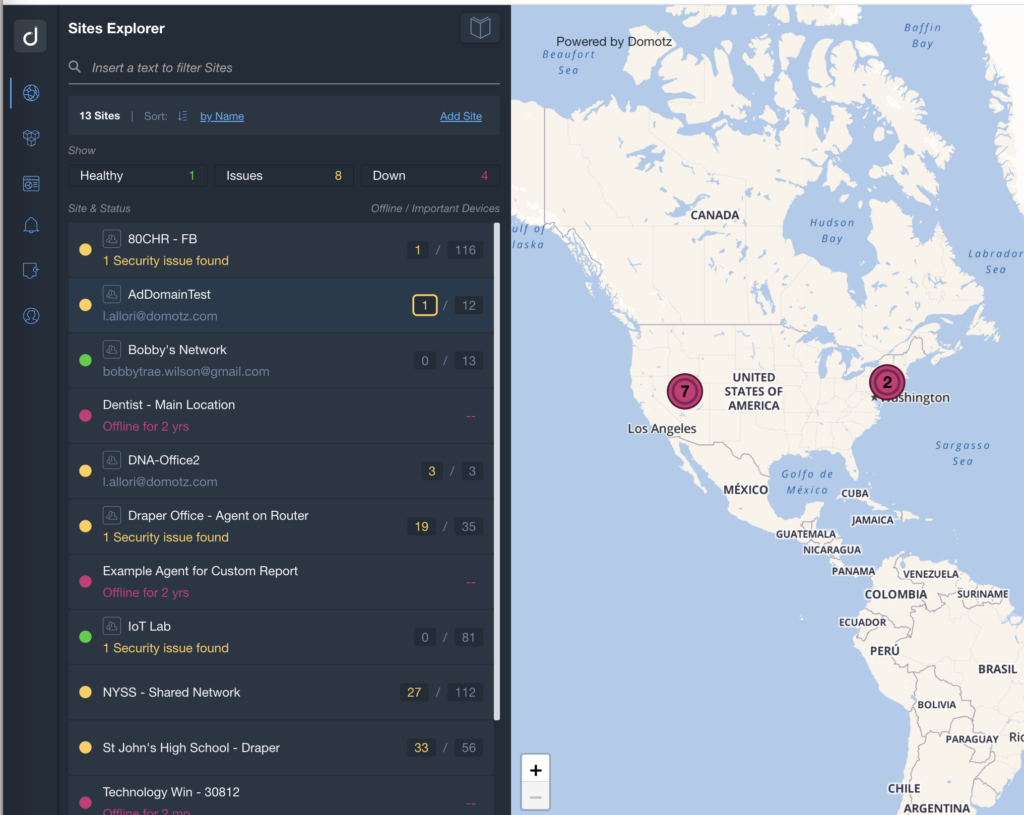
Moreover, it is now possible to click on either the “Offline” or “All” Important Devices number indicators, to retrieve directly only the “Offline” or the entire list of Important Devices configured for each site respectively.
Support for multiple Customers in the Syncro Integration (Asset Management)
Searching and retrieving all the customers configured in Syncro is now possible when setting up the integration between Domotz and SyncroMSP for Asset Management synchronization.
You are now able to scroll the entire list of possible customers in Syncro, as well as search for a specific one.
Custom Integration Driver list via Public API
It is now possible to retrieve the entire list of possible Custom Integration Drivers available on a specific Domotz account via Public API.
For more information, please visit List Custom Drivers section in the Domotz Public API documentation.
Select All devices when Creating Monitoring Tables (Sensors)
It is now possible to select all the devices when creating a Monitoring Table (within Monitoring Dashboard section) for sensors. This allows the user with a single click to list all the devices that have the capability of listing SNMP Sensors, rather than OS Monitoring sensors.
Additional MIBs available in the Domotz Database
Additional MIB files are available for the following devices. Additionally, you can search for their OIDs from Domotz:
- Vertiv/Liebert MIB
- Additional Synology MIB files
- HANWHA-NWC-MIB
- IMI MIB
- LifeSafety Power
Fix
We’ve fixed the following issues:
- The new vendor name for Ubiquiti (Ubiquiti Inc.) is now supported for the Unifi integration.
- Manual links with PDUs/UPS outlets disappeared in case of password (or connection) errors in retrieving data.
- On the FreshService integration, the Domotz user is now used for updating the tickets.
- NETIO Products are now correctly recognized as such.
- You can now use much longer passwords in the Custom Integration Driver configurations.
- Bonjour and UPnP data were mistakenly associated with the wrong devices.
Known limitations
- There is not a central repository for all the alerts configured on SNMP PreConfigured, OS Monitoring and Custom Integration driver sensors. We are aiming to have this available before end of Q1 2023.
- Monitoring Dashboards are currently limited to Monitoring Tables as Widgets.
- Luxul Router-based Agents do not support VPN on demand. To elaborate, we’ll add this capability as soon as Luxul’s team provides us with the required API resources.
- You can’t configure the static IP address on the Domotz Box before configuring the Agent.
- Lastly, you can’t leverage DHCP on additional VLANs on the Domotz Box.
To conclude, these release notes cover the changes in the Domotz Pro service since the previous one. Furthermore, these changes include Domotz Pro cloud, Domotz Agent, and Domotz Pro App.
Lastly, to learn more about our network monitoring software or our Know Your Networks Blog.