We’ve just released exciting new features on Domotz. This month’s exciting features include support for Multiple Custom Integrations for the same device (so that you create multiple variable sets and tables or apply different pre-built integration scripts to the same device). Moreover, you can now export and download the data generated by the Custom Integrations in CSV including historical graphs.
In summary, here’s what’s new on Domotz this month.
- Apply Multiple Custom Integrations to the same device
- Create monitoring tables in a more accessible and effortless way
- Kubernetes Monitor Integration
- Export Custom Integration data in a CSV file
- Access Historical graphs for Custom Integration data
- Sort by Important Offline Devices in the Sites Explorer
- Specify the purpose of credentials in Public API
- Set custom Intervals for Scans and Monitoring (Enterprise Plan)
- Monitor external devices that do not support ICMP
What’s new
Apply Multiple Custom Integration to the same device
You can now add more than one Custom Integration script to a single device.
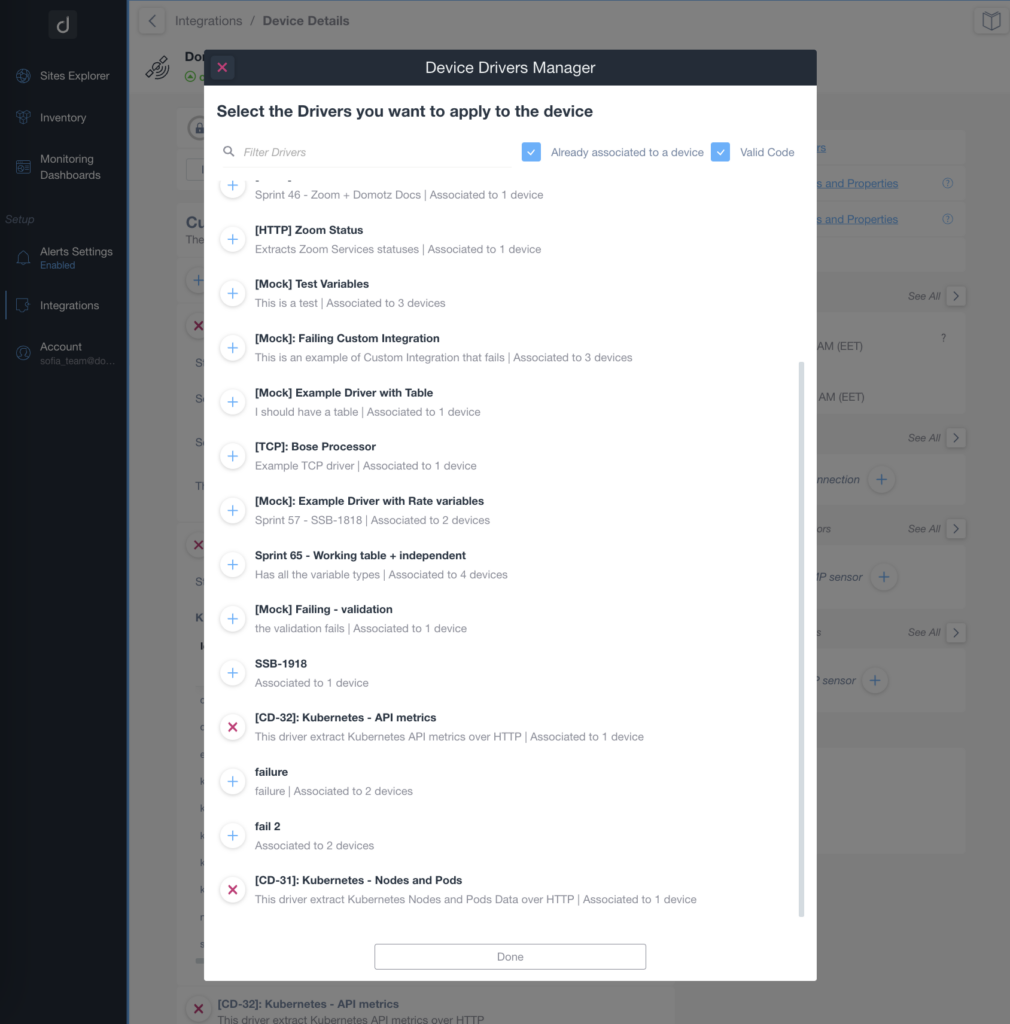
The result is that you can create different data sets (stand-alone variables) or tables on the same device.
Moreover, some of the pre-built integrations have been split into multiple scripts so that you can aggregate the data into different sets or tables. With this new capability, you can choose more than one integration script and apply it to the same device.
In summary, with this new capability, you can monitor multiple aspects of the same device, leveraging different Custom Integration scripts.
Simplified Monitoring Tables
When creating a new Monitoring Table within the custom Dashboard, you will see all the possible pre-configured tables available to you:
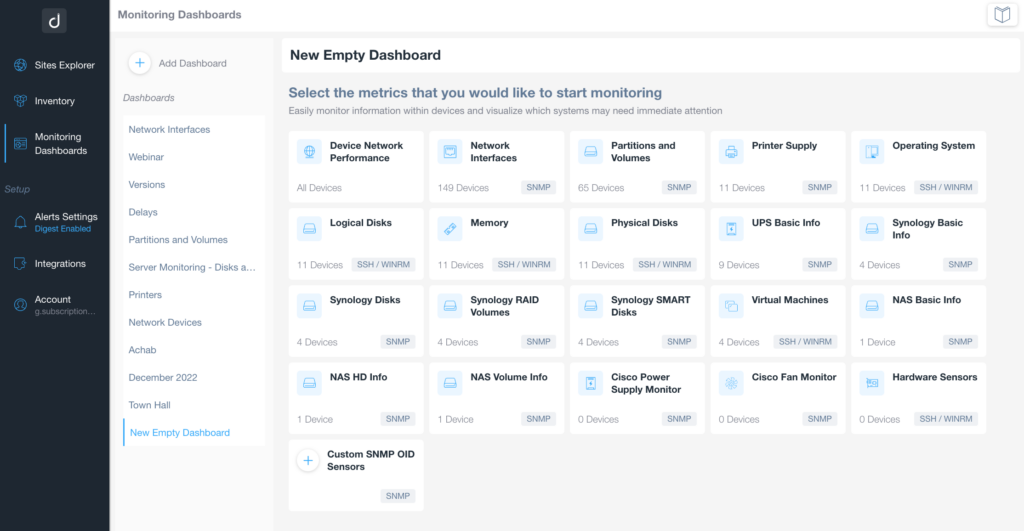
The list includes all the possible tables and shows the number of Devices you can include in each table. We populate these numbers using the data from the account you’re working on.
For instance, if you want to create a Monitoring Table of UPS Basic Info data, we’ll show you the exact list of all devices that can access the UBS Basic Info data.
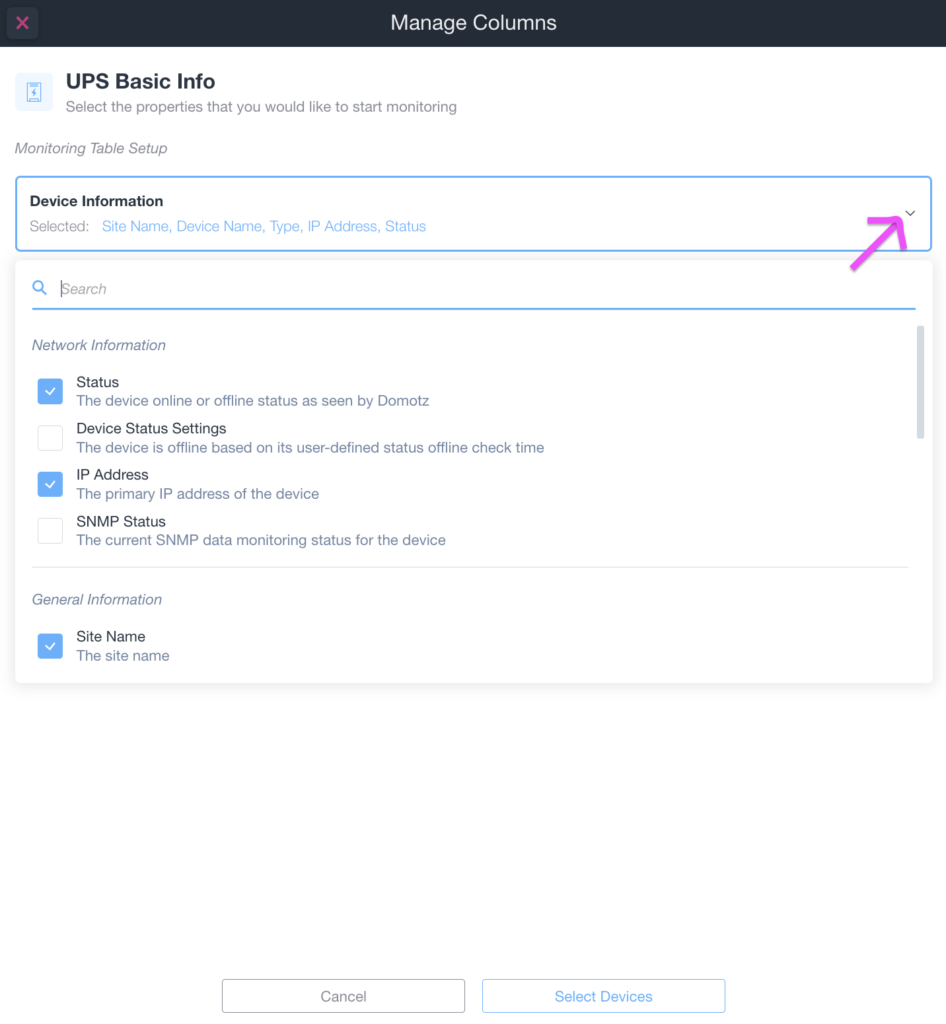
Moreover, when creating the table, you select the columns you want to see:
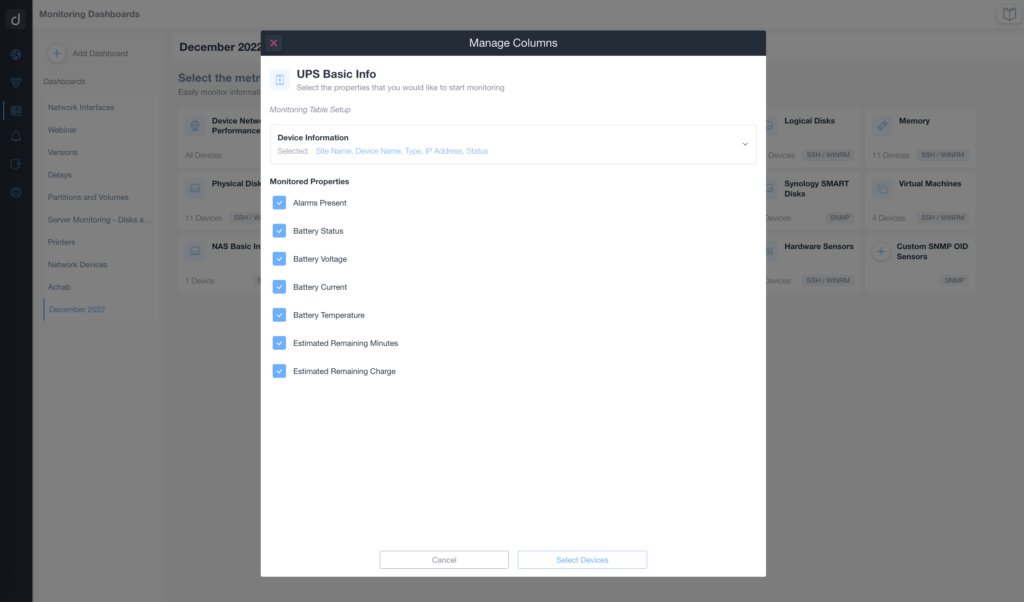
Finally, for each table, you can select generic Device Information (like Agent Name, Type of device, IP, Status, SNMP, etc.).
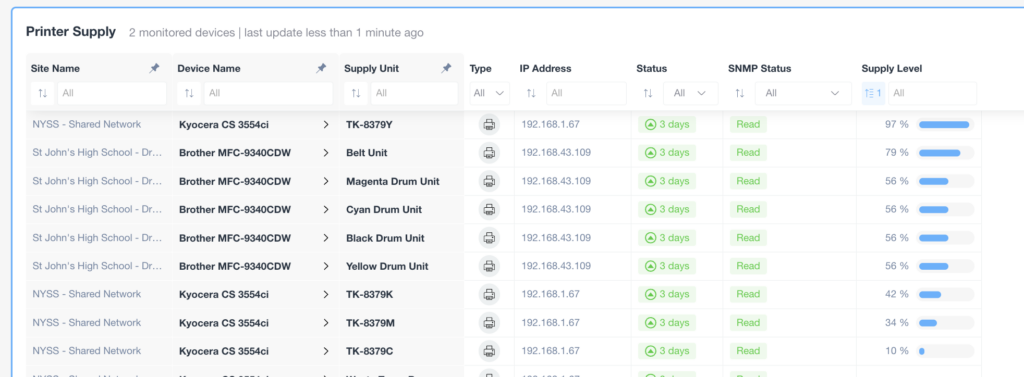
Next the information will be available in the table:
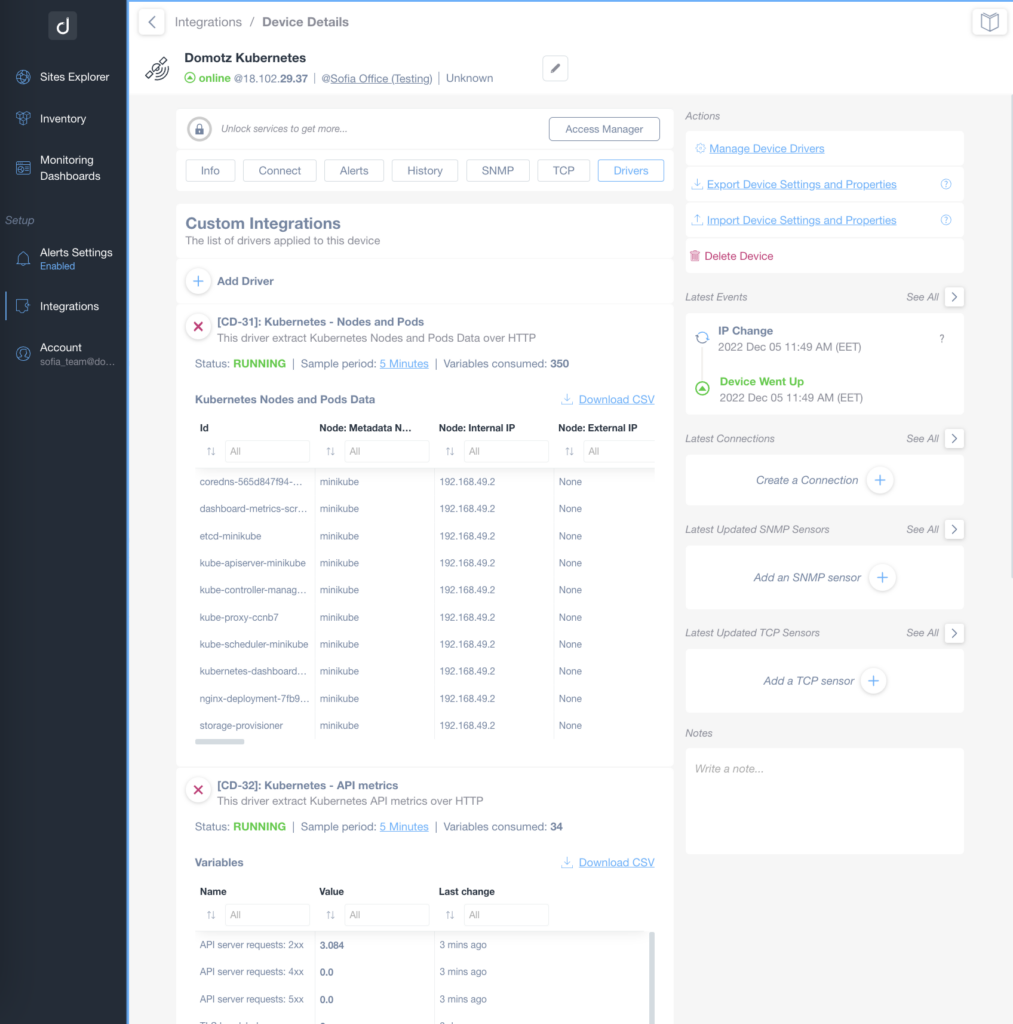
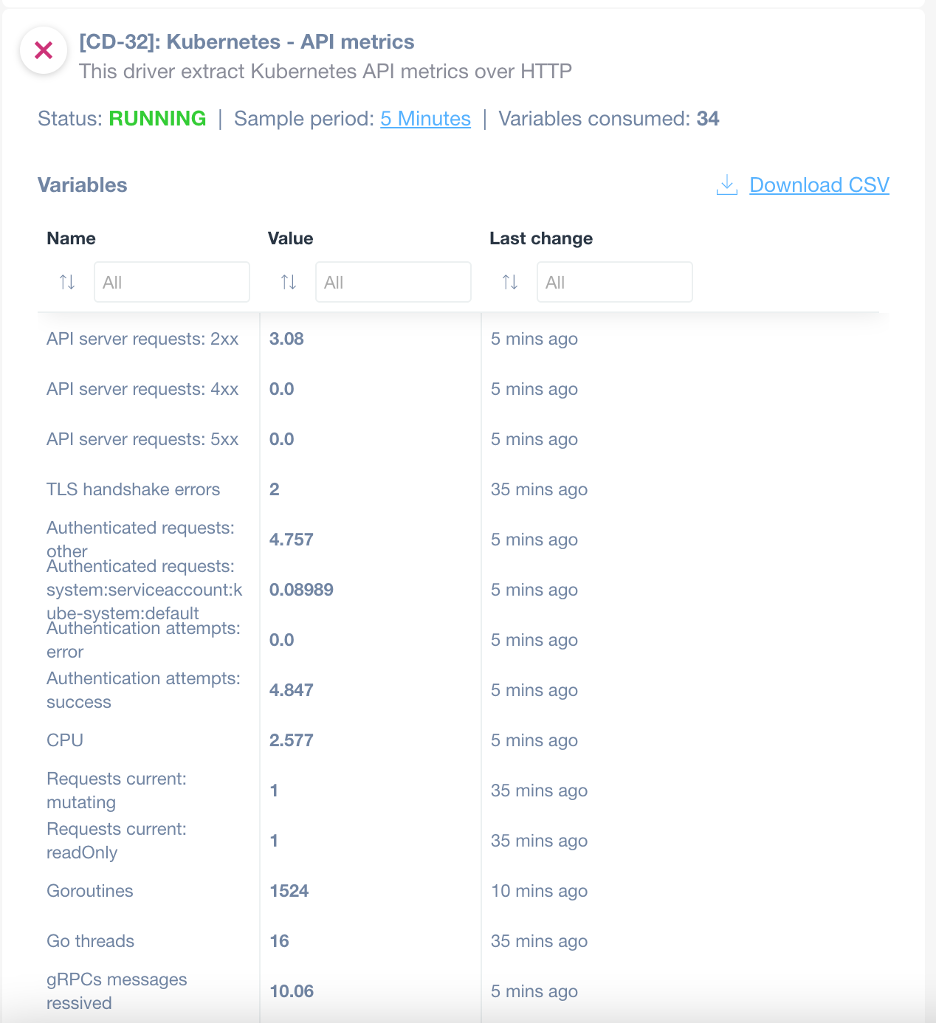
Kubernetes Monitor integration with Domotz
We’ve got a new Kubernetes monitor integration for Clusters. Monitor a Kubernetes instance directly through Domotz. Leveraging our Custom Integration Drivers framework, you can proactively monitor the configuration of nodes/pods and other API metrics.
The new monitoring integration allows you to dynamically create a table with columns specified in nodeTable variable and refer to the Nodes/Pods configured in the Kubernetes Cluster. Moreover, a different script also allows the creation of metrics for responses of the service or counters like Server requests, CPUs, threads, routines, etc.
Get the detailed guide for the Kubernetes monitor integration.
Improvements
Custom Integration data exported in CSV
You can now export the data from your Custom Integration drivers into a CSV file:
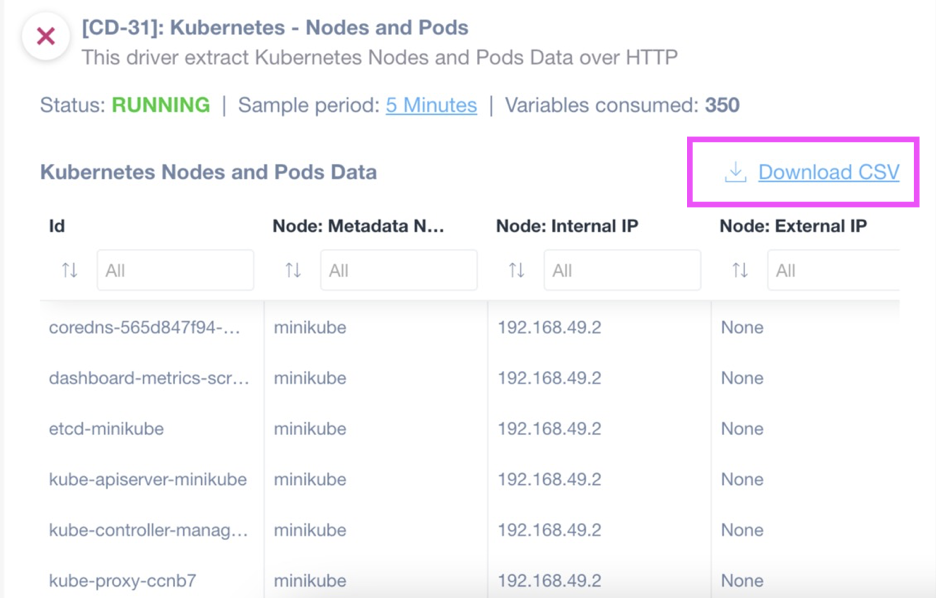
The file is created with the raw data behind the table itself, without any further formatting or UI modification. This is so you can access the original information the Custom Integration script extracts.
Currently, only the data created in the table format can be downloaded as a CSV file (not the scalar variables).
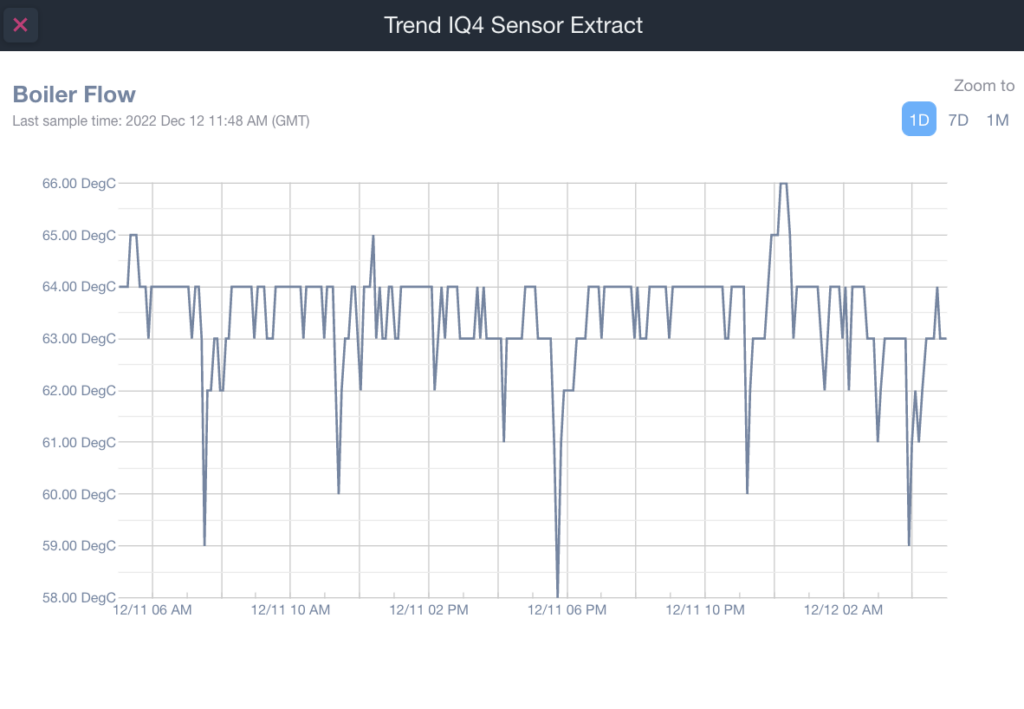
Historical graphs for Custom Integration data
We now graph the historical values recorded by the Custom Integration scripts. When clicking on the graph icon, depending on the type of information, Domotz will open a pop-up with either a graph (for the numerical values) or a history log (for the text values):
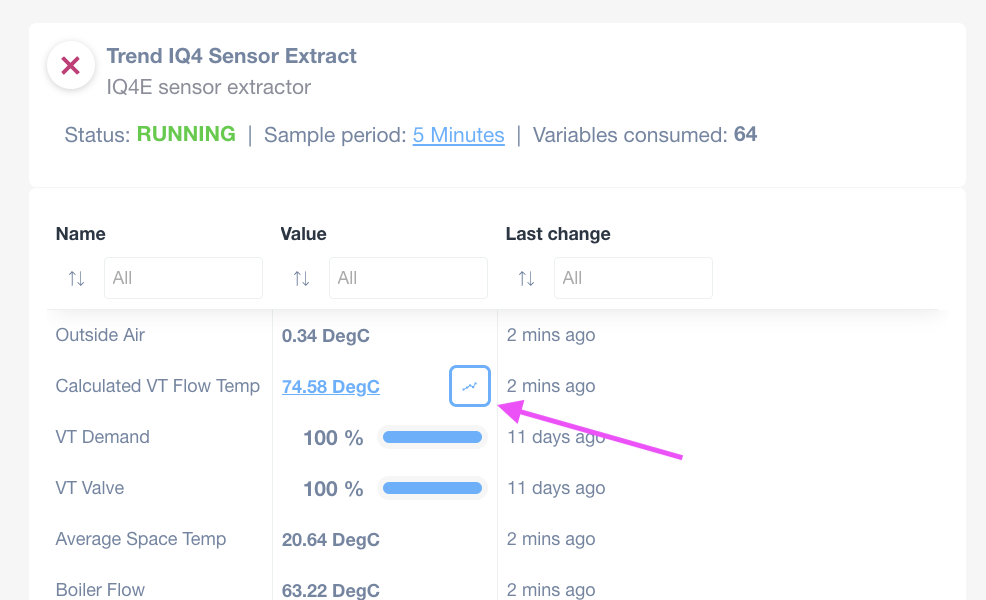
Moreover, you can now actively check whether your drivers are monitoring as they should be. If not, you’ll automatically receive an email to notify you about any issue in the execution of the custom integration script.
Sort by Important Offline Devices in Sites Explorer
You can now sort the list of Agents/Sites in the Sites Explorer view by the number of Important Offline Devices:
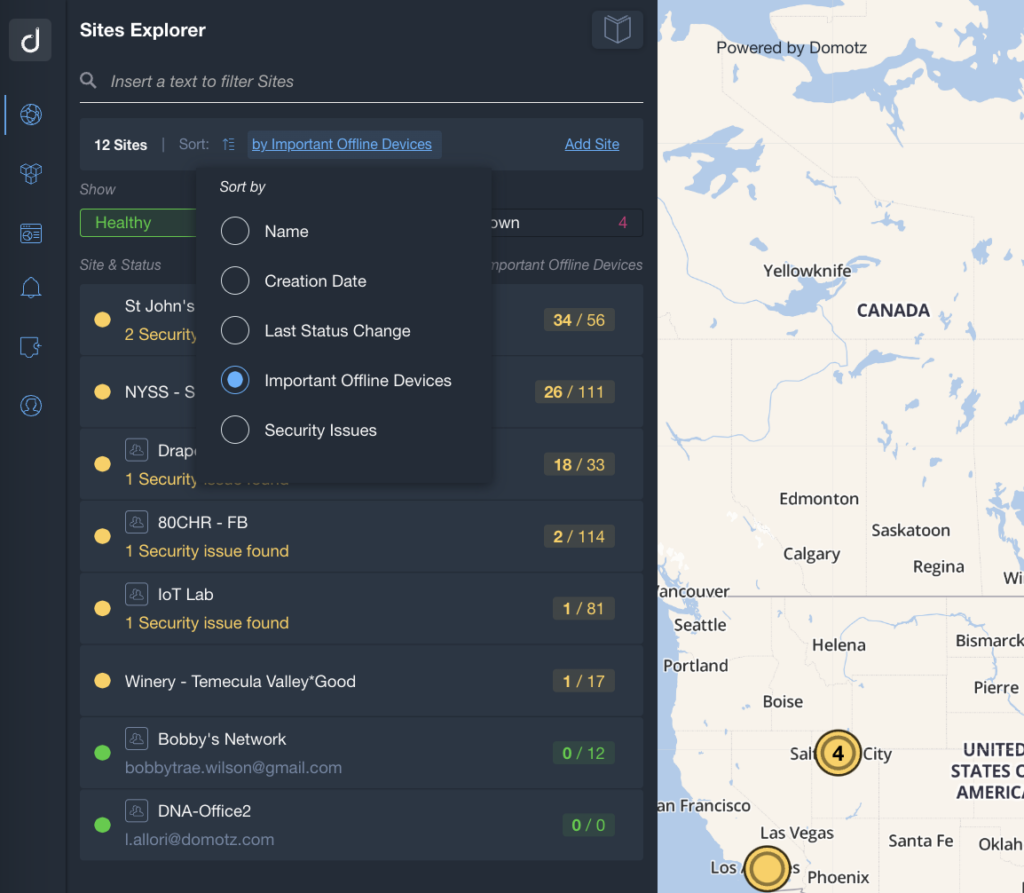
This displays your list with the Agents that require the most attention on top (e.g., because they have many essential devices offline).
Custom Intervals for Scans and Monitoring
The Enterprise Plan now enables you to customize the frequency the Domotz Agent uses to scan and monitor each device.
The default scan triggers every 30 seconds. Moreover, each discovered device on a network is continuously monitored every 30 seconds.
A new version of the Domotz Agent (available with the Enterprise Plan) can now be customized so that, for instance, scans and continuous monitoring are triggered only once every hour (or at a lower frequency). This customization is only available through the support channel.
Please note that the Standard Agents continue to allow the customization of the Time Window to mark a device as being offline. Please visit the Customizable Offline user guide for more information.
For information about decreasing the scan and monitoring frequency, please get in touch with support@domotz.com.
Specify the Purpose of Credential set in Public API
It is now possible to specify the purpose of each set of credentials configured via the SetCredentials Public API so that each different integration can leverage the correct set of credentials.
An optional parameter (scope) is now allowed in the body part of the SetCredentials API call.
For more information, please refer to the DeviceCredentials Schema.
Monitoring external devices not supporting ICMP
It is now possible to configure a Domotz Agent to monitor External Hosts/IP Addresses, even when the device does not reply to ICMP Ping.
We’ve added this feature because, in some cases, the External Host/IP Address is only used to host a different type of service (e.g., SSH, Telnet, HTTP, etc.), but ICMP Ping is filtered out.
With the new version of the Agent, it is possible to configure a specific Host so that the availability of the TCP service is used to monitor the status of that same Host. This is particularly valuable in the case of External Hosts hosting cloud services (such as Unifi cloud services).
Fix
We’ve fixed the following issues:
- The number of Security Warnings was not aligned between the Sites Explorer view and the Agent dashboard.
- Reactivated Agents after a subscription suspension were not listed in the Sites Explorer view.
- Un-grouping Network Interfaces from a single device was a prolonged process.
- Crestron PDU: firmware version identification was not working.
- TP-Link devices were wrongly identified as Aruba ones.
- When trying to configure Unifi as an external service with the wrong credentials, the Domotz UI created a duplicate entry.
- Configuration Management changes were not reported correctly for Fortinet firewalls (e.g., strings like “conf_file_ver=”, “set password ENC=”, “set auth-password-l2 ENC”, etc. were reported differently each time, just because the encryption changes).
Known limitations
- Firstly, Monitoring Dashboards are currently limited to Monitoring Tables as Widgets.
- Luxul Router-based Agents do not support VPN on demand. To elaborate, we’ll add this capability as soon as Luxul’s team provides us with the required API resources.
- You can’t configure the static IP address on the Domotz Box before configuring the Agent.
- Lastly, you can’t leverage DHCP on additional VLANs on the Domotz Box.
To conclude, these release notes cover the changes in the Domotz Pro service since the previous one. Furthermore, these changes include Domotz Pro cloud, Domotz Agent, and Domotz Pro App.
Lastly, to learn more about our network monitoring software or our Know Your Networks Blog.