
Introduction
The Inventory view is the default landing page when you open the Domotz WebApp or the Domotz Desktop App.
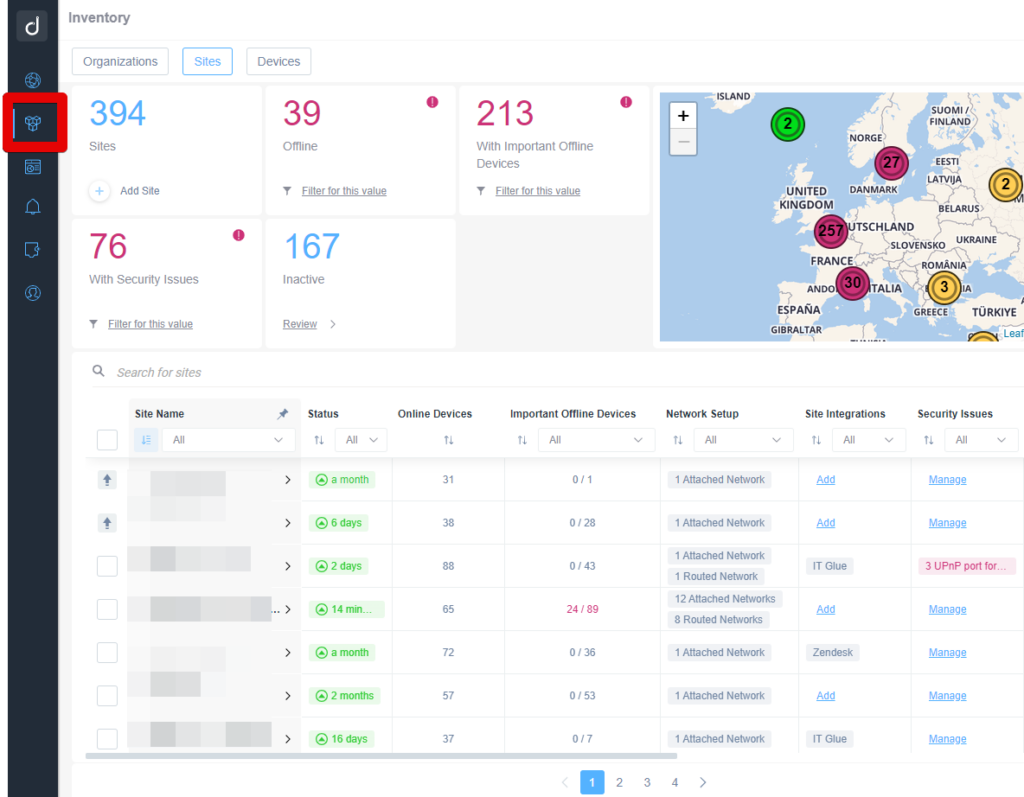
Inventory Overview in Software Dashboard
1. Navigate to the "Sites" tab to view information about network sites.
2. The dashboard displays totals: 394 sites, 39 offline, 213 with important offline devices, 76 with security issues, and 167 inactive. Use the "Add Site" button to create new entries.
3. A visual map shows site distribution in Europe, with numbers indicating site counts in each region.
4. A searchable table lists sites, displaying columns for Site Name, Status, Online Devices, Important Offline Devices, Network Setup, Site Integrations, and Security Issues.
5. Click "Filter for this value" to narrow the view by specific data points.
6. Use the "Review" link to assess inactive sites.
7. Click "Add" under Site Integrations or "Manage" in Security Issues to configure settings or address problems.
The Inventory view helps you to:
- Get a quick and complete overview of all your monitored Sites (Domotz Agents) and Devices
- Search across all your Sites and Devices
- Select multiple Sites or Devices to edit and apply common properties and settings
- Bulk export or import the settings of a Device to multiple other Devices at one time
- Bulk delete Devices you choose
- Add/edit a Site’s Customer details and manage your Sites grouped by Customer
- Review and manage configuration across multiple Sites
- Review and manage the configurations for multiple Devices across multiple Sites
Sites (Domotz Agents)
The “Sites” section within the Inventory view, is very useful for obtaining an overview of all your Domotz Agents along with Customer information.
At the top left of the screen you will be able to see a quick report on the status of your Sites:
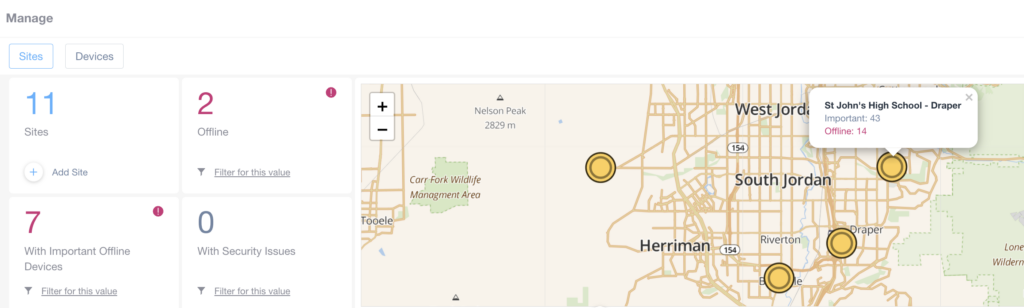
Dashboard overview of site management and status.
1. The page features a management dashboard with two main tabs: "Sites" and "Devices." The "Sites" tab is selected.
2. On the left, summary panels show key statistics:
- "11 Sites" with an option to add more sites through an "Add Site" button.
- "2 Offline" sites with the option to filter for these offline sites.
- "7 With Important Offline Devices" with a filtering option.
- "0 With Security Issues" with a filtering option.
3. On the right, a map displays site locations. Each site is marked with a yellow circle.
4. Hovering over a site, marked near Draper, reveals details: "St John's High School - Draper" with 43 important devices and 14 offline.
The following details are highlighted:
- Total Number of Sites Monitored
- Number of Offline Sites (which means the Domotz Agent is not communicating with Domotz Cloud)
- Number of Sites With Important Offline Devices
- Sites with Security Issues
- Geographical localization of your sites
At the bottom of the page, you will be able to search/access/manage/view detailed information about your Sites in a tabular format:
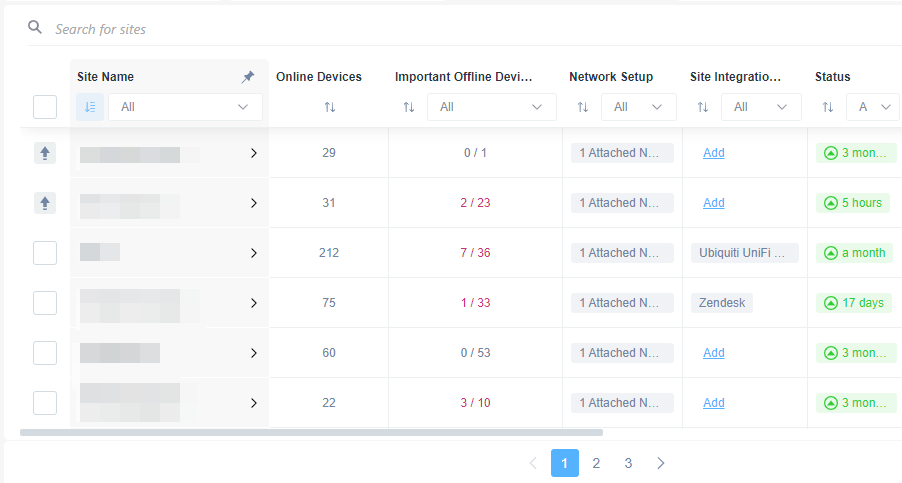
Dashboard of Site Monitoring.
1. Use the search bar at the top to find specific sites by name.
2. The table displays columns for:
- **Site Name**: Shows the names of various sites.
- **Online Devices**: Indicates the number of online devices at each site.
- **Important Offline Devices**: Displays the count of important offline devices out of total devices.
- **Network Setup**: Provides network setup details, such as attached networks.
- **Site Integration**: Allows adding integrations or showing current integration platforms.
- **Status**: Shows the time since the last update for each site.
3. Sort any column by clicking on the arrows next to the column names.
4. Use pagination at the bottom to navigate through different pages of sites.
Each row is a Site (Domotz Agent) and for each row the following columns are available:
- Site Select Column (checkbox)
- Site Name
- Number of Online Devices
- Number of Important Devices Offline
- Network Setup|
- Site Integrations
- Agent Status
- Security Issues
- Alert Profiles
- Customer ID / Email
- Contract ID
- Agent Platform
- Agent Internal IP/Mac Address
- Agent Deployment Date
- Agent License Owner
- Actions
Each column can be used for searching or refining a search with sorting options. Additionally, the table has column sorting options.
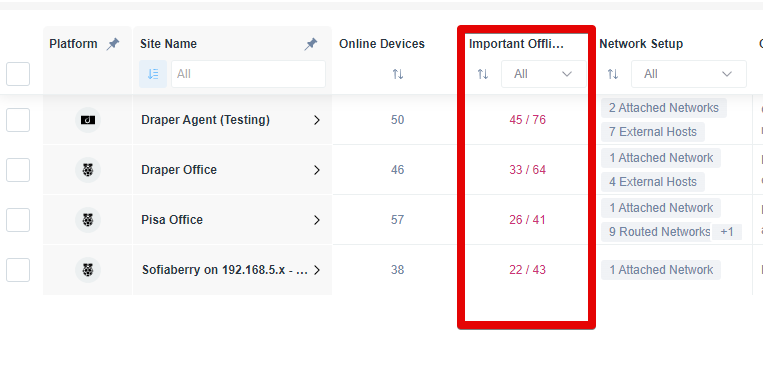
Network Site Overview Table
1. The table displays a list of network sites with columns for Platform, Site Name, Online Devices, Important Office Devices, and Network Setup.
2. The "Platform" column shows icons representing each site's platform type.
3. "Site Name" lists the names of each location: Draper Agent (Testing), Draper Office, Pisa Office, and Sofiaberry with specific network details.
4. "Online Devices" indicates the number of devices currently online at each site.
5. "Important Office Devices" highlights the number of important devices online compared to the total important devices, for instance, 45 out of 76 for Draper Agent (Testing).
6. "Network Setup" details the network configuration, such as the number of attached networks and external hosts per site.
Columns also contain structured information (for example you can see the number of possible Security Vulnerabilities discovered on each site):
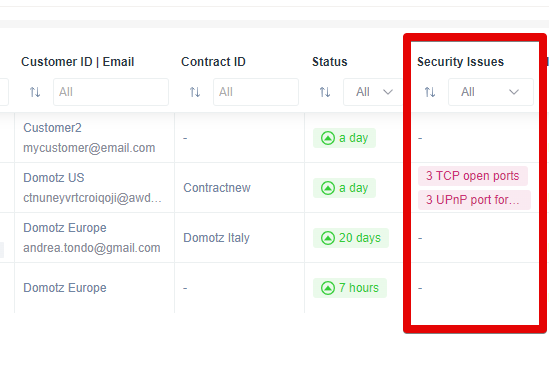
Security Issues Column in Customer Management Interface
1. Locate the "Security Issues" column on the right side of the table. This column indicates any security concerns related to the customers listed.
2. For the first row, note that "3 TCP open ports" and "3 UPnP port..." are highlighted, suggesting potential vulnerabilities for the customer with the email "mycustomer@email.com".
3. Other rows under "Security Issues" display a dash, indicating no current security issues for those entries.
4. Use this column to quickly identify and address security risks associated with different customers.
Additionally, you can inspect each Site’s network configuration details. We display VLANs/Network attached, Routed Networks, External Hosts, etc.
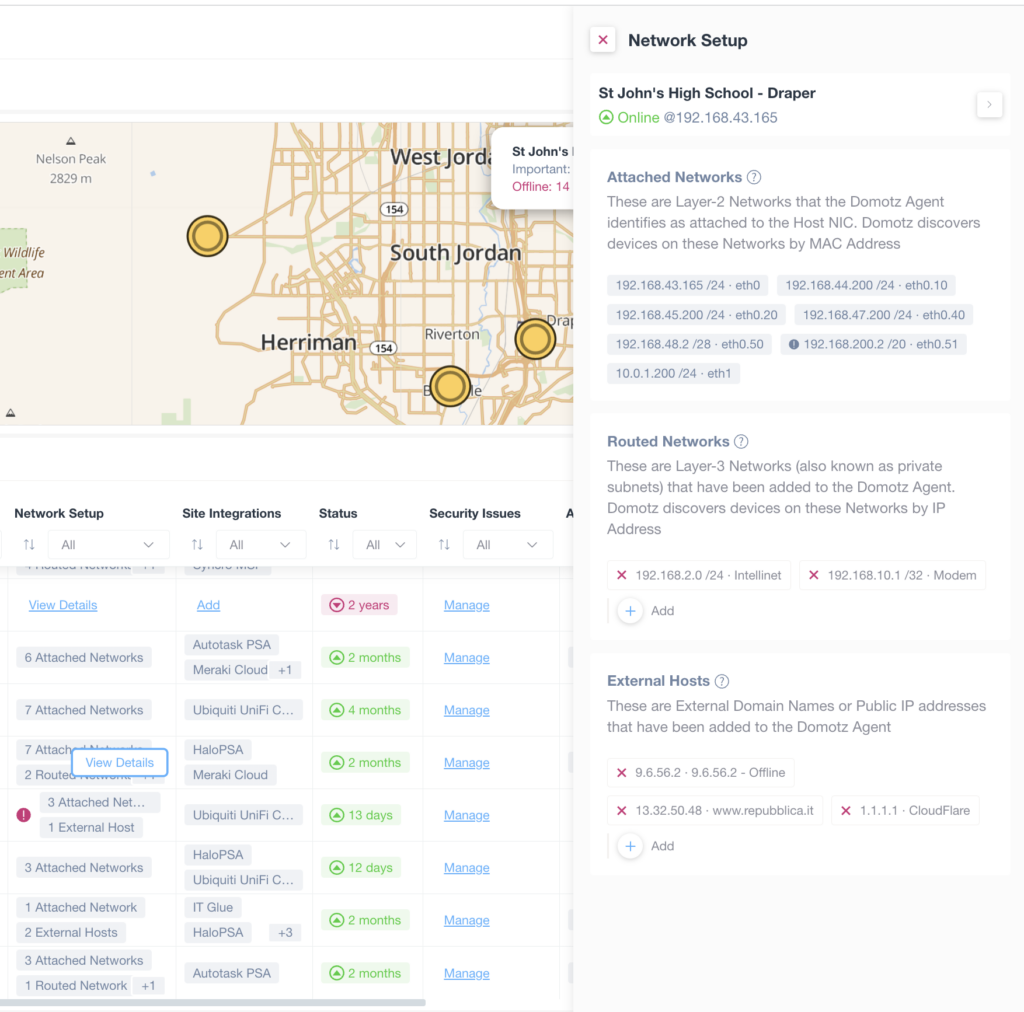
Network Setup Overview for Domotz Agent
1. The image displays a network setup interface for St John's High School - Draper. It indicates the network is online at IP address 192.168.43.165.
2. Attached Networks section lists Layer-2 networks connected to the host NIC, providing various IP/MAC addresses and Ethernet identifiers such as eth0.10 and eth0.51.
3. Routed Networks are shown as Layer-3 networks added to the Domotz Agent. It includes entries like 192.168.2.0/24 and 192.168.10.1/32 with the option to add entries.
4. External Hosts lists domains or public IP addresses added to the agent, highlighting both offline and active statuses, e.g., 9.6.56.2 offline and 1.1.1.1 via CloudFlare.
5. Main interface includes a map indicating network locations and a table detailing network setup, site integrations, status, and security issues. Specific entries are shown like “View Details” for more information on network setups.
When clicking on the name of a Site you will be able to access to the Domotz Agent dashboard, and from there you can then access to all the Agent capabilities. For example; The device list for that Agent, Network Info, Network Security, etc.
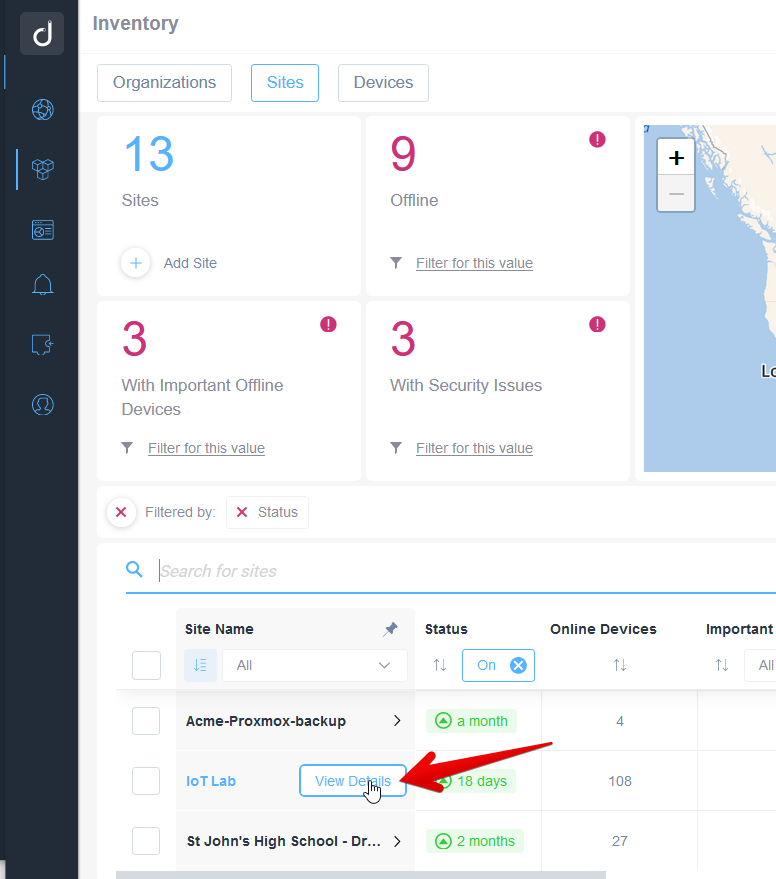
Viewing Details for a Site in Inventory Management
1. Navigate to the "Sites" tab in the Inventory section, where metrics like the number of sites, offline sites, and those with security issues are displayed.
2. To filter sites based on specific criteria like offline status or security issues, use the "Filter for this value" options under each metric.
3. In the site list, locate the site you are interested in, such as "IoT Lab."
4. Click "View Details" next to the site name to see more information about its status, including the number of online devices and time since last status change.
Devices
First of all, the Devices view is useful to search and manage all your devices across all of your Sites.
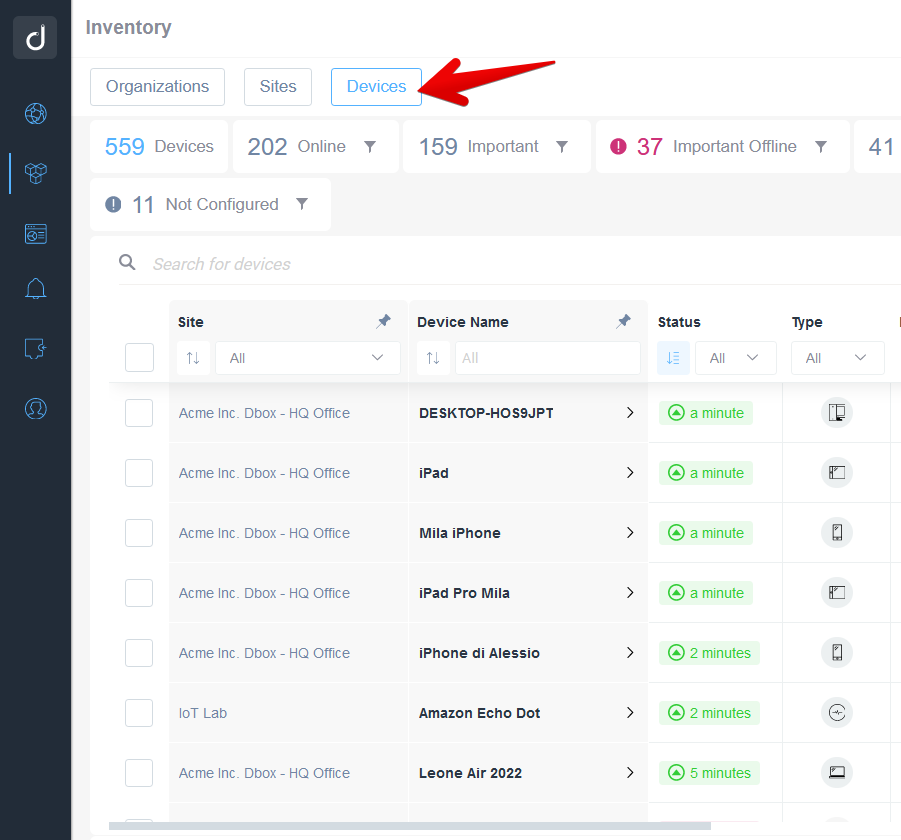
Device Inventory Tab in Software Interface
1. Navigate to the "Devices" tab at the top of the software interface to view device-related information.
2. The main panel displays a summary: 559 devices in total, 202 online, 159 marked as important, 37 important offline, and 41 offline.
3. Below the summary, use the "Search for devices" bar to locate specific devices by name or characteristics.
4. The table lists devices with columns for "Site," "Device Name," "Status," and "Type."
5. Each entry includes details such as site location, device name, connection status updated within the last few minutes, and type icon.
6. Use sorting and filtering options accessible via dropdown menus in the columns to organize the information according to your needs.
At the top of the page you’ll get an overview of all your devices:
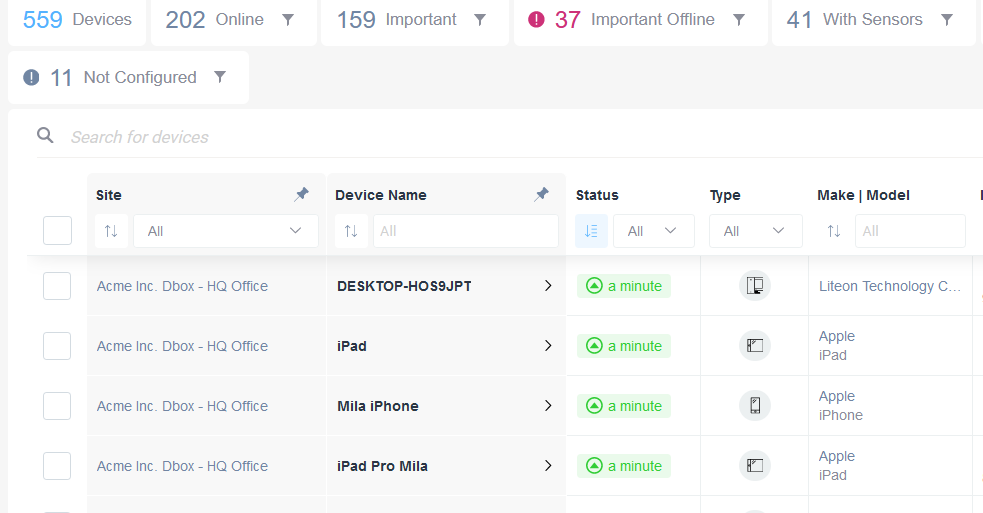
Device Management Dashboard Overview
1. The dashboard displays a summary of device status at the top, including total devices (559), online devices (202), important devices (159), important offline (37), and devices with sensors (41). It also shows not configured devices (11).
2. A search bar allows filtering of devices by entering specific search criteria.
3. The table shows detailed device information. The columns include:
- "Site" listing locations, such as "Acme Inc. Dbox - HQ Office."
- "Device Name" displaying individual devices like "DESKTOP-HOS9JPT," "iPad," "Mila iPhone," and "iPad Pro Mila."
- "Status" indicating how recently the device was active, with labels like "a minute."
- "Type" showing device types, represented with icons.
- "Make | Model" identifying device brands, such as "Liteon Technology" and "Apple iPad."
4. Use drop-down menus under "Site," "Status," and "Type" to sort or filter the devices by their respective categories.
Using the “Search for devices” text-box, you can filter the following fields: Name, IP Address, MAC Address, Model, Location, Zone:
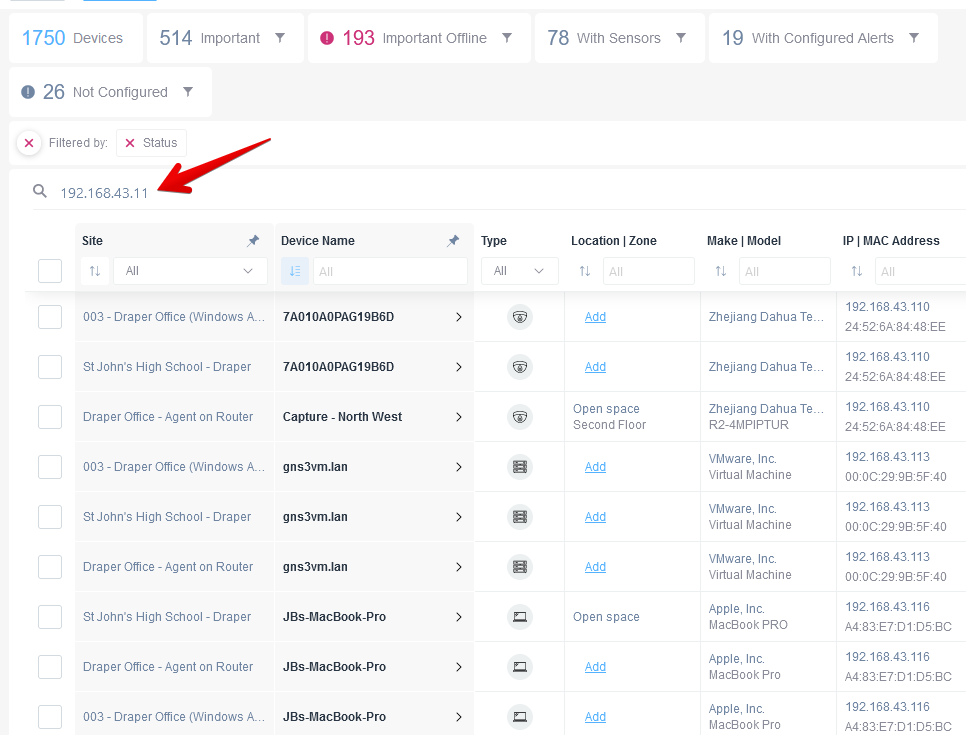
Searching for a Specific IP Address in a Device Management System
1. Locate the search bar at the top of the device management table.
2. Type the IP address "192.168.43.11" into the search field to filter the device list.
3. Observe the filtered results below the search bar, displaying a table of devices.
4. The table columns include "Site," "Device Name," "Type," "Location | Zone," "Make | Model," and "IP | MAC Address."
5. Review the details associated with each device, such as site information or MAC address, to find the matching entry for the searched IP.
Additionally, you can also filter the results of a specific column:
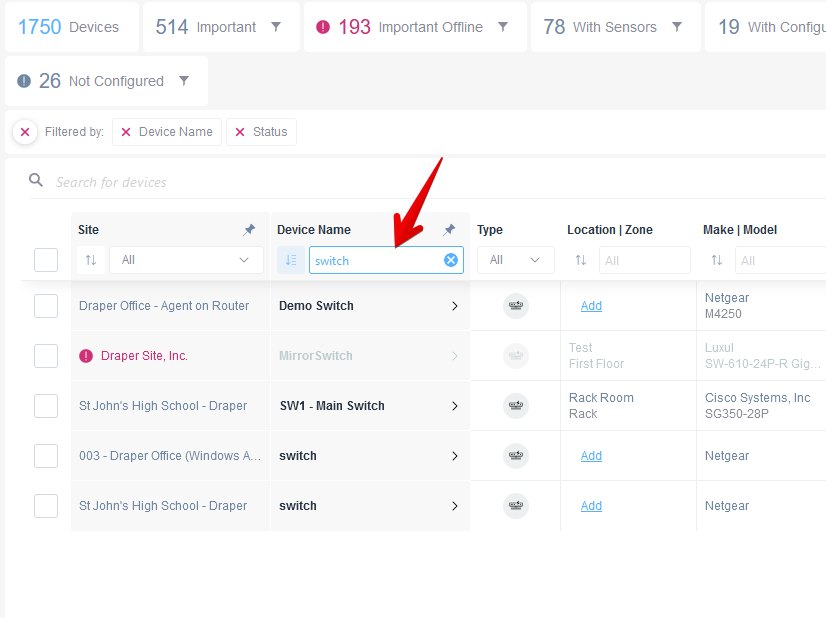
Device Filtering by Name in Network Management Interface
1. View a dashboard displaying device statistics, including total devices, important devices, important offline devices, devices with sensors, and those configured.
2. A filter bar below lists active filters: "Device Name" and "Status."
3. In the "Device Name" column, observe a text input field where "switch" is entered to filter results.
4. The table shows devices with "switch" in their name, alongside columns for site, device type, location/zone, and make/model.
5. Example entries include "Demo Switch" at Draper Office and several switches at St John's High School, displaying relevant details like site and model.
Editing Settings and Properties of multiple agents/devices
After selecting your desired devices, the “Edit Device details” panel will appear on the right side:
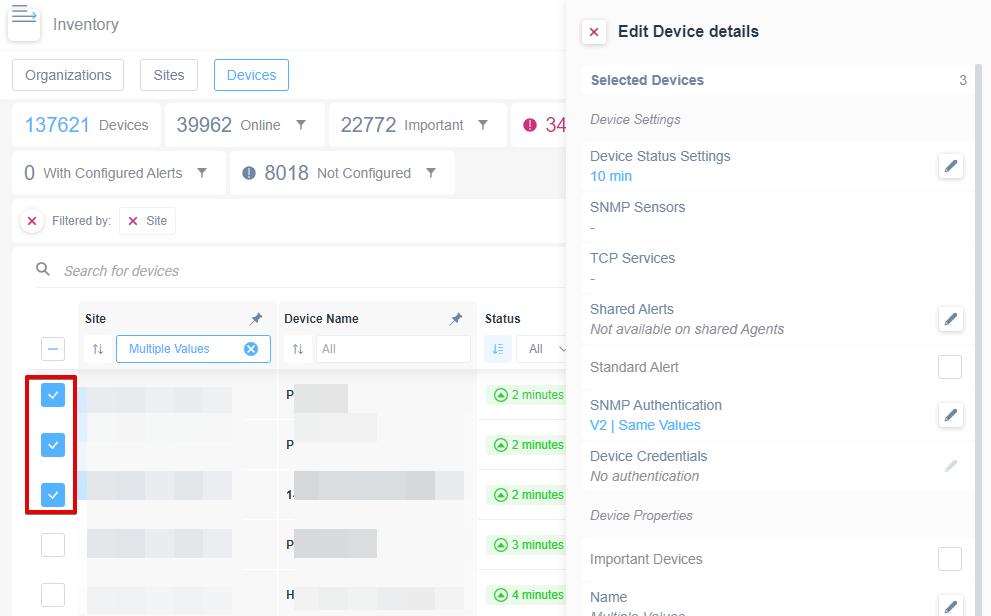
Editing device details in the inventory section.
1. In the inventory section, select the "Devices" tab.
2. Check the boxes next to the devices you want to edit in the list, indicated by blue checkmarks on the left.
3. On the right, under "Edit Device details," review the "Selected Devices" section.
4. Modify settings under "Device Settings," including "Device Status Settings" and "SNMP Authentication." Click the pencil icon to edit specific settings.
5. Confirm any changes and ensure the correct values are applied to the selected devices.
Additionally, from there you’re able to assign a common property/setting on all the selected devices:
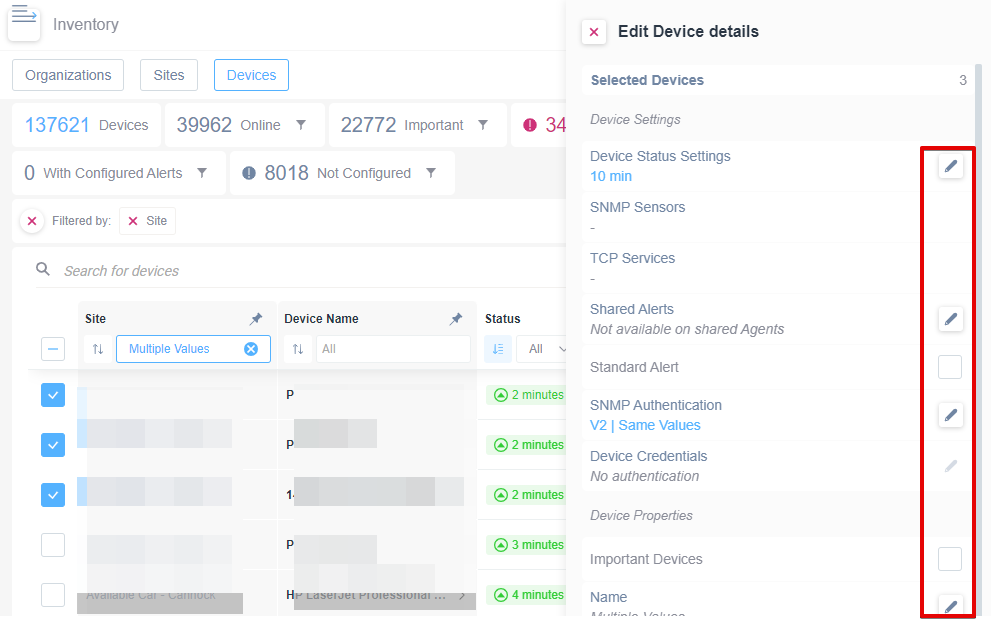
Editing Device Details in the Inventory Interface
1. Navigate to the "Devices" section within the Inventory interface.
2. Use the search bar to find specific devices by filtering through "Site" and "Device Name."
3. Click on the pencil icons next to "Device Status Settings" to adjust the timing, and "Shared Alerts" to modify alert settings.
4. Configure "SNMP Authentication" settings by selecting the pencil icon next to it.
5. Check the "Important Devices" box if the device needs to be marked as important.
6. Review all settings under "Selected Devices" on the right panel to ensure accuracy before finalizing.
Please note that the bulk selection is not available on “Logical Devices also known as Dummy Devices“:
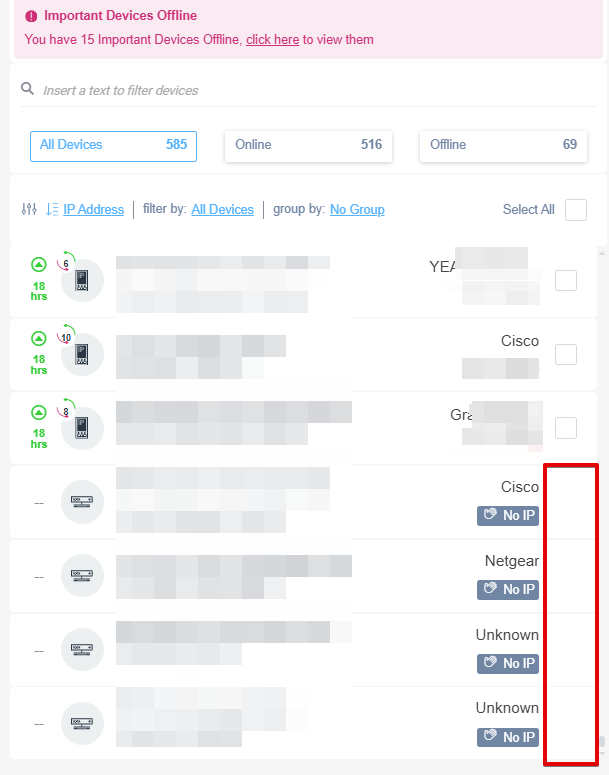
Device Status and Filtering Options Panel
1. At the top, a notification indicates that 15 important devices are offline, with a clickable link to view them.
2. A search bar allows filtering of devices by text input.
3. Three buttons offer filtering options to display devices: "All Devices," "Online," and "Offline." The counts next to each show 585 devices in total, 516 online, and 69 offline.
4. Devices are listed with details including status ("Online" with time, "No IP"), brand names (e.g., Cisco, Netgear), and model images.
5. Checkboxes next to each device allow selection for further action.
In this case checkboxes will not appear since you cannot apply bulk actions on non-ip connected devices.
Export/Import Device Settings and Properties
The Inventory view is also really useful when you have defined a set of custom SNMP sensors or Shared Alerts and you want to apply them to many other similar devices.
Moreover, to do this you have to search for the device that you want to export your settings from, select it, and click on the Export Device Settings and Properties link:
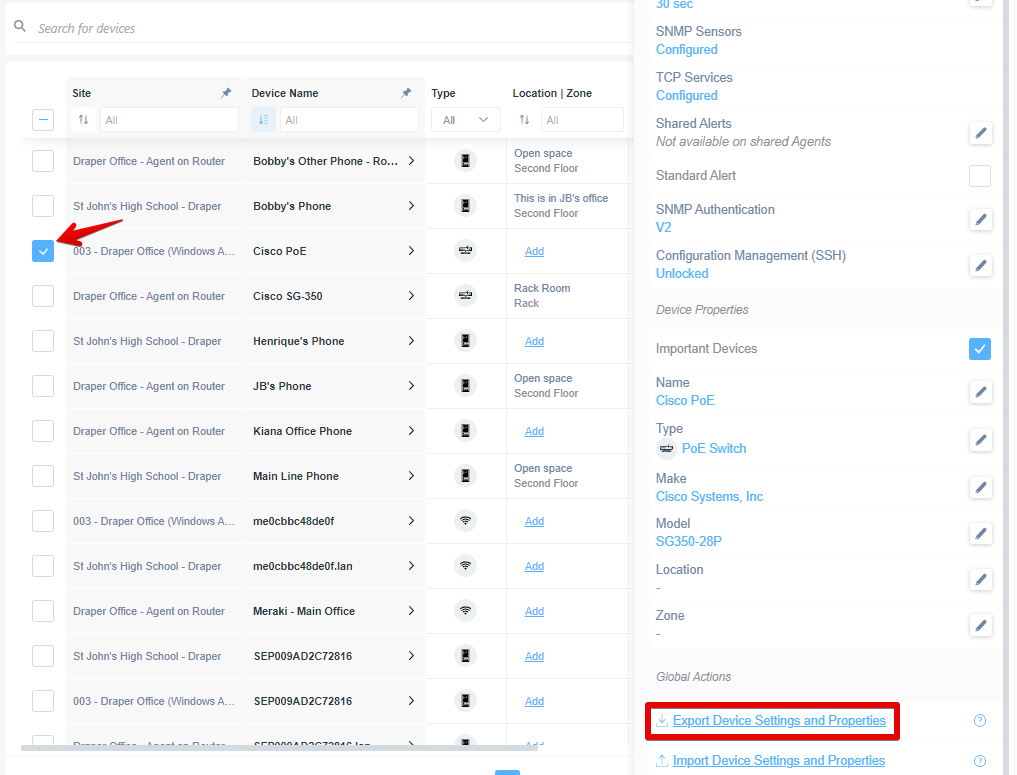
Export Device Settings and Properties
1. In the device list, locate and check the box next to "003 - Draper Office (Windows Agent)" to select it.
2. On the right panel, under "Device Properties," verify that "Important Devices" is checked.
3. Scroll to the bottom of the right panel to find "Global Actions."
4. Click on "Export Device Settings and Properties" to download the settings for the selected device.
This will save a JSON file on your computer.
Afterwards, search for the devices that you want to import those “properties” to, select them, and click on the Import Device Settings and Properties button:
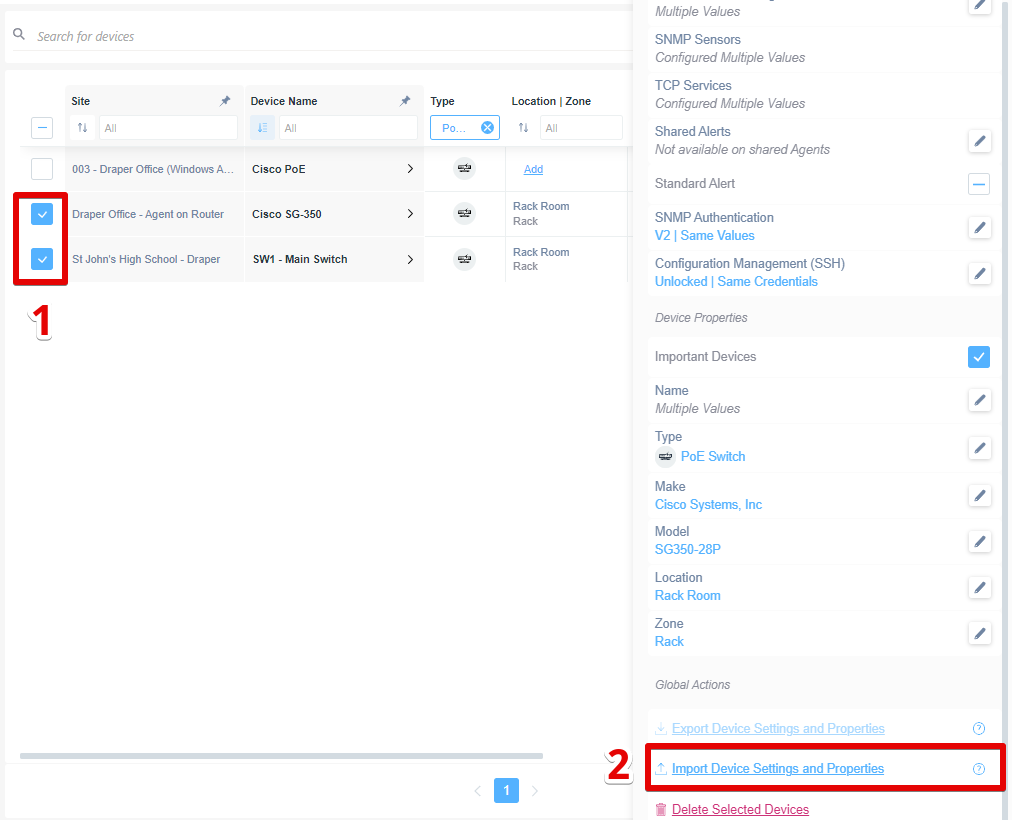
Import Device Settings and Properties in a Network Management Interface
1. In the device list on the left, select the checkboxes next to "Draper Office - Agent on Router" and "St John's High School - Draper" to mark these devices.
2. On the panel to the right, under "Global Actions," click on "Import Device Settings and Properties" to initiate importing settings for the selected devices.
See/Add Shared Alerts
You can now easily see any shared alerts that are applied to a device. You can also easily add new shared alters by clicking the “Add” link:
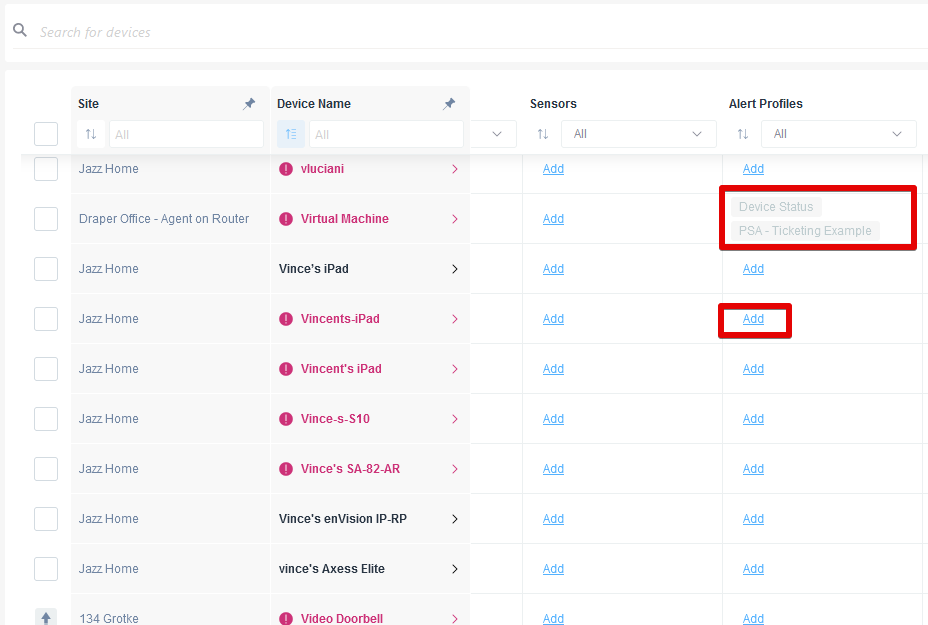
Managing Alert Profiles for Devices
1. The interface displays a table with columns for Site, Device Name, Sensors, and Alert Profiles.
2. Under the Alert Profiles column, locate the "Add" link next to the desired device. Clicking "Add" will open options for assigning alert profiles.
3. Select the desired alert profiles from the available options, such as "Device Status" or "PSA - Ticketing Example," to apply them to the selected device.
A side panel will appear on the right side where you can manage the device’s alerts:
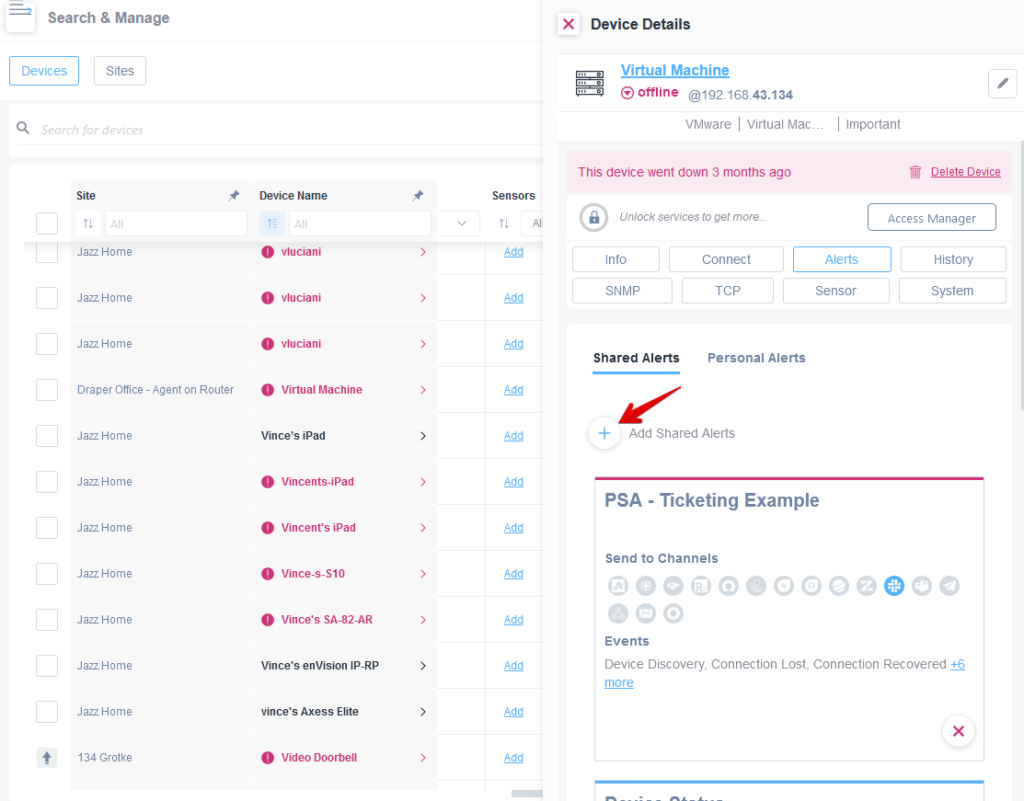
Managing Device Details and Alerts
1. In the "Search & Manage" section, select "Devices" to view a list of devices and their details categorized by "Site" and "Device Name."
2. Locate and click on "Virtual Machine" under "Device Name" to view its details.
3. In the "Device Details" panel on the right, verify that the device is offline and note the provided IP address.
4. Use the available tabs such as "Info," "Connect," "Alerts," and others to manage different aspects of the device.
5. In the "Shared Alerts" section, add alerts by selecting "Add Shared Alerts" to configure notifications or actions related to the device.
6. Review the "PSA - Ticketing Example" for channels and events to send alerts, and manage settings accordingly.
Additionally, you can search for all the Important Devices within specific Customer Sites that have a specific alert profile attached to them. Contrastingly, you can also search for those that haven’t been configured with a Shared Alert yet.
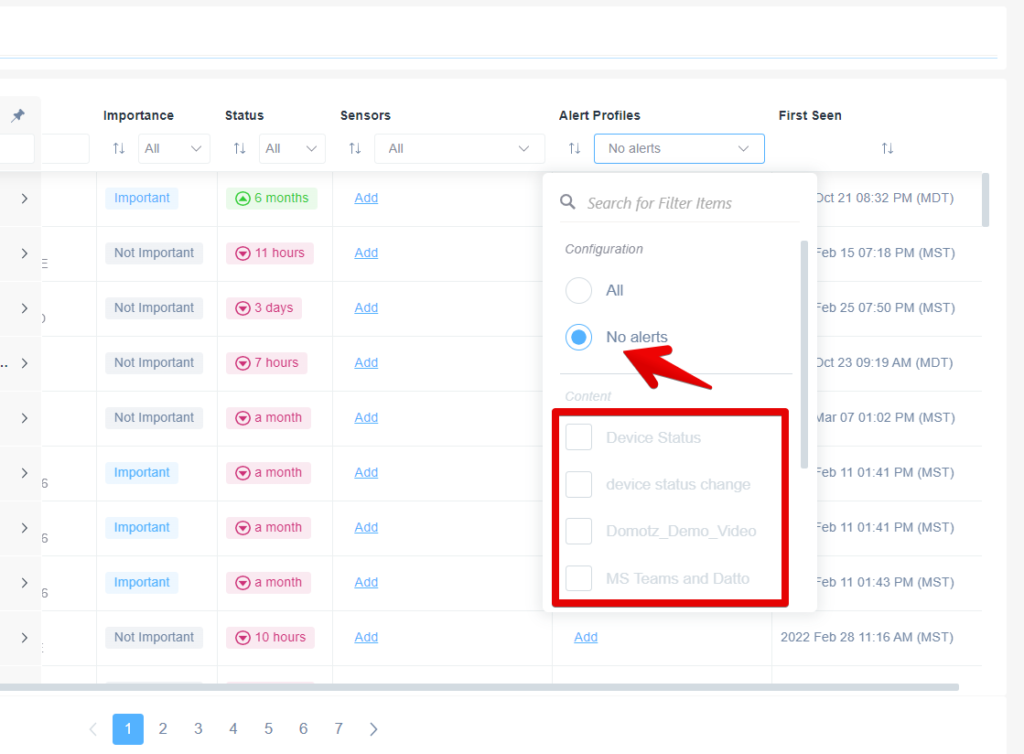
Setting Alert Profiles in a Monitoring Dashboard
1. Locate the "Alert Profiles" dropdown menu in the top section of the dashboard table.
2. Click on the dropdown to view available options.
3. Select "No alerts" to disable alerts for the items listed.
4. Confirm the configuration setting is "No alerts" under the Configuration section.
5. Note that all content types under Content are unchecked and disabled since "No alerts" is selected.
6. Use the table to review additional details such as Importance, Status, Sensors, and the date and time the item was first seen.
Add Shared Alert Profiles to multiple devices
You can assign also the Shared alerts in bulk. To do this please search and select the desired devices and then click on the Shared Alerts menu entry:
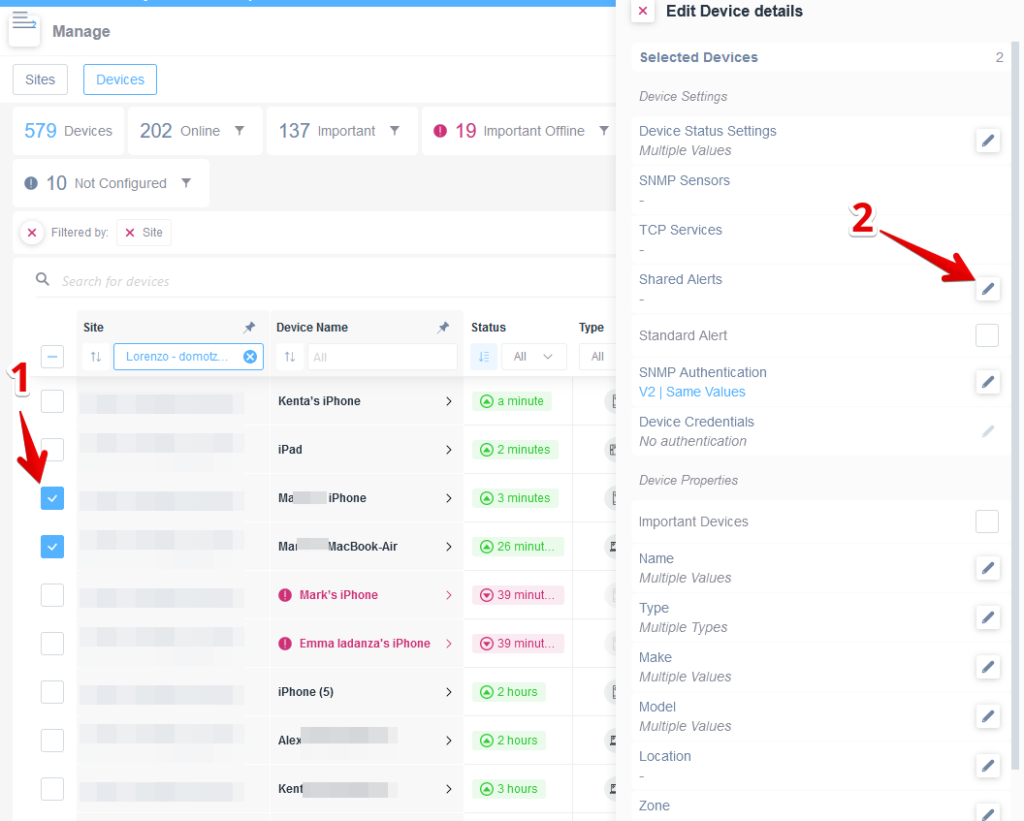
Managing Device Settings and Alerts in the Dashboard
1. To select a device, click the checkbox next to the device name in the list under the "Devices" tab. This will highlight the device and enable further actions.
2. In the "Edit Device Details" panel on the right, locate the "Shared Alerts" section. Click the pencil icon next to "Shared Alerts" to modify alert settings for the selected devices.
See/Add Sensors and/or Drivers
(Pre-configured and Custom SNMP sensors, TCP sensors, Custom Integrations Drivers)
You can search for devices that have sensors configured for further analysis:
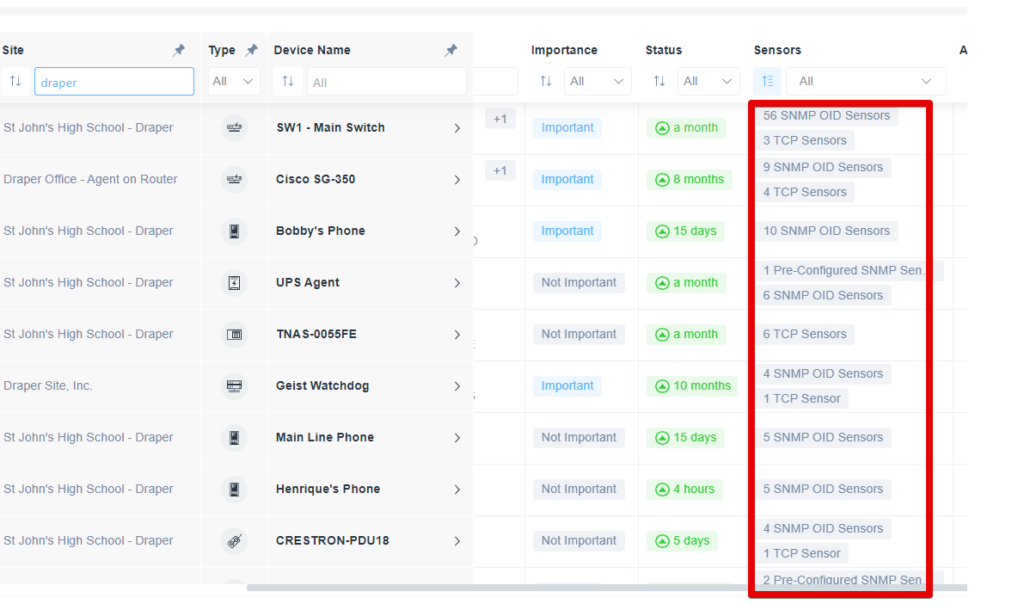
Device Management Table with Sensor Details
1. **Filter by Site and Device**: Use the search or dropdown options to filter devices by site name, such as 'St John's High School - Draper' or 'Draper Site, Inc.', and by device type.
2. **Device List**: Displays various devices like 'SW1 - Main Switch', 'Cisco SG-350', and 'UPS Agent'. Each device is listed under its respective site.
3. **Importance and Status**: Shows the importance level of each device, categorized as 'Important' or 'Not Important'. The status specifies the duration, such as 'a month', '15 days', or '8 months'.
4. **Sensor Information**: The 'Sensors' column lists the types and numbers of sensors for each device. Entries include '56 SNMP OID Sensors', '3 TCP Sensors', or '1 Pre-Configured SNMP Sensor'. Adjust settings or check configurations based on these details.
Alternatively, you can add sensors directly to a device by using the “Add” link.
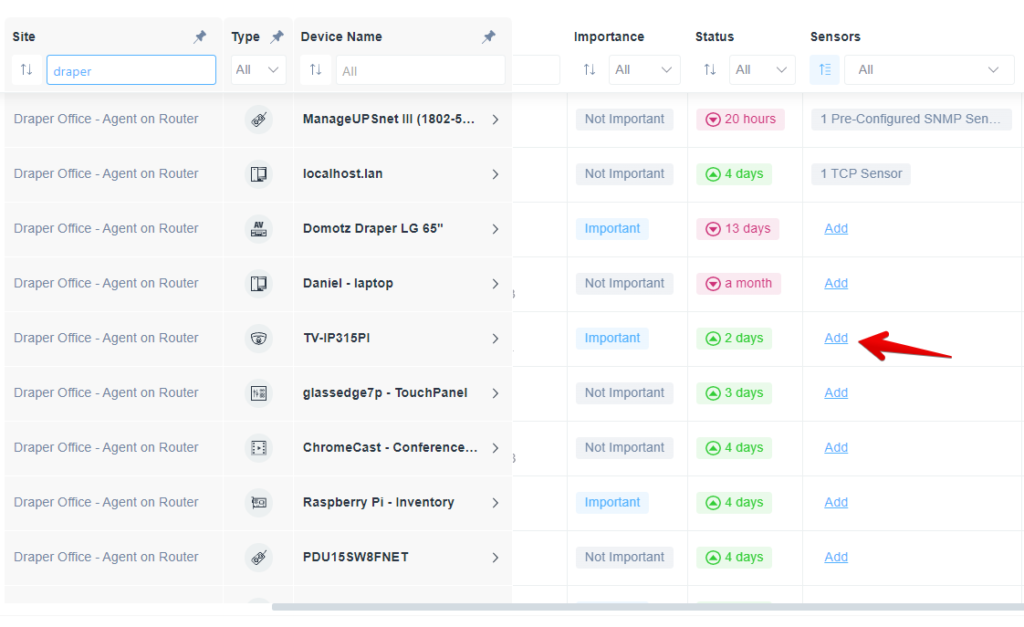
Device Management Dashboard Overview
1. Use the search bar under "Site" to filter by location, such as "Draper."
2. The "Type" and "Device Name" columns allow further filtering or sorting of devices.
3. Check the "Importance" column to see device priority levels, labeled as "Important" or "Not Important."
4. The "Status" column indicates the time since the last update, displayed in hours or days.
5. In the "Sensors" column, click "Add" to configure or manage sensors for each device.
A side panel will appear on the right side allowing you to add sensors to the device:
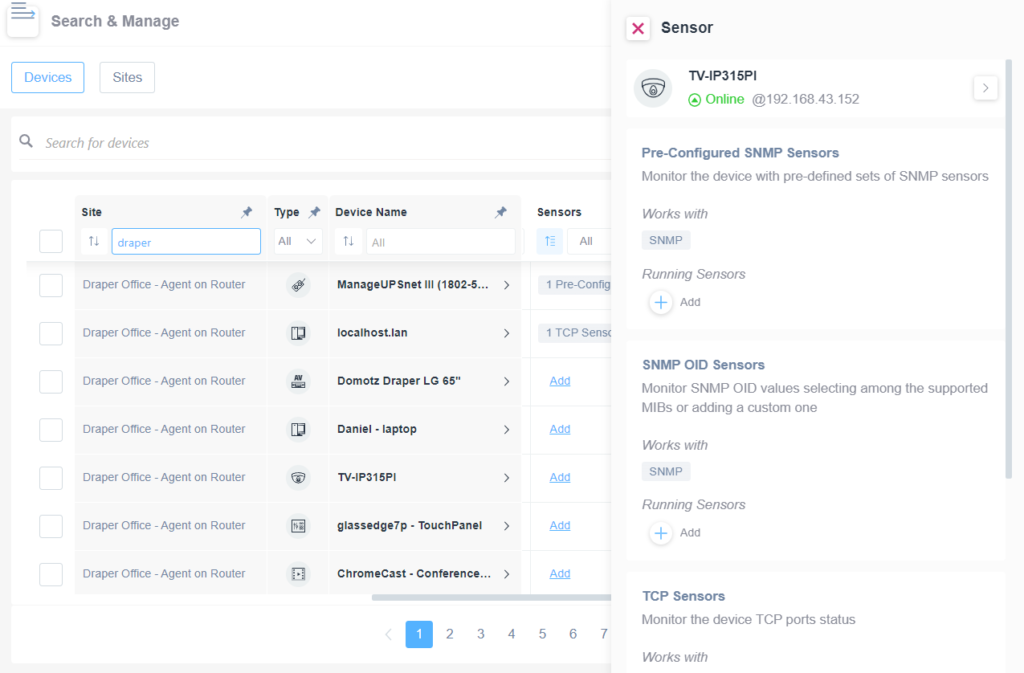
Search and manage devices in a network interface.
1. Use the "Search & Manage" feature to locate devices by entering a keyword in the search bar, for example, "draper."
2. Filter devices by the "Site" column with "Draper Office - Agent on Router."
3. Browse device types and names in the list, such as “ManageUP Snet III” or “Domotz Draper LG 65".”
4. Click on a device name, like "TV-IP315PI," to view its sensor details.
5. In the sensor details panel, view the device status, such as "Online" at a specific IP address.
6. Explore available sensor monitoring options like "Pre-Configured SNMP Sensors," "SNMP OID Sensors," and "TCP Sensors" to manage device performance.
7. Use the "Add" button under "Running Sensors" to configure new sensors if necessary.
Devices with additional capabilities (Insights column)
Firstly, the Insights column indicates whether your individual devices support special configurations (e.g. OS Monitoring, SNMP Management, ONVIF Monitoring or Network Configuration Management, Device Management Overview). Please note, to set-up these configurations the Domotz system requires additional credentials.
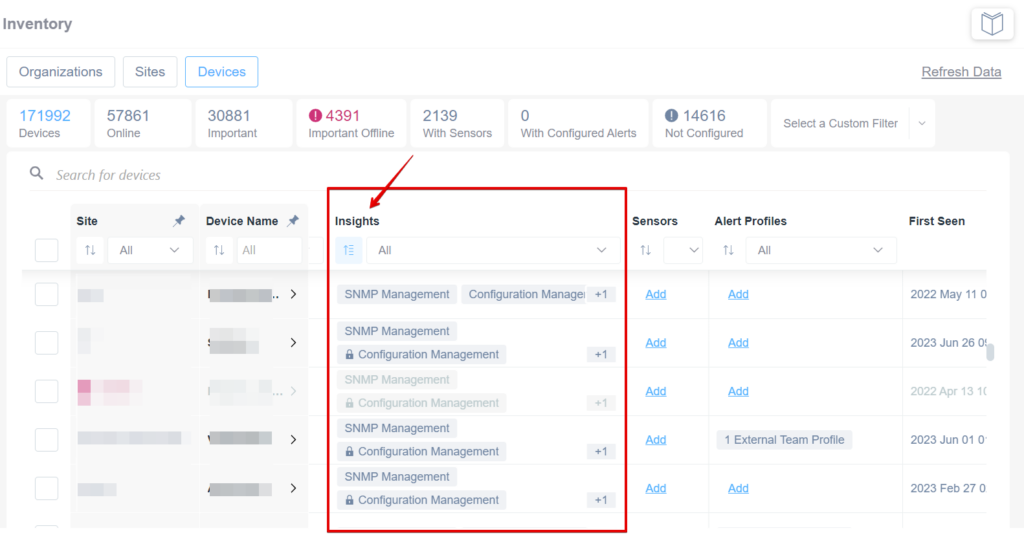
Viewing Insights and Device Information in the Inventory Panel
1. Navigate to the "Devices" tab within the Inventory section of the software interface.
2. View the device statistics displayed at the top, including total devices, online and offline status, and important metrics.
3. Use the search bar to find specific devices by name or site.
4. In the "Insights" column, review information such as "SNMP Management" and "Configuration Management" for each device.
5. To configure sensors or alert profiles, click the "Add" link in the respective columns.
6. Check the "First Seen" column for the date when each device was first detected.
This column enables you to proactively review all the devices which can be unlocked for additional capabilities so you can quickly identify them.
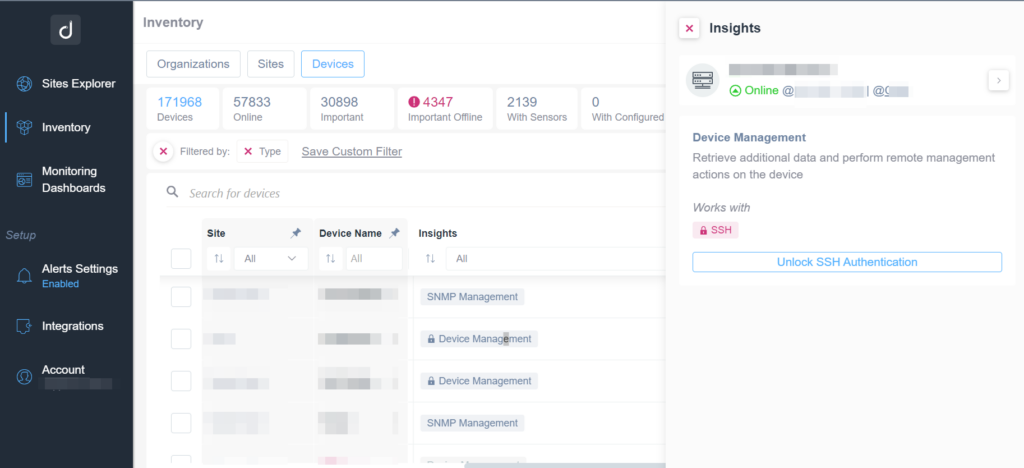
Device Management in Inventory System.
1. Navigate to the "Inventory" section in the sidebar.
2. Select the "Devices" tab at the top.
3. Review device statistics showing total, online, important, offline, and sensor-configured devices.
4. Use the filter options to search for specific devices by site or name.
5. In the "Insights" panel on the right, see device details like status and management options.
6. For advanced actions, click "Unlock SSH Authentication" to manage via SSH.
Ultimately, it gives you an easy to use filter for finding features on devices that are available but that you’re not yet using.
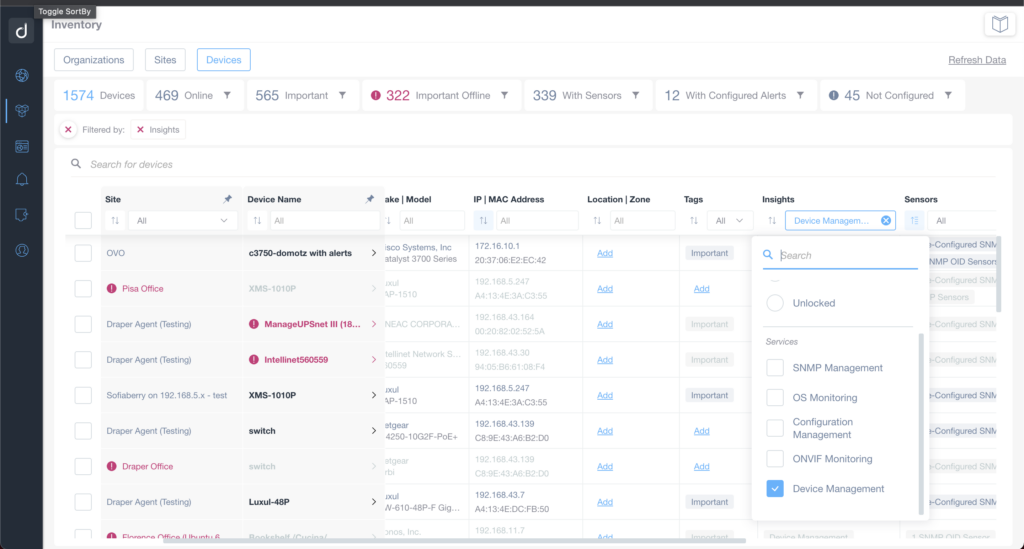
Device Management Interface Overview
1. Navigate to the "Devices" tab to view device details and statistics, including the total number of devices, online and important devices, devices with sensors, configured alerts, and not configured devices.
2. Use the "Filtered by" section to apply filters, ensuring only relevant devices are displayed.
3. Utilize the search bar to find specific devices by name or other identifiers.
4. In the device list, review columns for Site, Device Name, Make, Model, IP Address, Location, Zone, Tags, Insights, and Sensors.
5. For "Insights," select from options like "Device Management" to apply specific service filters.
6. To modify services, click on the dropdown menu in the "Insights" column, and select or deselect services such as "SNMP Management" and "OS Monitoring."
Additionally, by clicking the capability highlighted (for example “Configuration Management”) you will be able to enable the feature directly on the device:
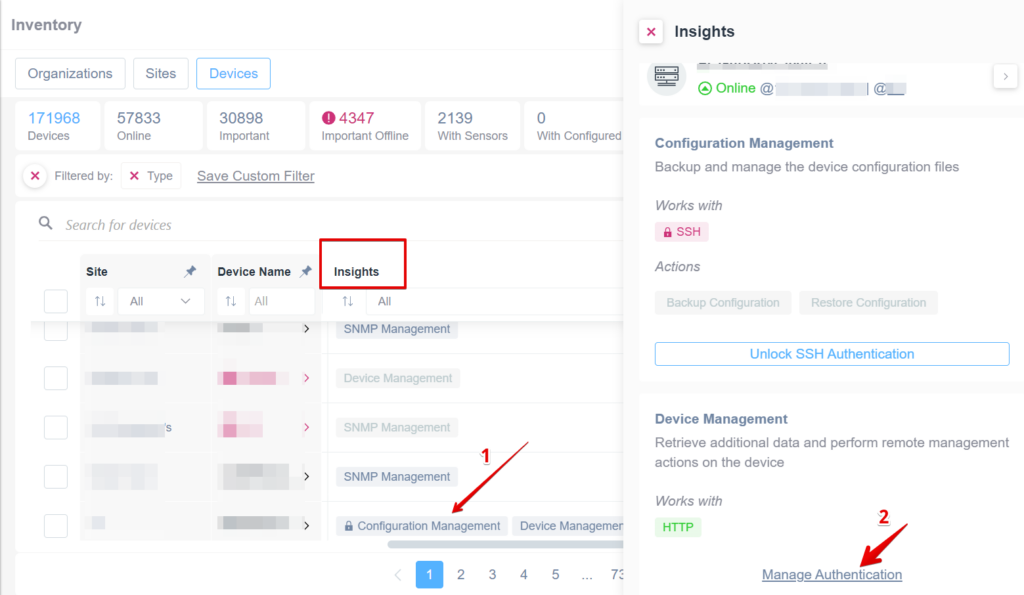
Managing Device Configuration and Authentication in Inventory
1. In the Inventory interface, navigate to the "Devices" tab. Locate the "Insights" column and select "Configuration Management" for the desired device. This allows you to backup and manage device configuration files.
2. In the "Insights" panel, under "Device Management," select "Manage Authentication." This option enables additional data retrieval and remote management actions using HTTP.
Actions
For each device, there is also a quick “Action” button in the last column (Actions) which provides quick access to all the Action capabilities offered for that specific device:
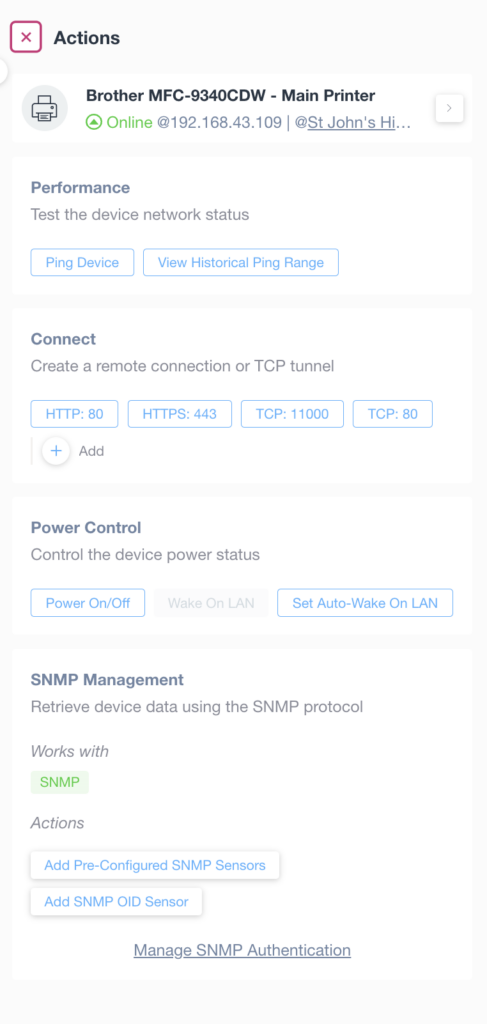
Actions menu for managing a Brother MFC-9340CDW printer.
1. Check device network status:
- Use "Ping Device" to test connectivity.
- Select "View Historical Ping Range" for past network performance.
2. Create remote connections or TCP tunnels:
- Choose between HTTP, HTTPS, or TCP options (80, 443, 11000).
- Use the "+ Add" option for additional configurations.
3. Control device power status:
- "Power On/Off" to turn the device on or off.
- "Wake On LAN" to remotely wake the device.
- "Set Auto-Wake On LAN" for automatic waking settings.
4. SNMP Management for retrieving device data:
- Works with SNMP protocol.
- "Add Pre-Configured SNMP Sensors" or "Add SNMP OID Sensor" for sensor management.
- "Manage SNMP Authentication" for security settings.
Custom Filters
To see how to create custom filters inside the Inventory dashboard for both Sites and Devices sections please see here.