We have exciting new features and integrations available on Domotz. This month’s exciting new updates include a new library of integration scripts accessible from the Domotz App and WebApp, a new HP iLO SNMP template, guided Windows Agent activation, and more.
In summary, here’s what’s new on Domotz this month.
- Integration Scripts Library
- HP iLO Pre-Configured SNMP templates
- New Custom Scripts
- Guided Windows Agent activation
- Uptime Accuracy
- Improved loading of high-density charts
- Serial Numbers available in the Public API
- Routed Networks and External Host configuration via Public API
- Additional MIBs available in the Domotz Database
- Improved and Intuitive Header Filters
We are continually improving the Domotz experience and value your feedback. You can always contact our support team at support@domotz.com if you need help or have suggestions for further enhancements.
What’s new
Integration Scripts Library
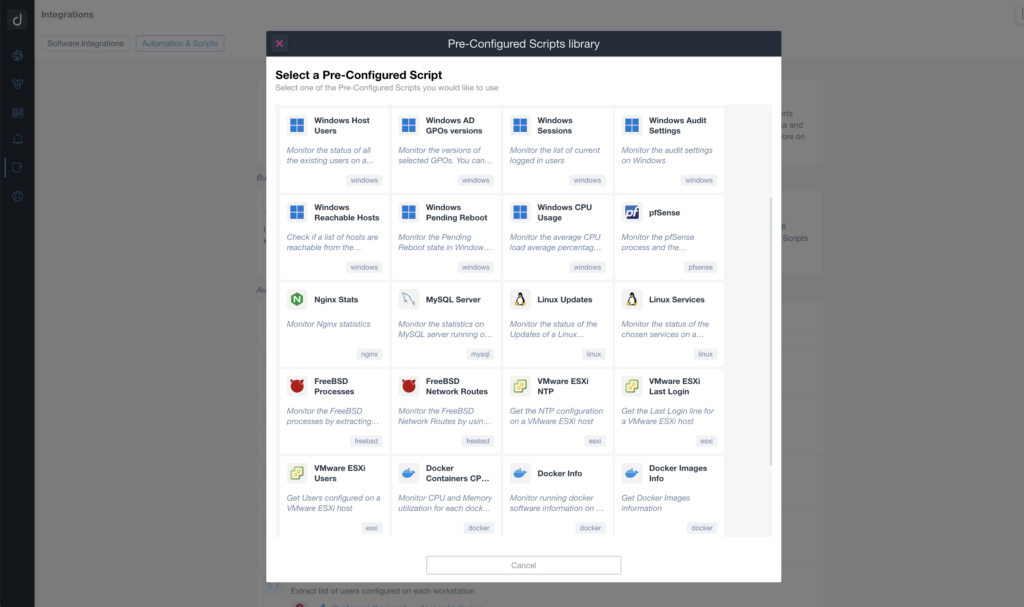
We are thrilled to introduce our new “Integration Scripts Library.” This new feature allows you to monitor and manage devices, software applications, and cloud services.
Over the past few months, we have been busy creating many new integrations Scripts, to enhance your monitoring capabilities.
The Domotz Integration Scripts Library is a centralized repository of all our available scripts. You can effortlessly search for specific scripts for your unique scenarios and requirements. The library is still growing and covers a wide range of devices, software applications, and cloud monitoring scripts, such as:
- Microsoft Windows and Linux system monitoring scripts
- pfSense and FreeBSD server monitoring scripts
- AWS (Amazon Web Services) monitoring scripts
- Web server monitoring scripts for Apache and Nginx
- DevOps tools monitoring scripts for Docker and Kubernetes
- Crestron DM-NVX and Crestron Touch Screens
- And much more!
Easily select and apply your desired script to multiple devices across different Domotz Agents.
You can expect regular updates to the library, including new scripts and frameworks to meet your evolving monitoring needs.
Take advantage of the Integration Scripts Library to unlock the full potential of Domotz’s monitoring capabilities. Seamlessly integrate our scripts with your existing infrastructure and gain deeper insights into your network environment.
For more information about accessing the Integration Scripts library, visit our Custom Integration Scripts and Drivers help page.
HP iLO Pre-Configured SNMP templates
We now have pre-configured SNMP sensors for HP Enterprise Integrated Lights-Out (HPE iLO). We also have new sets of pre-configured SNMP templates for the iDRAC server:
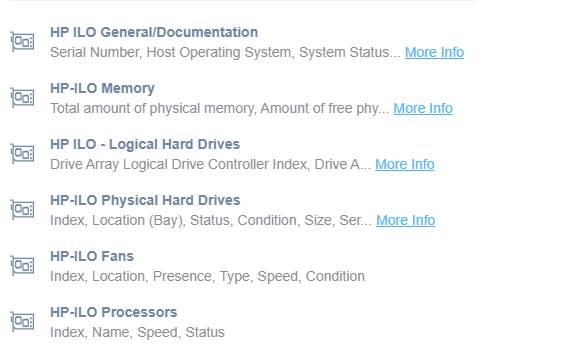
You can use this new template to monitor every HP iLO embedded server management technology. Moreover, for servers, you can automatically extract multiple types of information:
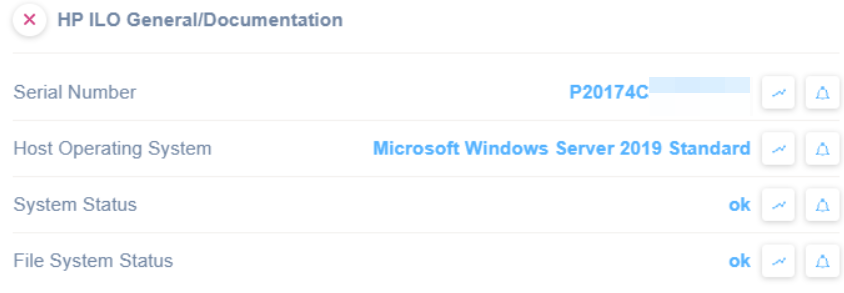
- General Information about the status of the server (Serial Number, Host Operating System, System Status, File System Status)
- Memory
- Logical Hard Drives
- Physical Hard Drives
- Fan
- Processors
Use our new pre-configured tables (or list of variables) to monitor your HP iLO servers across multiple sites. Moreover, you can create monitoring tables using the data from this functionality.
You can see an example of General Information you can extract from the HP iLO through this new SNMP Pre-configured template:
You will be able to extract additional information based on the different available templates:
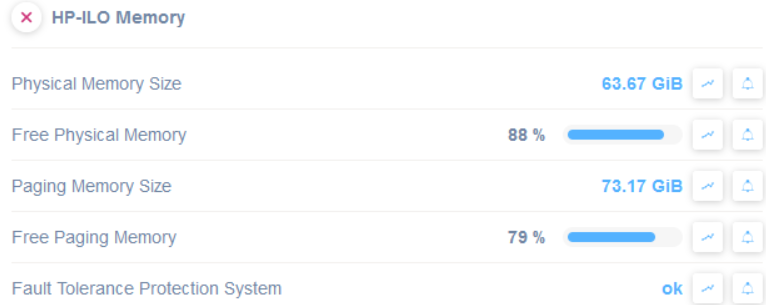
Memory
- Physical Memory Size
- Free Physical Memory
- Paging Memory Size
- Free Paging Memory
- Fault Tolerance Protection System
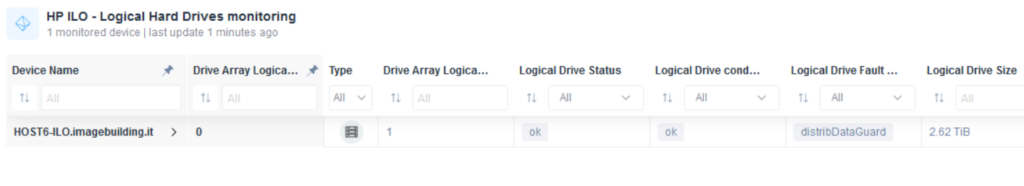
Logical Hard Drives
- Drive Array Logical Drive Controller Index
- Drive Array Logical Drive Index
- Logical Drive Status
- Logical Drive condition
- Logical Drive Fault Tolerance
- Logical Drive Size
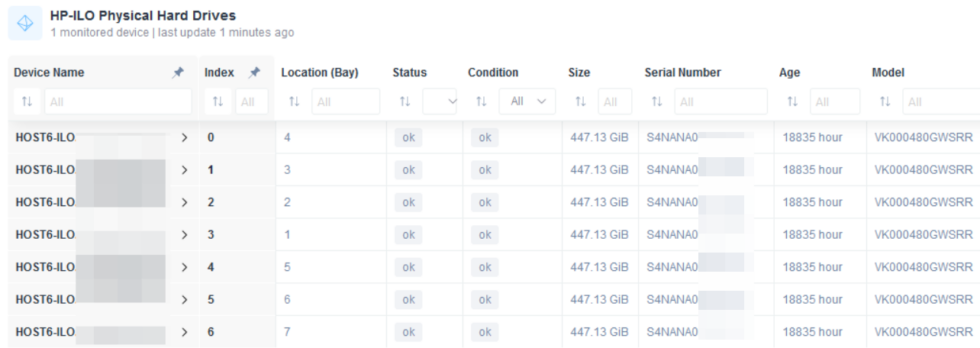
Physical Hard Drives
- index
- Location (bay)
- Status
- Condition
- Size
- Serial Number
- Age
- Model
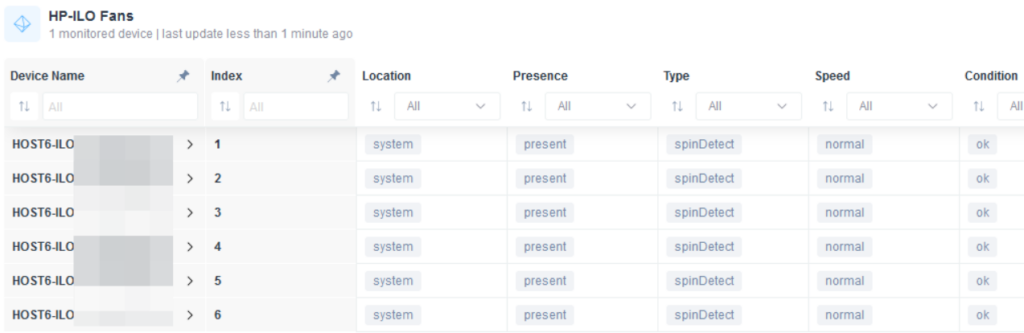
Fans
- Index
- Location
- Presence
- Type
- Speed
- Condition
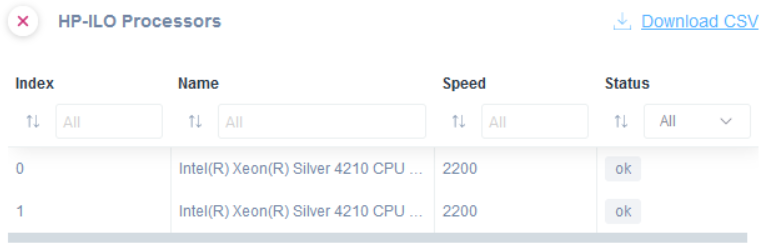
Processors
- Index
- Name
- Speed
- Status
Finally, this new feature allows you to set alerts on the status of each HP iLO parameter you extract.
Learn more about Pre-Configured HP iLO SNMP templates, in the article.
New Custom Scripts
Use the pre-configured scripts to monitor and manage network-connected devices, cloud services, and web applications. By using standard network protocols, these scripts will allow you to retrieve valuable data and execute actions on the monitored devices and services.
This month we released the following:
Windows Audit Settings
You can monitor Windows Audit Settings using the custom script described on this page. Windows’s security audit policy settings provide broad security audit capabilities for client devices and servers. The scripts use the WinRM protocol to access the Windows endpoint.
The script has been validated and tested on Windows 10 and Windows Server 2019 with PowerShell version 5.1.19041.2364.
You may find this script here: windows_audit_settings.js

You can customize the script to fit your needs. By leveraging PowerShell commands, the Windows Audit Settings script enables Domotz users to monitor the following:
- System (Security System Extension)
- Logon/Logoff (Logon)
- DS Access (Directory Service Replication)
- Object Access (SAM)
- Policy Change (Audit Policy Change)
- Policy Change (Authentication Policy Change)
- Policy Change (MPSSVC Rule-Level Policy Change)
- Account Management (Computer Account Management)
- Account Management (Security Group Management)
- Account Management (User Account Management)
- Ds Access (Directory Service Changes)
The script code can also be found in the Domotz Script Library inside the Domotz App.
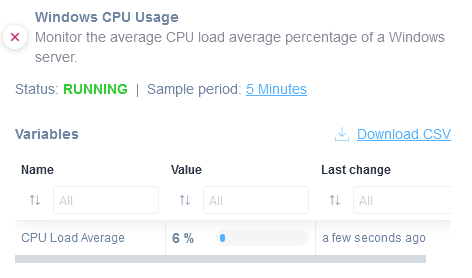
Windows CPU Usage
Proactively monitor Windows CPU usage that has been used for processing data and running programs.
The script uses the WinRM protocol to access the Windows OS, and has been validated and tested on Windows 10 and Windows Server 2019 with PowerShell version 5.1.19041.2364.
You may find this script here: windows_cpu_usage.js
The script code can also be found in the Domotz Script Library inside the Domotz App.
Microsoft Windows Current Sessions
You can leverage this dedicated script, which uses PowerShell commands (Start-Process) to retrieve the information about Windows current sessions (currently logged-in users).
The script has been validated and tested on Windows Server 2019 with PowerShell version 5.1.19041.2364.
You may find this script here: windows_current_sessions.js
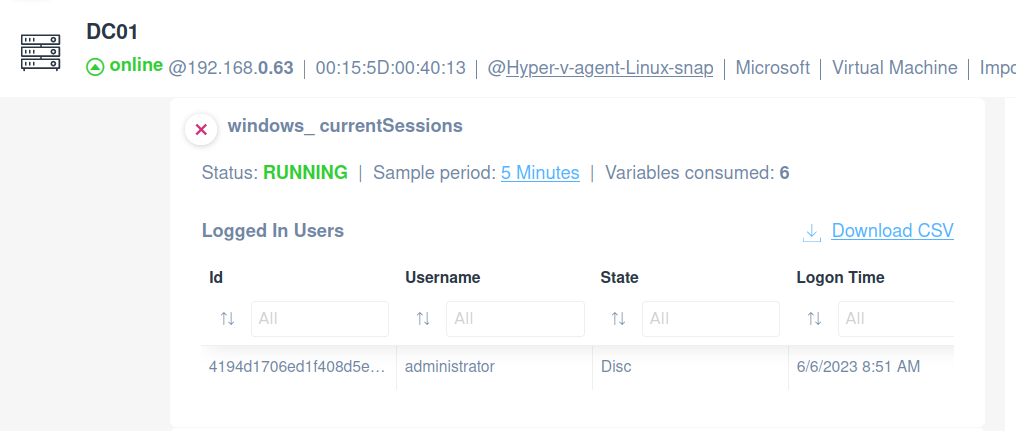
Specifically, with this script, you will be able to:
- Monitor the logged-in users on Microsoft Windows
- Monitor the state of your currently connected Windows Sessions
- See when each user logged in and performed the login
The script code can also be found in the Domotz Script Library inside the Domotz App.
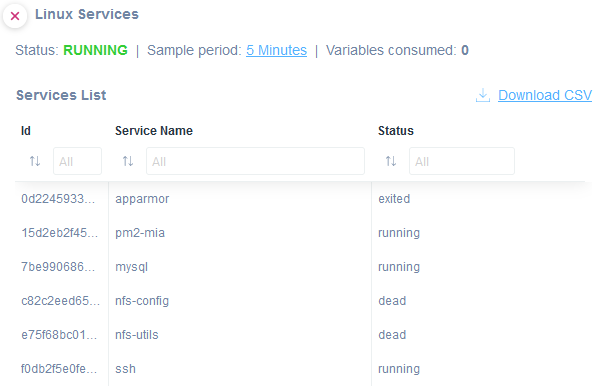
Linux Services
Proactively monitor Linux services status by using the Domotz Linux Services script.
This script uses the bash command (systemctl) to retrieve information about the services you want to monitor.
It has been validated and tested on Debian Linux 10 and Ubuntu 22.04.
You may find the script here: linux_services.js
The script code can also be found in the Domotz Script Library inside the Domotz App.
Improvements
Guided Windows Agent activation
Our new release makes activating the Domotz Windows Agent easier and faster.
You can now download the Domotz Windows Agent directly from the Domotz Portal or the WebApp. The installer includes a personalized hook that links the installation to the account owner initiating the download.
As a result, the user who starts the download will receive a notification in the Domotz Portal (or the WebApp) about completing the installation of the Domotz Agent.
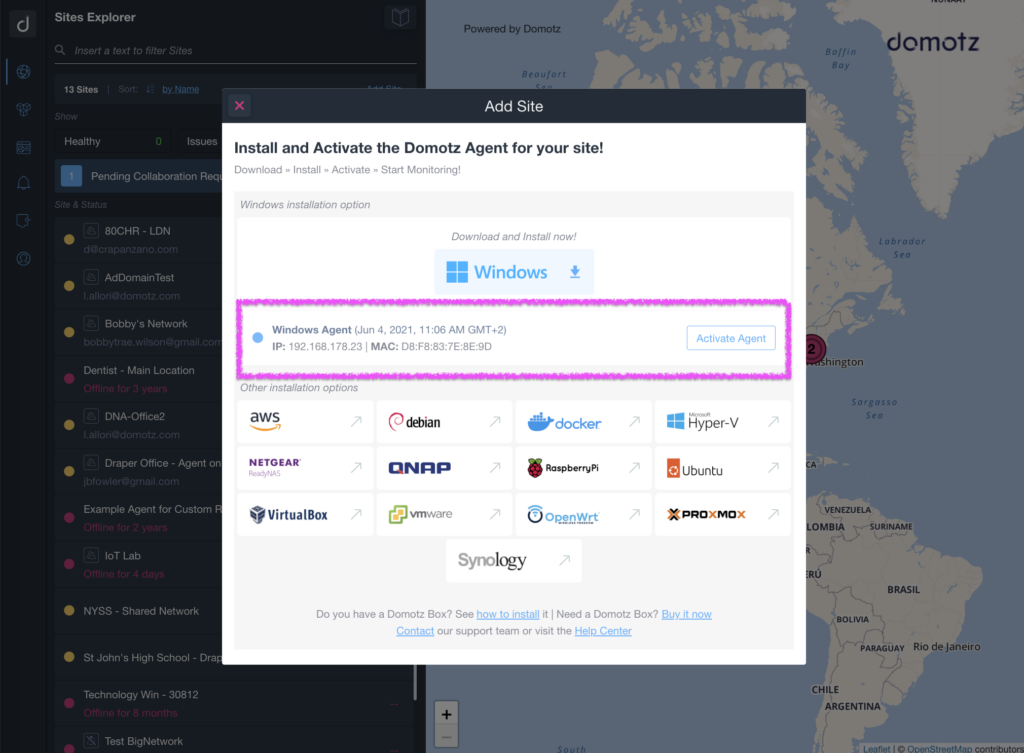
To complete the installation, click on the direct link provided by the Portal. This will take you (or the user who downloaded it) to the Domotz Agent page for activation. In this way, you’ll remember to complete the activation of any Domotz Agent installed.
Read more about Installing and Configuring your Domotz Agent, in our help article.
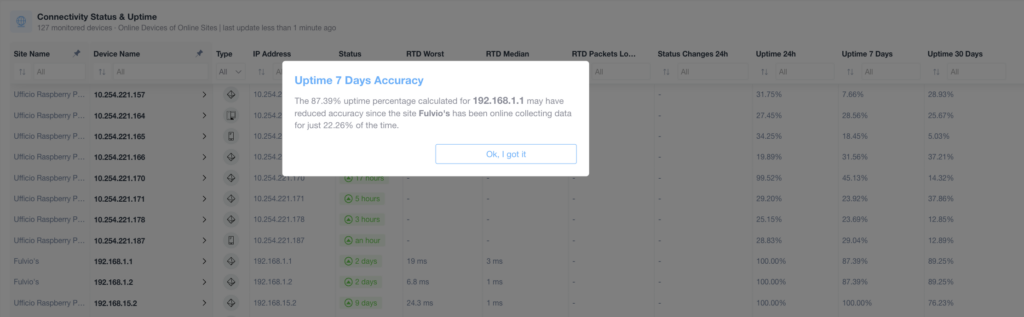
Uptime Accuracy
The Monitoring Dashboards and Tables now display the accuracy of the uptime values for each device:
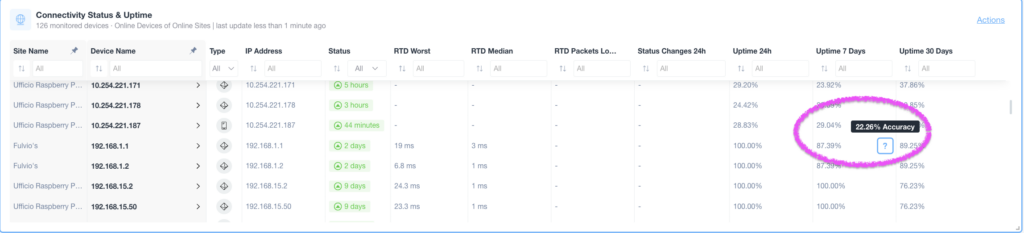
The “Uptime Values” for the last 24 hours, the previous seven days, and the last 30 days indicate the accuracy based on the data available for those devices. For instance, if the Agent went offline in the previous hours (or days), the device’s uptime information may be less reliable.
This information is available in the downloadable CSV file from the Monitoring Tables.
Improved loading of high-density charts
This month we released an additional improvement to the loading speed of high-density charts. For example, loading charts with many samples, such as graphs displaying 1-month history values, has been significantly enhanced.
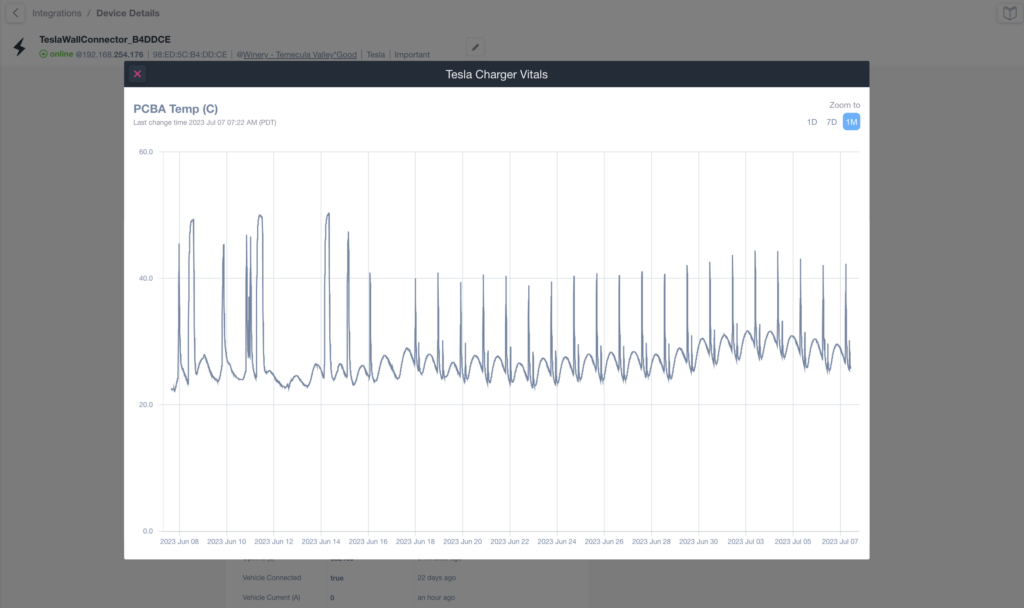
With this improvement, you get faster loading times and smoother navigation when accessing charts with extensive data sets. Whether you are analyzing long-term trends or examining detailed historical data, the improvements to the loading speeds offer a more efficient and seamless experience.
We are continuously optimizing the performance and usability of Domotz. Don’t hesitate to contact us any time on support@domotz.com with your feedback and suggestions.
Serial Number Available in the Public API
We are excited to announce an enhancement to the Public API of Domotz. We have enriched the data returned by the getDevice endpoint to include the Serial Numbers of devices.
From this release, when you retrieve device information through the Public API, you can access data (such as firmware version, room, zone, and other device details) and the Serial Number. This information comes from various data sources, including SNMP, UPnP, SSH/WinRM, and Bonjour.
This additional information gives you more comprehensive data for inventory management and troubleshooting.
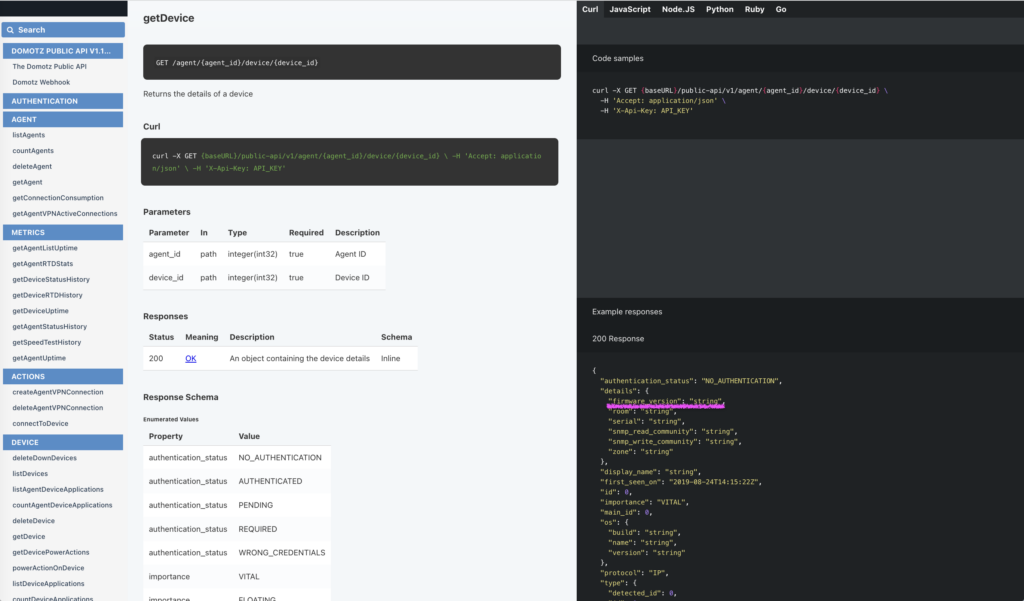
To leverage this improvement, use the getDevice endpoint in the Public API to retrieve device information. You will then get the Serial Number included along with your other device data.
Routed Networks and External Host Configuration via Public API
Thanks to an additional improvement to the Domotz Public API, you can now configure the private subnet (Routed Networks) and External Hosts programmatically via the API.
- agent/id/device/external-host (POST)
- agent/id/routed-network (POST)
With this improvement, you can programmatically configure Routed Networks and External Hosts through the Domotz UI via the Public API. This means that network configuration tasks are more scalable and automatic.
Use the Public API to dynamically manage and update Routed Networks and External Hosts, for a seamless integration with your existing systems and processes. Streamline and scale your network configuring and save more time.
To use this improvement, refer to the Public API documentation to access the endpoints and parameters necessary to configure Routed Networks and External Hosts programmatically.
Additional MIBs available in the Domotz Database
Additional MIB files are available for the following devices.
- Voltserver
- 2N Intercoms
- OpenBSD
- Axesselite
Additionally, you can search for their OIDs from Domotz.
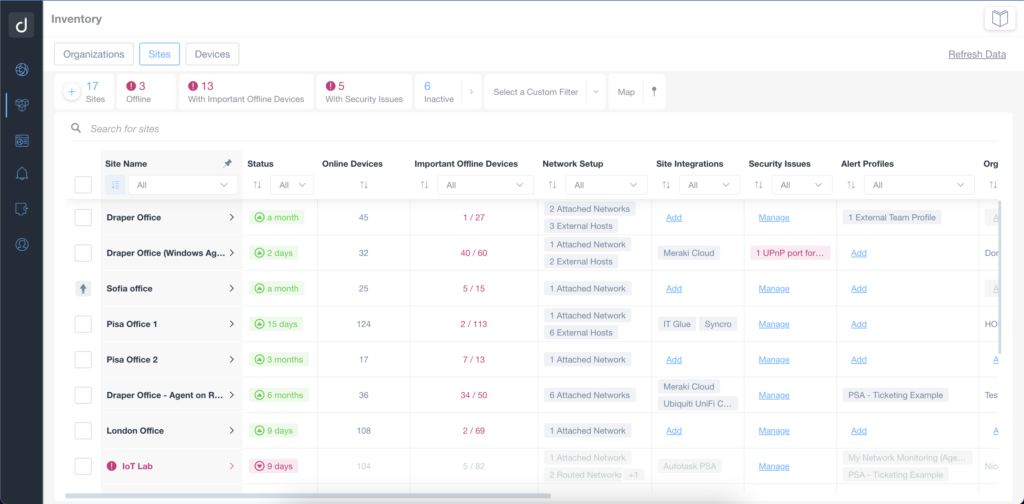
Improved and Intuitive Header Filters
Get a clearer view of any active filters. Your inventory is critical for properly monitoring and managing all monitored devices. For this reason, we decided to give greater visibility to all the information collected in this section. More space for your Organization, Site, and Device tables!
Browse your inventory dashboard faster using custom filters. Selecting one or more custom filters lets you easily see which ones have active status.
In addition, the number of devices matching the selected and desired filters are also shown.
Fix
We’ve fixed the following issues:
- An email notification will inform you if there is a problem with the Meraki/Ubiquiti integration,
- You can now copy the Public API endpoint from the Portal.
- The demo version is now available.
- Cisco Meraki API Key: integration with the Cisco Meraki cloud was failing in some circumstances.
- Custom Filter on the Inventory Tab and using “Type” as a field is now working as expected.
- Inconsistency on the reported uptime values for the uptime.
- “Free Trial has Expired” banner message when accessing WebApp using Field Operator Accounts.
- Monthly PDF report with wrong uptime values.
- Due to a performance issue, topology could not be generated on Agents with a long list of devices.
- The “Forgot Password” Link on the Portal Login page was not working.
- TCP Status Alert misses to report the timestamp.
- Actions (e.g., Terminate Apps on Sony TV) were not correctly reported in the monthly PDF report.
Known limitations
- There is no central repository for all the alerts configured on SNMP PreConfigured, OS Monitoring, and Custom Integration script sensors.
- Monitoring Dashboards are currently limited to Monitoring Tables as Widgets.
- Luxul Router-based Agents do not support VPN on demand. To elaborate, we’ll add this capability as soon as Luxul’s team provides us with the required API.
- You can’t configure the static IP address on the Domotz Box before configuring the Agent.
- Lastly, you can’t leverage DHCP on additional VLANs on the Domotz Box.
These release notes cover the changes, including Domotz Pro Cloud, Domotz Agent, and Domotz Pro App. Learn more about our software on our website or read our blog to stay updated with modern network and IT Infrastructure monitoring and management.