We have exciting new features and integrations available on Domotz. This month’s updates include dynamic Monitoring Tables, uptime statistics for all devices, more Custom Integration scripts for monitoring Microsoft Windows systems and AWS resources, pre-configured SNMP sensor templates for Sophos Firewall and Dell iDRAC, and more.
In summary, here’s what’s new on Domotz this month.
- Dynamic list of devices in Monitoring Tables
- Device Uptime Values in Monitoring Tables
- Support for Multiple Ubiquiti/UniFi Controllers
- WinRM (WMI) based Custom Scripts
- Sophos Firewall Pre-Configured SNMP template
- Dell iDRAC Pre-Configured SNMP template
- Web Service Performance Monitoring
- iPerf Internet Speed Test Monitoring
- Amazon Web Services – AWS EC2, CloudWatch, EBS, RDS, and Billing Monitoring
We continuously improve the Domotz experience and value your feedback. If you encounter any issues or have suggestions for further enhancements, please contact our support team.
What’s new
Dynamic list of devices in Monitoring Tables
We have a powerful new feature that enhances our monitoring tables’ flexibility. With the latest update, you can create dynamic monitoring tables using custom filters.
By leveraging custom filters, you can define specific criteria for including devices in your monitoring tables. A new device automatically appears in the table whenever it meets the filter conditions. This new feature is sure to save you time and effort!
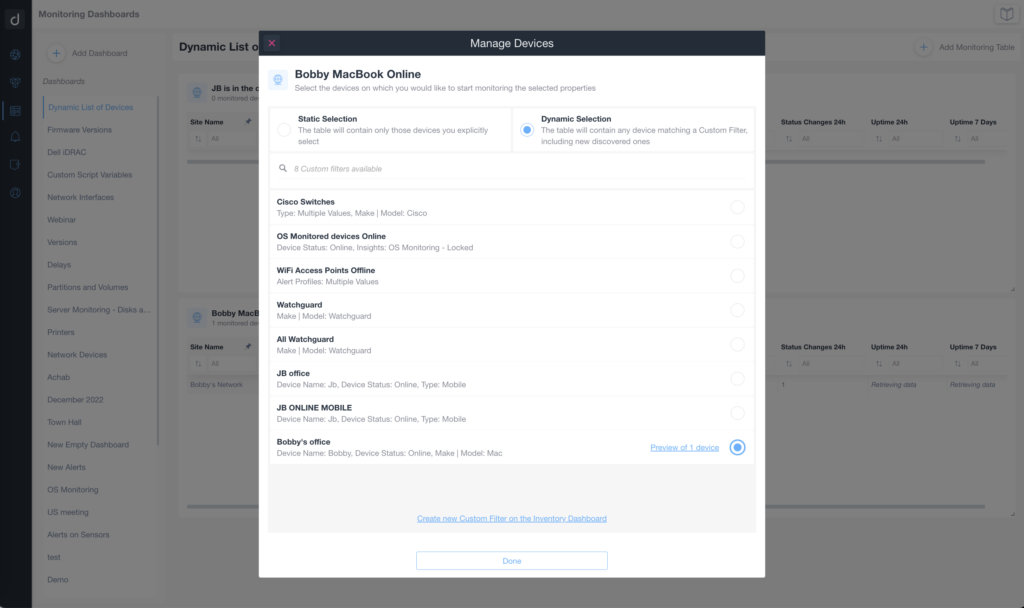
Moreover, you can create monitoring tables that adapt to changes in your network environment. For example, you can set up a table to display only your important devices currently offline across sites. Use this improvement to focus on your critical devices and take prompt action when necessary.
No more manually updating your monitoring tables. Embrace the power of automation with dynamic device lists in your monitoring tables. Simplify your monitoring workflows and get real-time updates.
For more information about configuring Custom Filters for your Monitoring Tables, visit our Custom Filters help page.
Device Uptime Values in Monitoring Tables
Our insightful new feature provides valuable uptime information for all the devices you’re monitoring. With the latest update, you can now easily track and analyze the performance of your devices right from the monitoring tables.
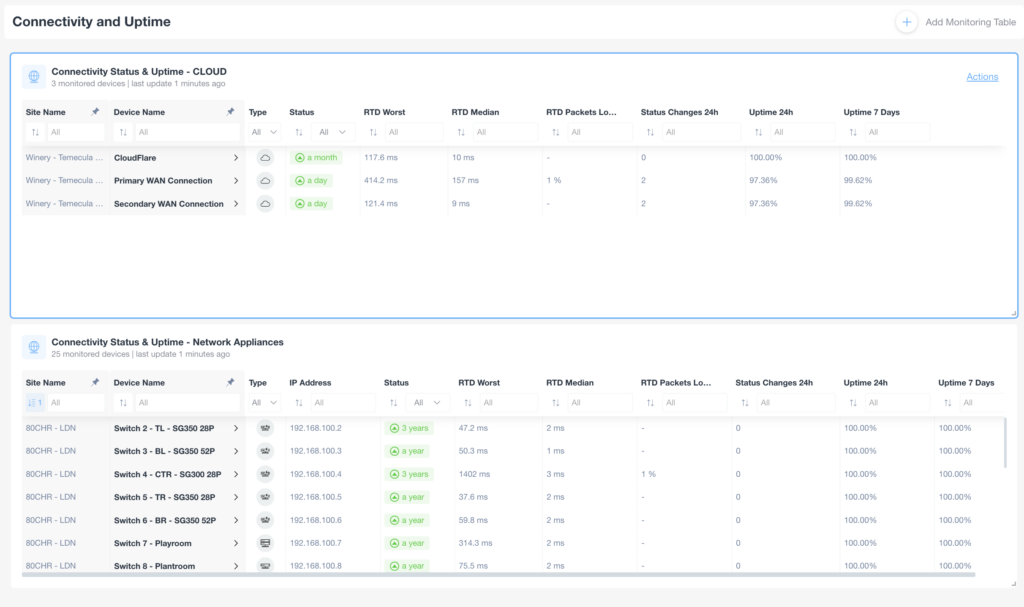
For each device or service you’re monitoring, you can now access uptime statistics for the past 24 hours, 7 days, and 1 month. Moreover, this new information allows you to assess the reliability and stability of your devices over time.
Uptime values in your monitoring tables also allow you to generate comprehensive reports for your end customers. You can now provide visibility into devices requiring additional attention or troubleshooting. Use this new feature to deliver a higher level of service and make informed decisions based on reliable uptime metrics.
Stay on top of your network performance and gain valuable insights with device uptime values in your monitoring tables. You are also allowed to generate comprehensive reports and demonstrate the reliability of the network infrastructure to your clients and stakeholders.
Using the Domotz Public API, you can also extract uptime statistics. For more information, visit Domotz Public API – Uptime.
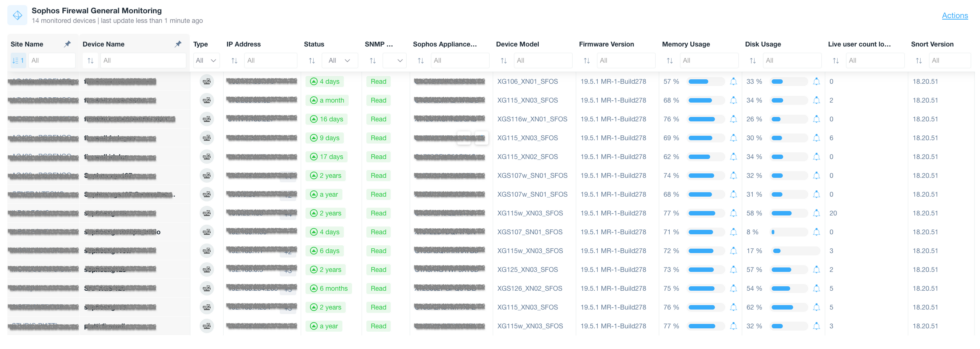
Sophos Firewall Pre-Configured SNMP template
We now support pre-configured SNMP sensors for Sophos Firewalls. We have new sets of pre-configured SNMP templates for Sophos firewalls:
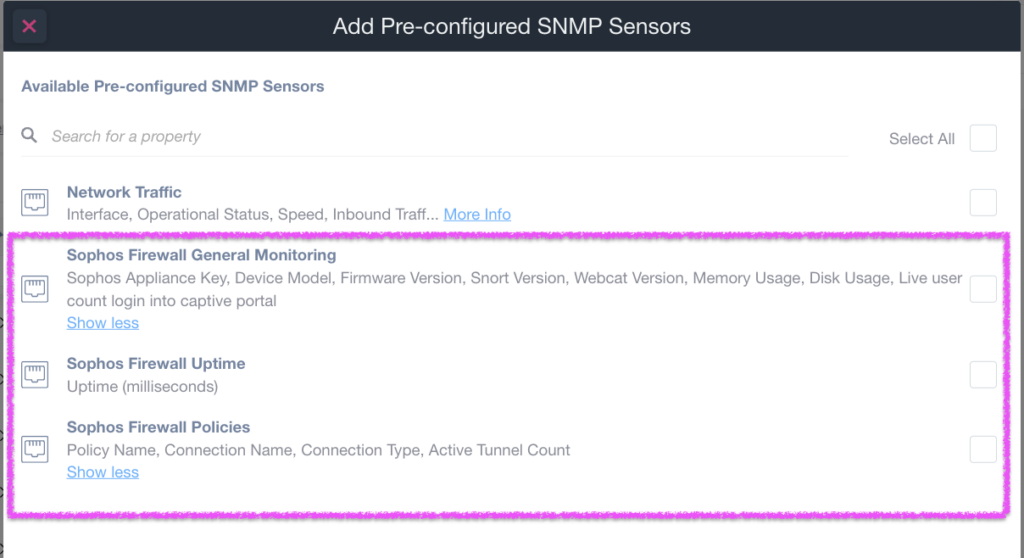
Firstly, you can use these new templates to monitor any Sophos firewall. Moreover, you can also automatically extract multiple types of information:
- General Information about the status of the firewall (e.g., the Sophos Appliance Key, the Device Model, Firmware Version, Snort version, Memory and CPU usage, Number of Live Users logged into Captive Portal, and more)
- The Sophos Firewall Uptime
- Policy Information (e.g., configured policies, Policy Names, Connection types, Active Tunnel Counts, and more).
Use our new pre-configured tables (or list of variables) to monitor your Sophos firewalls across multiple sites. Moreover, you can create monitoring tables using this data:
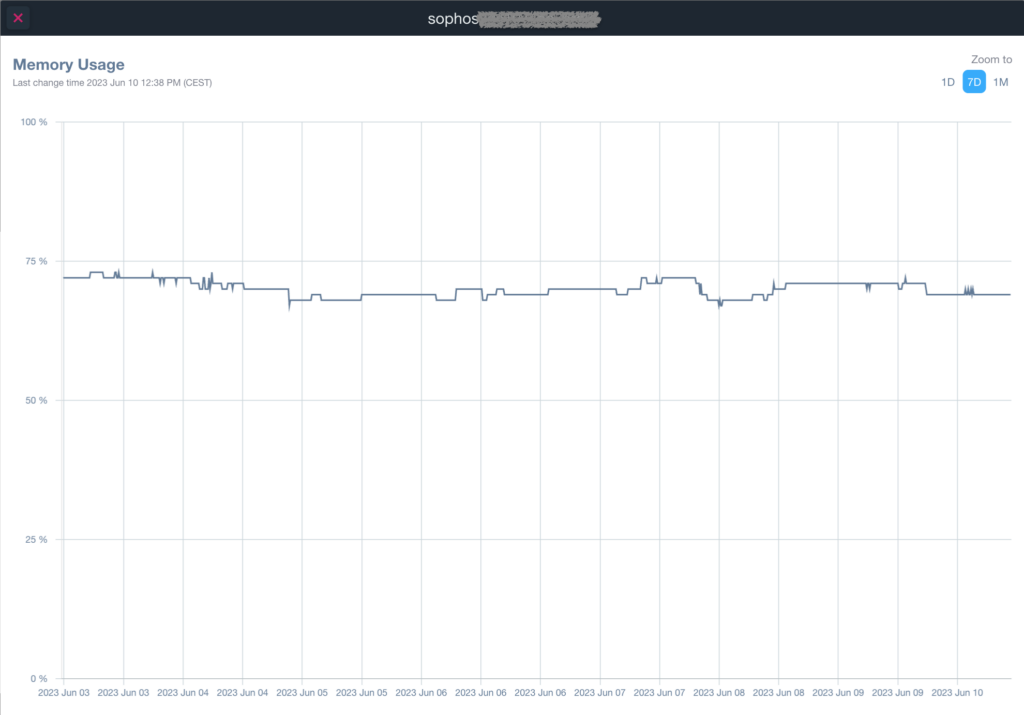
Finally, this new feature includes reporting in graph format. The reports include both historical data and statistical information.
You will find more information by visiting the Pre-configured SNMP Sensors – Sophos Firewall help page.
Dell iDRAC Pre-Configured SNMP template
We now have pre-configured SNMP sensors available for Dell iDRAC. We have new sets of pre-configured SNMP templates for the iDRAC server:
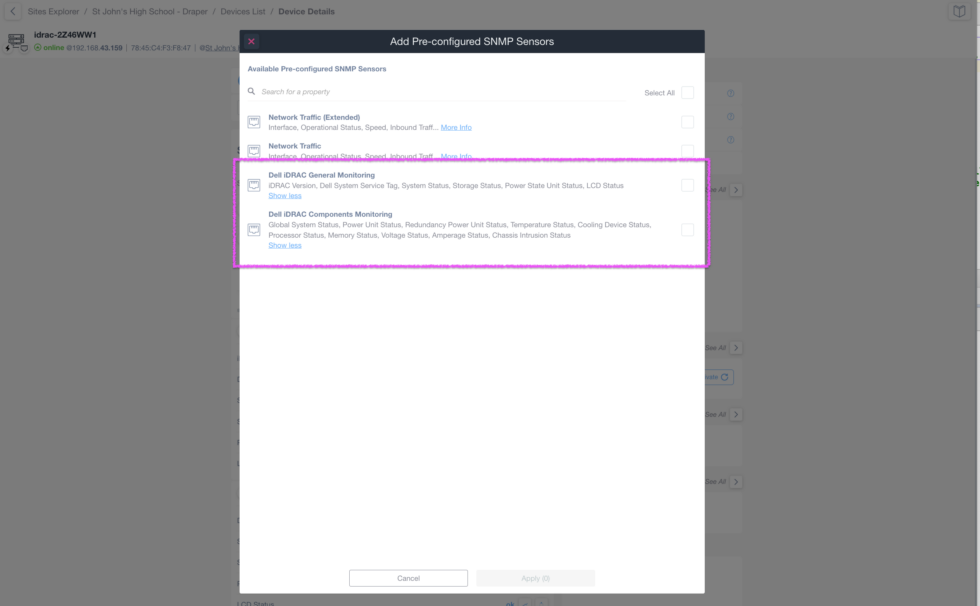
Firstly, you can use this new template to monitor every Dell iDRAC server. Moreover, for these servers, you can now automatically extract multiple types of information:
- General Information about the status of the server (e.g., the iDRAC Version, the Dell System Service Tag, the System and Storage status, and more)
- Component Monitoring (e.g., Global System Status, Power Unit Status, Temperature Status, Cooling Device Status, and more).
Additionally, use our new pre-configured tables (or list of variables) to monitor your Dell iDRAC servers across multiple sites. Moreover, you can create monitoring tables using the data from this functionality.
This is an example of General Information you can extract from the Dell iDRAC through this new SNMP Pre-Configured template:
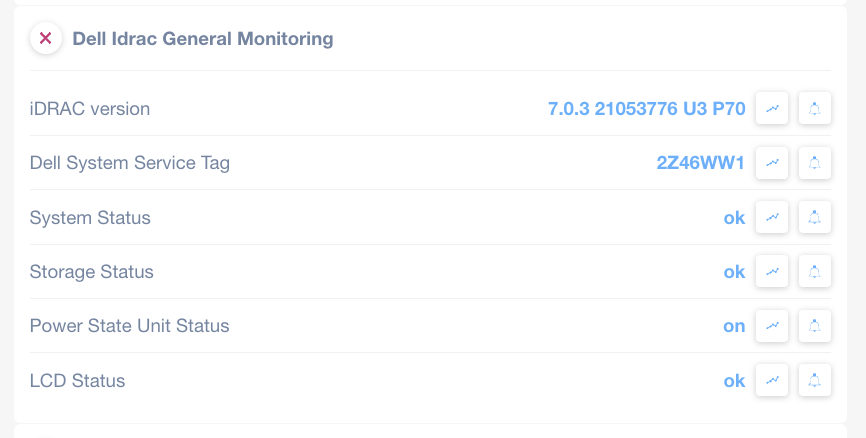
Finally, this new feature allows you to set alerts on the status of each Dell iDRAC component parameter:

To find out more about Pre-configured SNMP Sensors – Dell iDRAC visit our help section.
Web Service Performance Monitoring
We are thrilled to introduce a powerful new feature! Proactively monitor and control Web Service Performance through Domotz. With the latest update, you can easily monitor and analyze the performance of web services within your network environment.
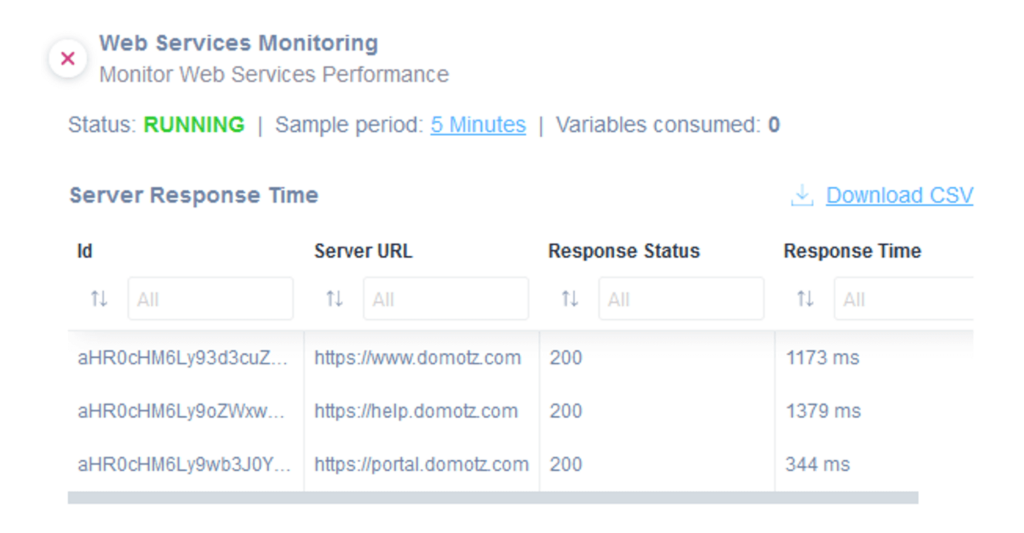
The Web Service Performance script provides a comprehensive table that displays the list of monitored web services, including their URLs, response statuses, and response times.
This valuable information lets you proactively identify and troubleshoot any potential issues before they impact your IT operations.
Our new scripts let you monitor your web services’ health, status, and performance. Whether it’s API endpoints or complete URLs, you can track the response status of each service, such as HTTP status codes.
For example:
- 200 for “OK, the request was fulfilled”
- 404 for “Not Found”
- 500 for “Internal Error”
Please visit the HTTP Response Status Codes page for more information).
Additionally, the script provides the duration for each response, giving you insights into the response time of your web services.
Easily monitor the performance of your web services and take proactive measures to ensure optimal operation.
By proactively identifying and addressing performance issues, you can minimize downtime. Additionally, you can optimize the user experience and maximize the efficiency of your network infrastructure. For more information about Web Services Performance Monitoring and how to utilize this powerful feature, please visit our website: Monitor Web Service Performance.
iPerf Internet Speed Test Monitoring
We now support iPerf internet speed tests! You can now perform iPerf Internet Speed tests as part of your network monitoring activities on Domotz. iPerf3 is a tool for actively measuring the maximum bandwidth achievable on an IP network. With our new feature, you can quickly assess and analyze the performance of your network connections.
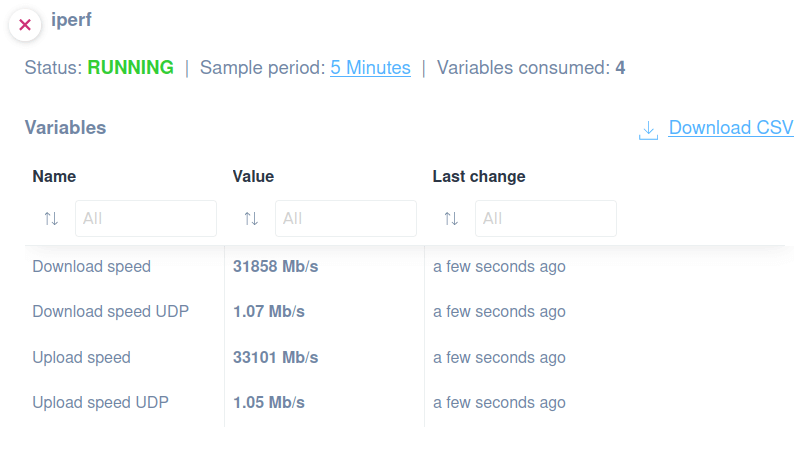
Our custom integration utilizes the SSH protocol to execute speed tests (iPerf3) from Linux machines. Moreover, it provides accurate measurements of download and upload speeds. Gain valuable insights into the bandwidth capacity of your network and proactively identify any performance bottlenecks or connectivity issues.
The iPerf Internet Speed Test script generates comprehensive reports for each execution, including the following values:
- Download speed
- Download speed UDP
- Upload speed
- Upload speed UDP
These metrics allow you to track the performance of your network connections over time. Setting up the right alerts will also notify you if there are any deviations from the speeds you expect. This feature is invaluable for troubleshooting and identifying potential bottlenecks in your network infrastructure.
By incorporating iPerf Internet Speed Test monitoring into your network management workflow, you can ensure optimal network performance. Additionally, you can minimize downtime and deliver a seamless user experience.
For more information on how to set up and utilize the iPerf Internet Speed Test monitoring feature, please visit our help section.
Amazon Web Services – AWS EC2, CloudWatch, EBS, RDS, and Billing Monitoring
We have a new Amazon Web Services (AWS) monitoring integration available. Proactively monitor your AWS infrastructure and services directly through Domotz. Our AWS integration simplifies your infrastructure and application monitoring process.
With our custom scripts leveraging the HTTP protocol and the CloudWatch API, you can effortlessly monitor various aspects of your AWS environment. Let’s explore the different monitoring scripts available:
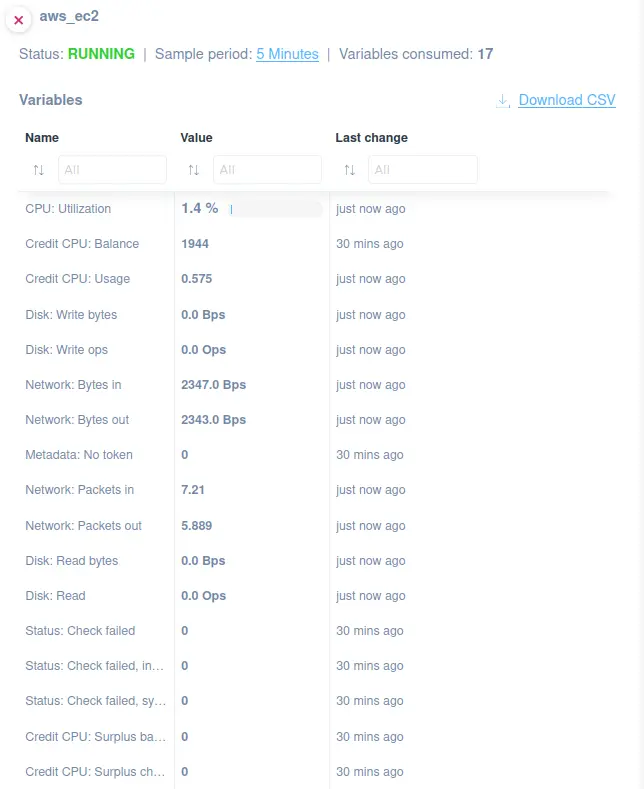
EC2 Monitoring
These scripts collect essential metrics to assess the performance and health of your EC2 instances.
CloudWatch Monitoring
CloudWatch monitoring enables you to gain insights into the performance of your AWS services.
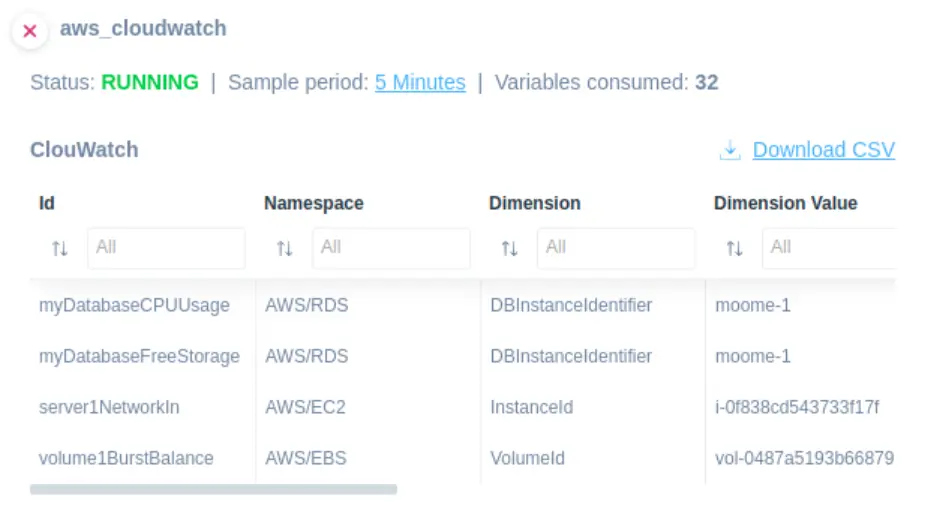
This driver lets you retrieve CloudWatch metrics for various AWS services, including EC2, RDS, ELB, and Lambda.
You can monitor many metrics, including CPU Utilization, Network In, Network Out, Disk Read Ops, Disk Write Ops, Database Connections, and many more.
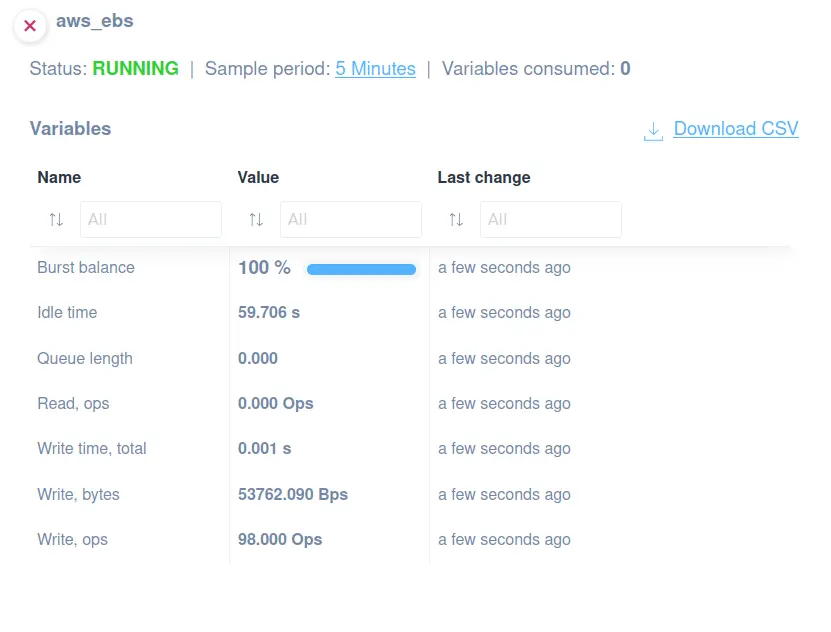
EBS Monitoring
This script provides valuable information to optimize the usage of your EBS volumes.
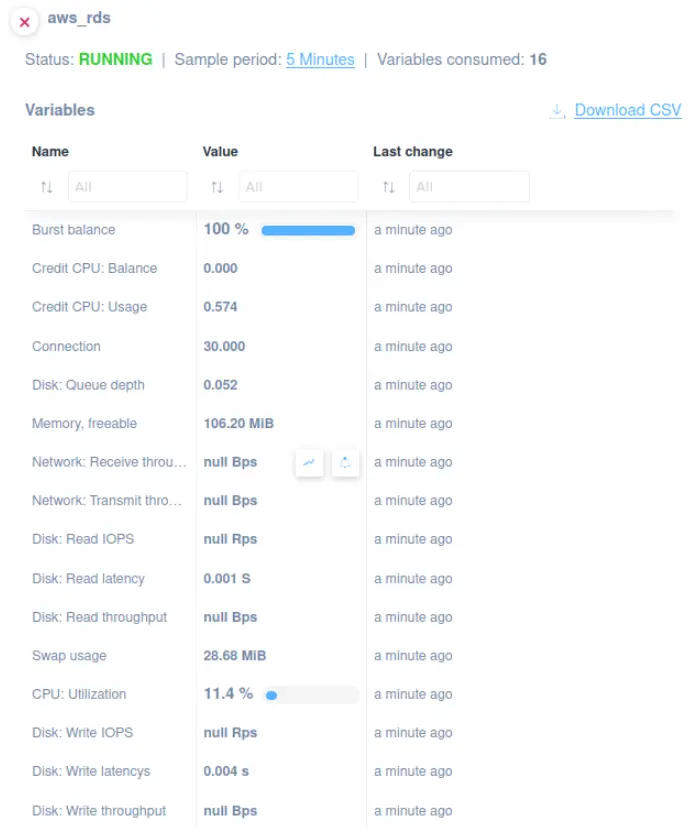
RDS Monitoring
These scripts provide visibility into the performance and status of your RDS instances. You can use them to monitor general information such as CPU, disk operations, network properties, storage, class, status, engine, etc.
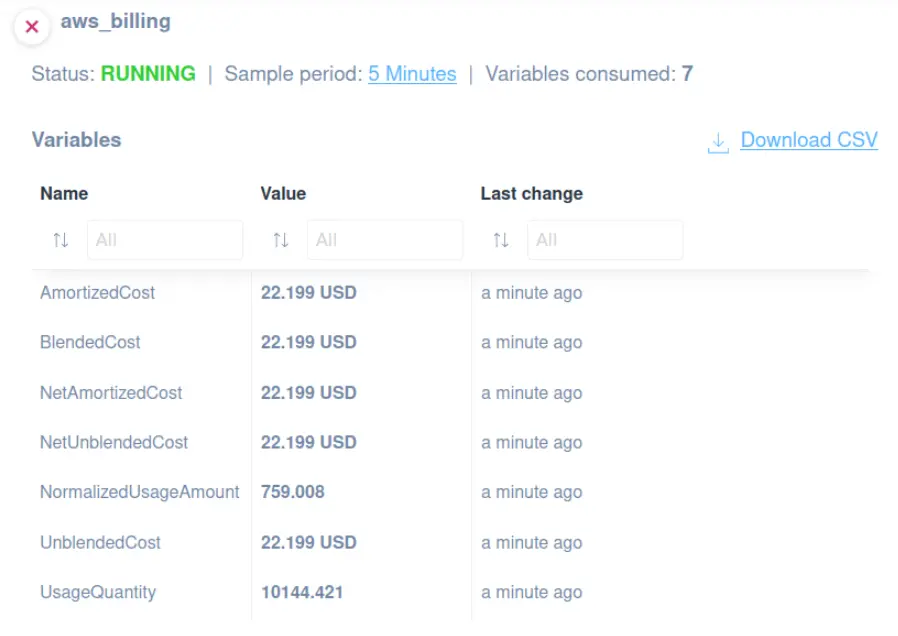
Billing Monitoring
Monitoring your AWS billing helps you keep track of your costs and prevent unexpected expenses.
All these scripts utilize the HTTP/S protocol to access AWS web services securely. To start using AWS monitoring, visit our Amazon Web Services – AWS Monitoring page.
Improvements
Support for Multiple Ubiquiti/UniFi Controllers
We now have a new mechanism to connect to Ubiquiti/UniFi Controllers. You can connect the same Domotz Agent directly with multiple Ubiquiti/UniFi controllers.
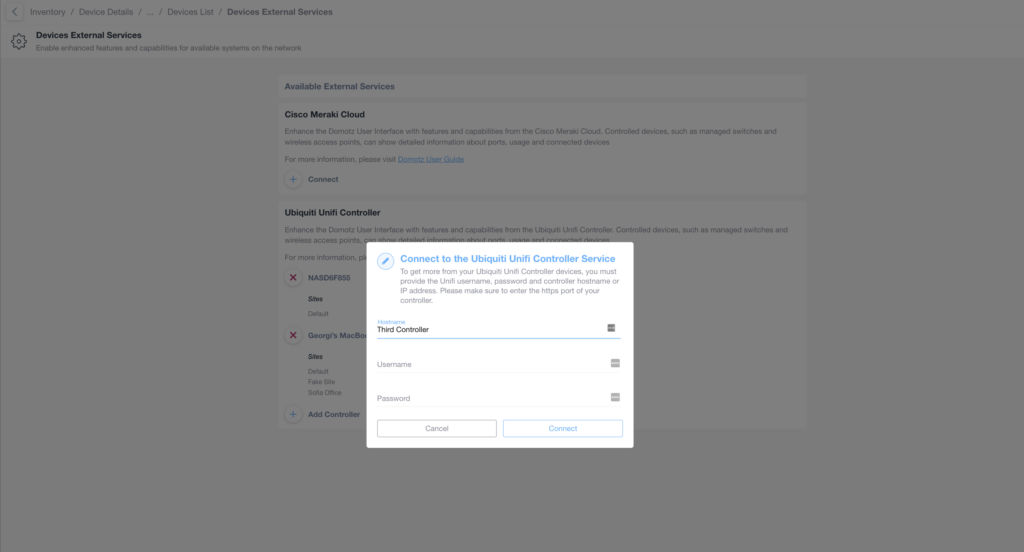
In this way, if multiple controllers control Ubiquiti/UniFi devices on the same site (Domotz Site), you can extract additional information for all of them.
For more information, please visit UniFi by Ubiquiti Networks Performance Monitoring and Alerts.
WinRM (WMI) based Custom Scripts
We’ve made a significant improvement to our Custom Scripts framework. We now have WinRM (Windows Remote Management) protocol support for Windows-based devices. You can execute WMI (Windows Management Instrumentation) commands within the Custom Scripts framework, providing advanced monitoring capabilities for Windows devices.
Previously, all the scripts for advanced monitoring of Windows devices leveraged the SSH protocol for connecting to endpoints. With this update, we have a new set of scripts based on WinRM, enabling seamless integration with Windows devices.
We have a new set of scripts that utilize WinRM as the protocol for leveraging this functionality. You can find these scripts on our GitHub repository at the following link: GitHub Custom Driver – WinRM Examples.
Additionally, we made updates to our Custom Scripts framework to support WinRM as a connection method. For detailed information on utilizing WinRM to connect to devices and execute scripts, please refer to our documentation: Custom Driver – WinRM Options.
Take advantage of the WinRM-based Custom Scripts to enhance your monitoring capabilities for Windows devices. Monitor and easily manage your Windows-based infrastructure, leveraging the power of WMI commands.
Additional MIBs available in the Domotz Database
Additional MIB files are available for the following devices. Additionally, you can search for their OIDs from Domotz:
- HP MIBs
- Sharp NEC Displays
- EVO MIB Tree
- PaloAlto MIBs
- LGE-COMMER-TVLINK-MIB
- LGE-COMMER-TVLINK-WEBOS-MIB
Fix
We’ve fixed the following issues:
- The History Report for String Variables was sometimes creating overflows on the screen.
- The “Last Check” field on the Configuration Management capability did not correctly consider TimeZones.
- The issue with the edit of the Monitoring Dashboard names.
- Monitoring Dashboard was sometimes causing crashes on the Edge web browser.
- The Site Explorer list wasn’t refreshing when changing a single site status.
- Dell OS Switch is not correctly identified for the Configuration Management capability.
- UTF8 symbols were not accepted as names for the Monitoring Tables.
- Merged devices (e.g., devices with multiple Network Interfaces) were not visible in dynamic sensor monitoring tables.
- The Auto-Discovery state was affecting External Device monitoring.
- Disabling Auto-discovery on Agents with the Big Network capability (monitoring up to /16 CIDR network) was not working.
- An issue was causing a “configuration mixup” between devices from different sites.
- Aten PDU issue preventing the user from unlocking the device capability.
Known limitations
- There is no central repository for all the alerts configured on SNMP PreConfigured, OS Monitoring, and Custom Integration script sensors.
- Monitoring Dashboards are currently limited to Monitoring Tables as Widgets.
- Luxul Router-based Agents do not support VPN on demand. To elaborate, we’ll add this capability as soon as Luxul’s team provides us with the required API.
- You can’t configure the static IP address on the Domotz Box before configuring the Agent.
- Lastly, you can’t leverage DHCP on additional VLANs on the Domotz Box.
To conclude, these release notes cover the changes in the Domotz Pro service since the previous one. Furthermore, these changes include Domotz Pro Cloud, Domotz Agent, and Domotz Pro App. Lastly, learn more about our network monitoring software or Know Your Networks Blog.