
We’ve just released exciting features on Domotz. Add more than one Booster Pack to the same Agent, Sony AVR Support, additional Custom Integration scripts for better monitoring Microsoft Windows systems, pre-configured sensor templates for WatchGuard Firewall SNMP monitoring, and more.
In summary, here’s what’s new on Domotz this month.
- Cumulative Booster Packs
- Sony AVR Support
- Windows Custom Integration: Monitor Windows Active Directory Privileged Users
- Windows Custom Integration: Monitor Windows Security Events
- Windows Custom Integration: Monitor Windows Endpoints to check reachable hosts
- Windows Custom Integration: Monitor Windows CPU usage
- Windows Custom Integration: Monitor Windows Group Policies (GPOs) versions
- Pre-Configured SNMP Templates for WatchGuard Firewalls
- Support for HaloPSA Ticket Types
- Events triggered “on change” values.
- Organization, customer, and contract ID available in the Public API
What’s new
Cumulative Booster Packs
With this new feature, you can add more than one Booster Pack to the same Agent/Site. Adding a booster pack extends the capabilities of each agent.
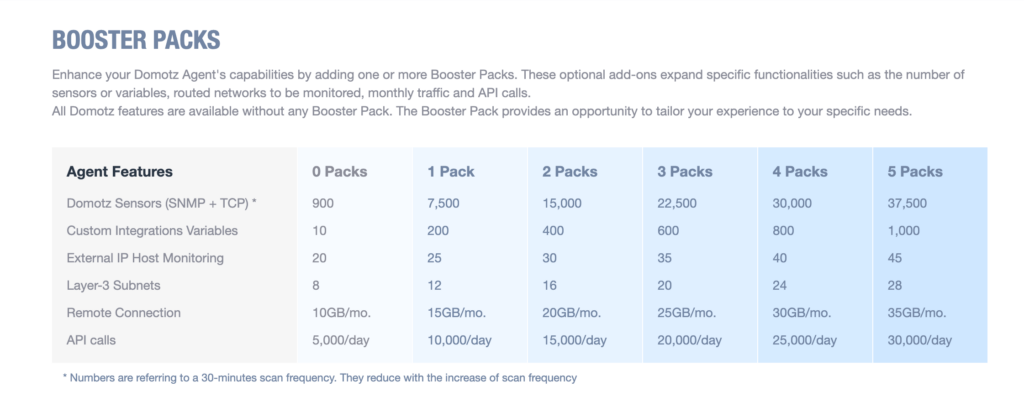
Booster Packs Information Table
1. The table displays the impact of Booster Packs on various agent features for Domotz.
2. Features listed are Domotz Sensors (SNMP + TCP), Custom Integrations Variables, External IP Host Monitoring, Layer-3 Subnets, Remote Connection, and API calls.
3. Without any packs, the default settings include 900 sensors, 10 variables, 20 IP hosts, 8 subnets, 10GB of remote connection per month, and 5,000 API calls per day.
4. One Booster Pack increases capabilities to 7,500 sensors, 200 variables, 25 IP hosts, 12 subnets, 15GB of remote connection per month, and 10,000 API calls per day.
5. Two Booster Packs provide 15,000 sensors, 400 variables, 30 IP hosts, 16 subnets, 20GB of remote connection per month, and 15,000 API calls per day.
6. Three Booster Packs offer 22,500 sensors, 600 variables, 35 IP hosts, 20 subnets, 25GB of remote connection per month, and 20,000 API calls per day.
7. Four Booster Packs increase the capacities to 30,000 sensors, 800 variables, 40 IP hosts, 24 subnets, 30GB of remote connection per month, and 25,000 API calls per day.
8. Five Booster Packs allow for 37,500 sensors, 1,000 variables, 45 IP hosts, 28 subnets, 35GB of remote connection per month, and 30,000 API calls per day.
9. Note that sensor counts refer to a 30-minute scan frequency and may decrease with a higher scan frequency.
Moreover, you can monitor more devices across additional routed subnets or external IP addresses. Additionally, you can perform more API calls, add more SNMP or Custom Integration Sensors, and expand the traffic on remote connections. By allowing the cumulative use of Booster Packs, you’ll gain even more insights into your networks and systems. Furthermore, this helps you better manage and optimize your infrastructure.
Currently, the maximum number of Booster Packs that can be added to a single Domotz Agent / Site is 5. However, if you need to add more, contact Domotz Support to inquire about building a custom plan. Contact us to extend further the capabilities of a single Domotz Agent / Site.
Windows: Monitor Windows Active Directory Privileged Users
Our new custom integration script enables you to proactively monitor Windows Active Directory Privileged Users and Groups with Domotz.
.
“Privileged” accounts and groups in Active Directory are those to which powerful rights, privileges, and permissions.
Proactively monitor “Privileged” accounts and groups in Active Directory with Domotz.
- Monitor the total number of privileged users in Active Directory
- Easily monitor Windows Active Directory privileged users count:
- Monitor the number of privileged users in Active Directory divided by group membership
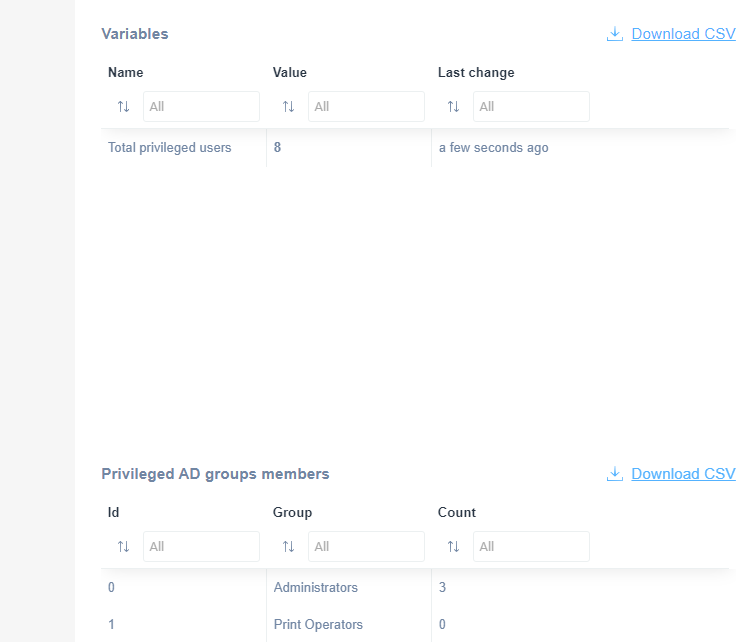
Dashboard overview of privileged users and AD group members.
1. Under "Variables," the table shows "Total privileged users" with a value of 8, updated a few seconds ago. Filters are available for Name, Value, and Last change.
2. Below, in "Privileged AD groups members," the table lists group members with columns for Id, Group, and Count. The table shows two entries: "Administrators" with 3 members and "Print Operators" with 0 members. Filters are provided for Id, Group, and Count.
3. Links for downloading the data as CSV files are available at the top right of each section.
Learn more about Monitoring Windows Active Directory Privileged Users by visiting the official documentation.
Windows: Monitor Windows Security Events
We now have a custom integration script for Windows Security Event Monitoring. This new script allows you to monitor the following Windows Security Events:
By leveraging PowerShell commands, you can use our brand-new script to monitor the following Windows Security events:
- 4720: A user account was created
- 4722: A user account was enabled
- 4731: A security-enabled local group was created
- 4732: A member was added to a security-enabled local group
- 4649: A replay attack was detected
- 4741: A computer account was created
- 4625: An account failed to log on
- 4817: Audit settings on objects were changed
- 4947: A change has been made to Windows Firewall exception list. A rule was modified
- 4948: A change has been made to Windows Firewall exception list. A rule was deleted
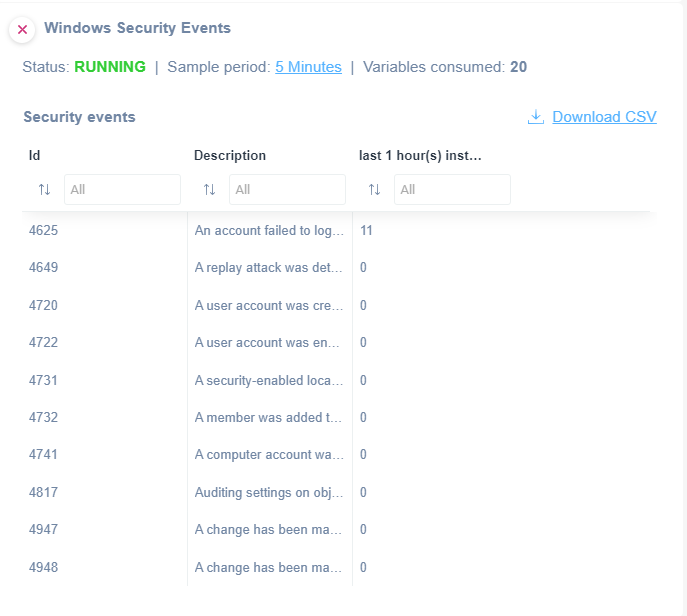
Windows Security Events Dashboard Overview
1. At the top, the status shows "RUNNING" with a sample period of 5 minutes and 20 variables consumed.
2. Below are tabs labeled "Id," "Description," and "last 1 hour(s) inst...".
3. The "Id" column lists event identifiers such as 4625 and 4649.
4. The "Description" column provides details like "An account failed to log…" and "A replay attack was det…".
5. The "last 1 hour(s) inst..." column shows the number of instances in the last hour, with values like 11 or 0.
6. A "Download CSV" option is available for data export.
Learn more about Windows Security Event monitoring by visiting the official documentation.
Windows: Monitor Windows Endpoints to check reachable hosts
We have a new custom integration script for Monitoring Windows Endpoints for reachable hosts. Our custom integration script to Monitor Windows Endpoints allows you to monitor if hosts are reachable, get notified of value changes, monitor whether a VPN connection is up and running, and so much more.
An everyday use case for this is monitoring whether a VPN connection established directly from a Windows endpoint is up and running.
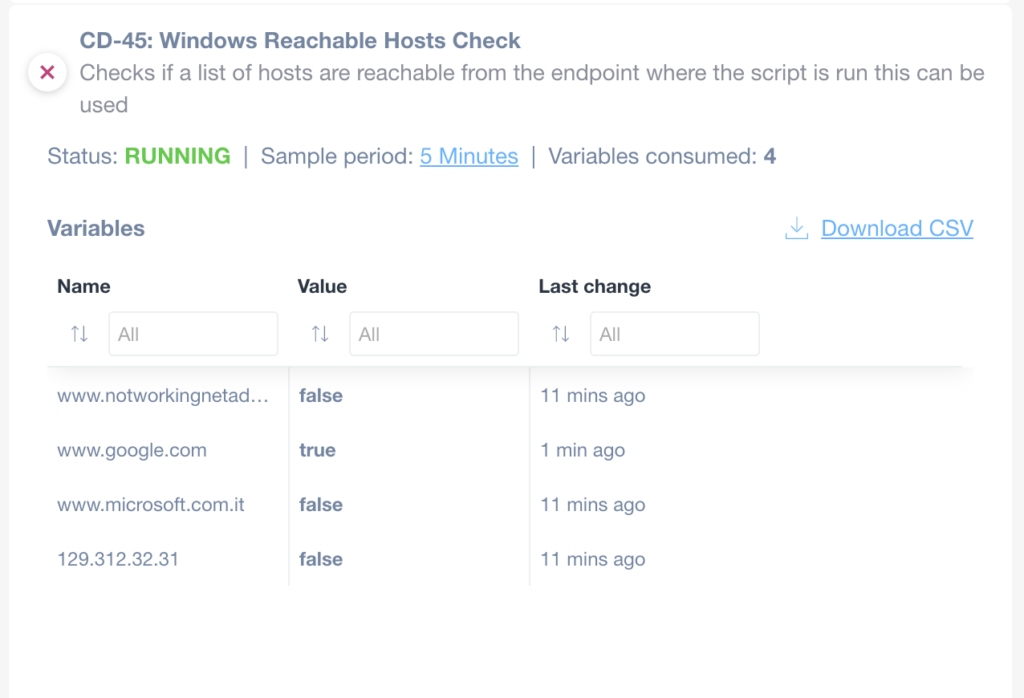
Windows Reachable Hosts Check Status
1. The check titled "CD-45: Windows Reachable Hosts Check" is running, with a status indicator showing "RUNNING" in green.
2. The sample period is every 5 minutes, and 4 variables have been consumed.
3. A table lists host variables with columns for Name, Value, and Last Change.
- Name column includes domain names: www.notworkingnetad..., www.google.com, www.microsoft.com.it, and an IP address 129.312.32.31.
- Value column shows "false" for www.notworkingnetad..., www.microsoft.com.it, and the IP address, and "true" for www.google.com.
- Last Change column displays 11 minutes ago for most entries, except www.google.com, which updated 1 minute ago.
4. Option to download the data as a CSV file is available.
Review the official documentation to learn more about Monitoring Windows Endpoints for Reachable Hosts.
Windows: Monitor Windows CPU usage
We have another new Custom integration script that enables you to proactively monitor Windows CPU usage with Domotz.
Know the processing power exhaustion for processing data and running programs on your Windows Machines.
Proactively Monitor and get Alerts on Windows CPU usage using Domotz.
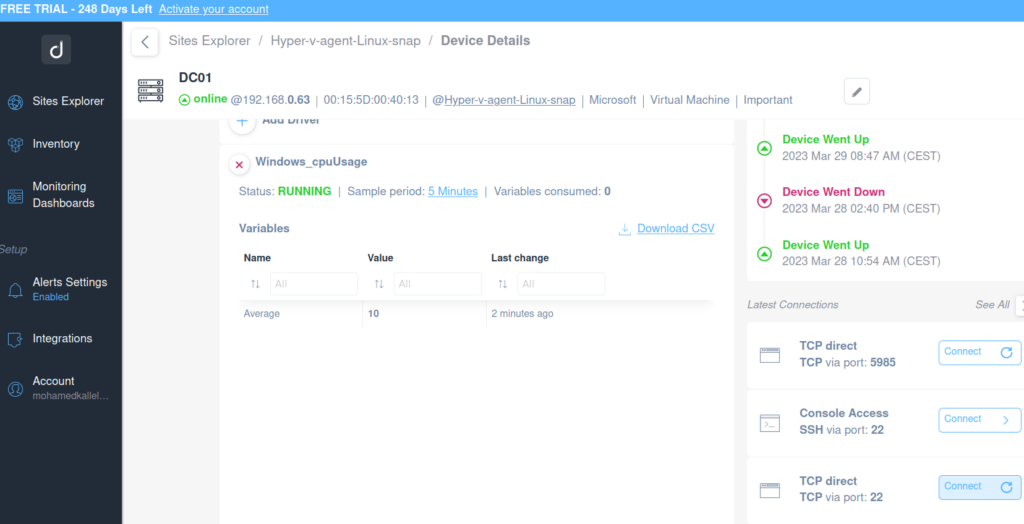
Monitoring Device Details and Activity Log
1. The device "DC01" is currently online at IP 192.168.0.63. Uptime is 15 days, 55 minutes, and 40 seconds.
2. The "Windows_cpuUsage" application status is running, with a sample period of 5 minutes. One variable is consumed. The average CPU usage value is 10, recorded 2 minutes ago.
3. Recent activity log shows:
- Device went up on March 29, 2023, at 08:47 AM (CEST).
- Device went down on March 28, 2023, at 02:40 PM (CEST).
- Device went up again on March 28, 2023, at 10:54 AM (CEST).
4. Latest connections available:
- TCP direct on port 5985. Connect option available.
- Console Access via SSH on port 22. Connect option available.
- Another TCP direct on port 22. Connect option available.
5. Options for inventory, monitoring dashboards, alert settings, integrations, and account details are accessible from the left sidebar.
Learn more about Monitoring Windows CPU Usage by visiting the official documentation.
Windows: Monitor Windows Group Policies (GPOs) versions
We also have a new Custom integration Script for Monitoring Windows Group Policies (GPOs), including versions. With this new script, you can monitor:
– AD Version (User)
– SYSVOL Version (User)
– AD Version (Computer)
– SYSVOL Version (Computer)
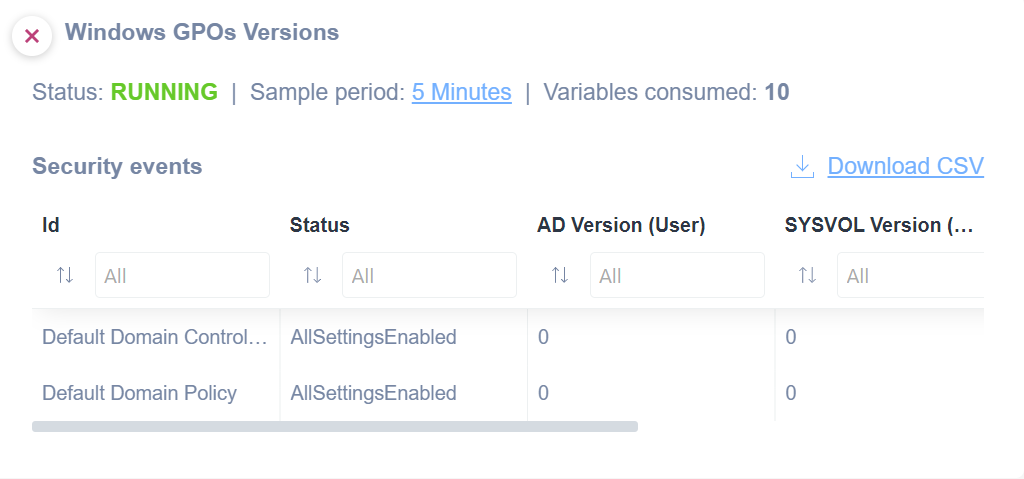
Windows GPOs Versions Monitoring Dashboard
1. The main title indicates the section is "Windows GPOs Versions."
2. The status of the process is shown as "RUNNING" in green.
3. The sample period for the data collection is "5 Minutes."
4. The system notes that "Variables consumed" are 10.
5. Under "Security events," there is a table with columns: Id, Status, AD Version (User), and SYSVOL Version.
6. The table shows two rows for security events, both titled "Default Domain Controller Policy" and "Default Domain Policy," with their statuses marked as "AllSettingsEnabled."
7. Both the "AD Version (User)" and "SYSVOL Version" columns have values of 0 for each policy.
8. A "Download CSV" link is available for exporting the data.
Learn more about Windows Group Policy Monitoring by visiting the official documentation.
Improvements
Sony AVR Support
We’ve added capabilities to support Sony devices within our Sony Device integration. In particular we have added the capability terminate running apps on Sony TV Screens.
Possibility to configure an alert “on change” event
You can now configure alerts that are triggered when the value of a variable changes. This improvement is available for Pre-Configured SNMP, OS Monitoring, and Custom Integrations variables.
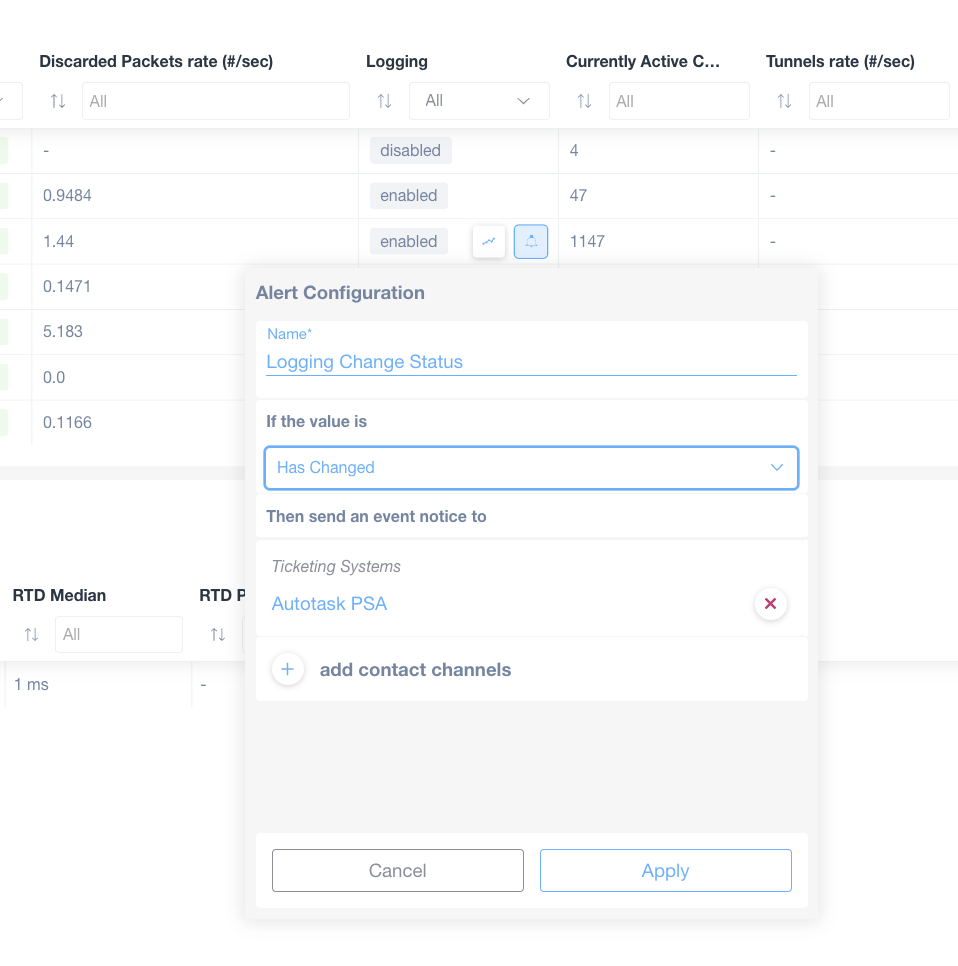
Configuring Alert Settings in a Software Interface
1. In the "Alert Configuration" window, enter a name for the alert under "Name" (e.g., "Logging Change Status").
2. For "If the value is," select an option like "Has Changed" from the dropdown menu.
3. Choose where to send an event notice by selecting a ticketing system, such as "Autotask PSA."
4. Optionally, add contact channels by clicking on the "+ add contact channels" link.
5. Complete the setup by clicking the "Apply" button. Use "Cancel" to exit without saving changes.
With this feature, you can quickly identify changes in your network or system and take proactive steps to address any issues.
Pre-configured WatchGuard Firewall SNMP sensor templates
We now have WatchGuard Firewall SNMP sensors which are pre-configured. We’ve added new sets of pre-configured SNMP templates for WatchGuard firewalls:
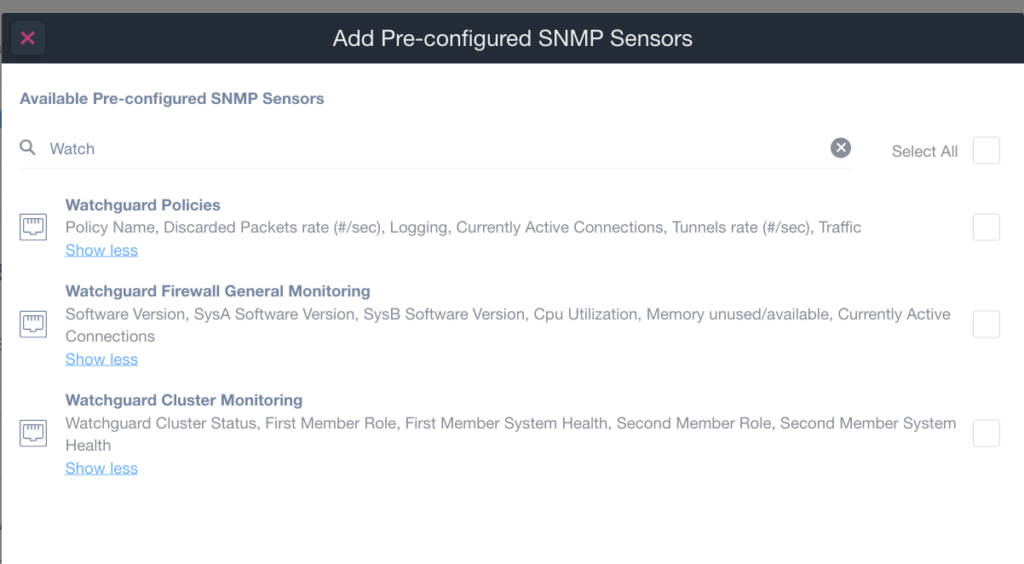
Add Pre-configured SNMP Sensors
1. In the "Add Pre-configured SNMP Sensors" window, search for sensors using the search bar labeled "Watch."
2. Review the available options:
- **Watchguard Policies**: Includes details like Policy Name, Discarded Packets rate, Logging, Active Connections, Tunnels rate, and Traffic. An option to "Show less" or expand for more information is provided.
- **Watchguard Firewall General Monitoring**: Shows metrics such as Software Version, CPU Utilization, and Current Active Connections. Use "Show less" to collapse details.
- **Watchguard Cluster Monitoring**: Monitors Cluster Status, Member Roles, and System Health. "Show less" is available for collapsing details.
3. Select desired sensors by checking the box next to each option.
4. Use the "Select All" checkbox to choose all options at once.
Firstly, you can use this new template to monitor every WatchGuard firewall. Moreover, for these firewalls, you can now automatically extract multiple types of information:
- General Information about the status of the Firewall (e.g., the Software Version, the CPU Utilization, Memory available, Current Active Connection
- Cluster Information (e.g., Cluster Status, First Member Role, and Health, Second Member Role and Health)
- Policies Information (e.g., configured policies, Discarded Packets Rate, Logging configuration, Active Connections per Policy, Tunnel Rates, and Traffic).
You can use each new pre-configured table to create a new Table (or list of variables) to monitor your WatchGuard firewalls better. You can add the data retrieved through this functionality to the Monitoring Tables:
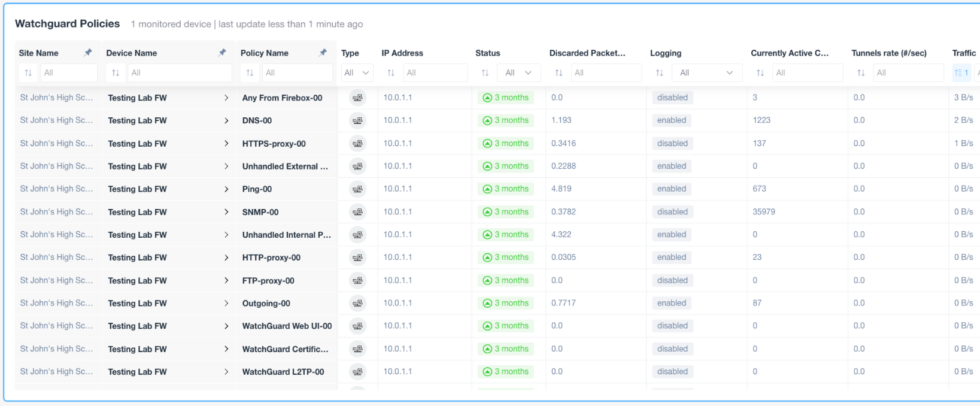
Watchguard Policies Table Overview
1. **Site Name**: Displays the site, "St John's High School," for all entries.
2. **Device Name**: Lists "Testing Lab FW" for each policy.
3. **Policy Name**: Shows various policy names including, "Any From Firebox-00", "DNS-00", and "HTTPS-proxy-00", indicating specific rules or configurations.
4. **Type**: Provides specific types of policies applied, such as DNS, Proxy, and External.
5. **IP Address**: All entries have the IP address "10.0.1.1".
6. **Status**: Indicates each policy has been active for "3 months".
7. **Discarded Packets**: Lists numeric values representing discarded packets, with most entries showing "0.0".
8. **Logging**: Displays the status of logging, with entries marked as "enabled" or "disabled".
9. **Currently Active Connections**: Shows active connections per policy, such as "1223" and "137".
10. **Tunnels Rate**: Consistently shows "0" tunnels.
11. **Traffic**: Displays traffic measured in bytes per second (B/s), generally showing "0 B/s".
Finally, this new feature includes reporting in graph format. The reports include both historical data and statistical information.
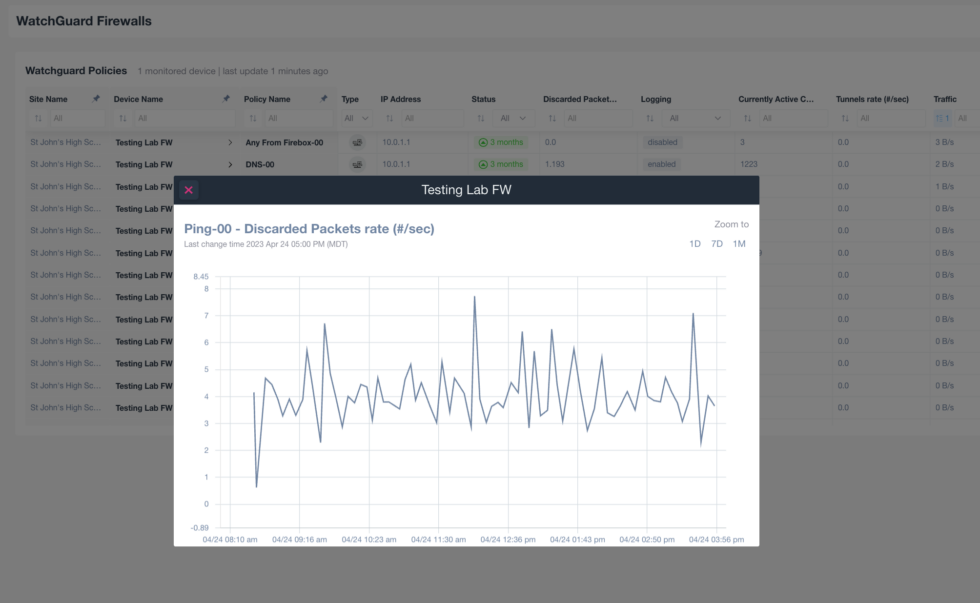
Monitoring Firewall Discarded Packets
1. Navigate to the WatchGuard Firewalls interface showing device policies.
2. Locate the "Testing Lab FW" device in the list under "Watchguard Policies".
3. Note the "Ping-00" policy, which monitors discarded packet rates.
4. A line graph displays the discarded packet rate per second over time for "Ping-00".
5. The graph allows you to zoom in on data for 1 day (1D), 7 days (7D), or 1 month (1M).
6. The x-axis shows timestamps while the y-axis shows the rate of discarded packets.
7. Use this data to analyze network performance and identify issues with packet loss.
For more information, visit Pre-configured SNMP Sensors – WatchGuard Firewall.
HaloPSA Integration – possibility to select Ticket Type
You can choose the Ticket Type when setting up the HaloPSA integration for Ticketing Systems. Choose the ticket type to use when creating tickets in HaloPSA:
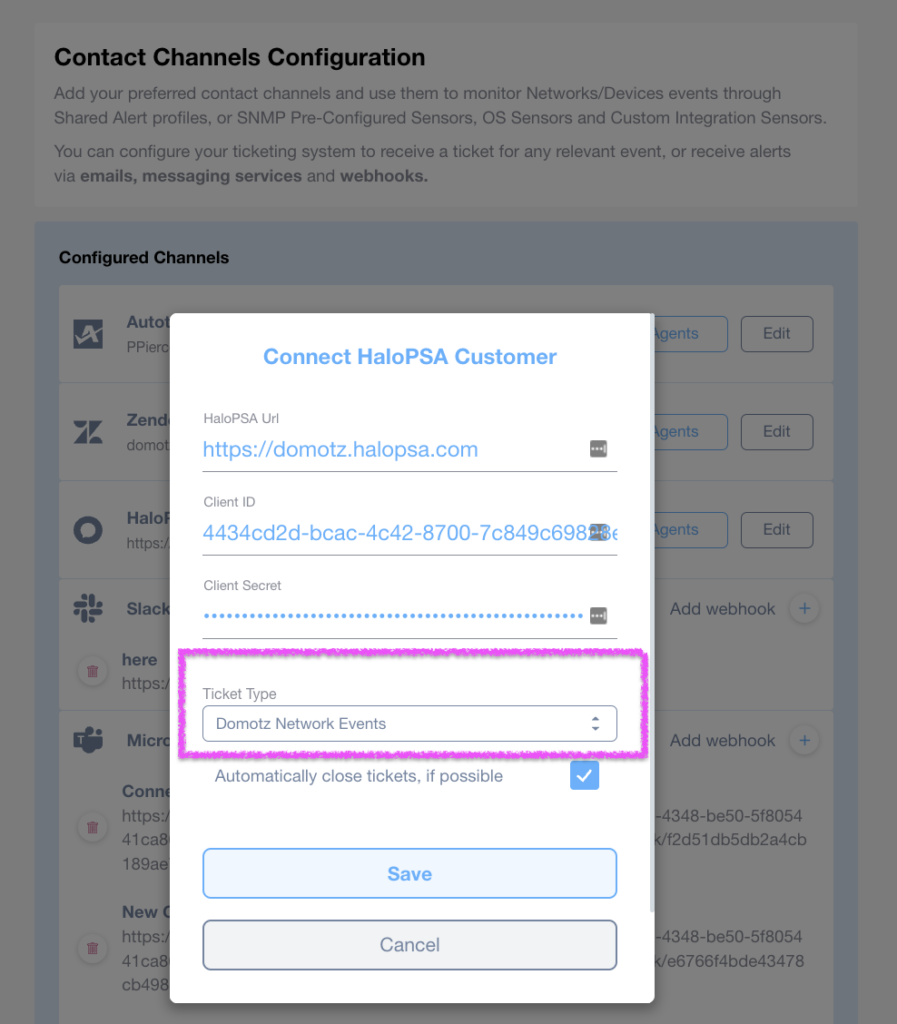
Configuring Contact Channels in HaloPSA
1. Access the "Contact Channels Configuration" section to set up monitoring for network or device events.
2. Within the "Configured Channels" list, click on the option to edit your desired channel.
3. In the "Connect HaloPSA Customer" window, ensure the "HaloPSA Url" is set correctly.
4. Verify the "Client ID" and "Client Secret" fields are populated.
5. Select the appropriate "Ticket Type" from the dropdown menu, such as "Domotz Network Events."
6. Decide if you want to "Automatically close tickets, if possible" by checking the corresponding box.
7. Click "Save" to apply the changes or "Cancel" to discard them.
Moreover, you can define a specific custom type to identify the tickets created through the Domotz integration. This provides you with greater flexibility and organization when managing tickets in HaloPSA.
Added Organization, Contract ID, and Customer ID information in Public API for Agents
There is new information available via the Public API for your Agents. You can now access the Organization information, Contract ID, and Customer ID in the API to list all the agents or view data for a specific agent. This enhancement will make it easier for you to retrieve critical information. Additionally, it improves how you manage agents.
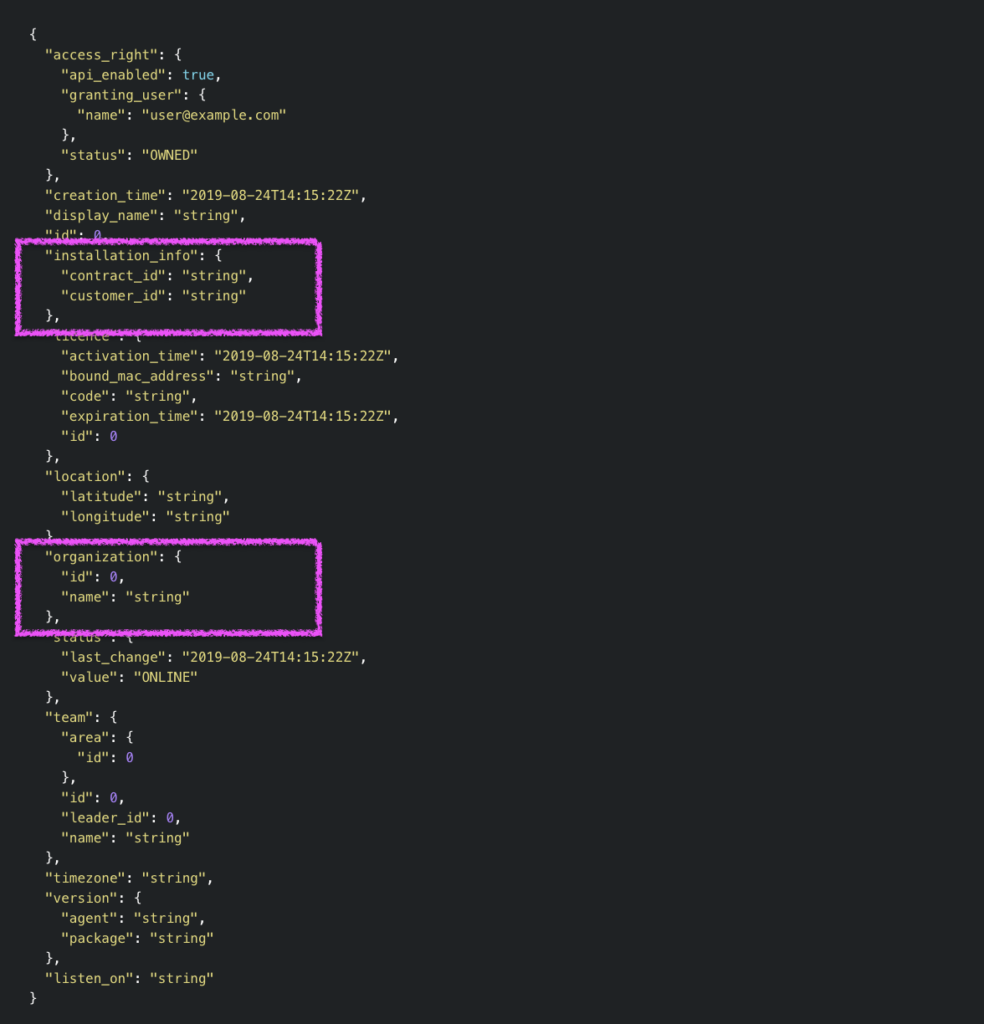
JSON Configuration for Installation and Organization Details
1. "installation_info": Contains "contract_id" and "customer_id" as string placeholders, representing the unique identifiers for installation contracts and customers. Use this section to specify contract and customer IDs.
2. "organization": Includes "id" as 0 and "name" as a string placeholder. This is used to define the organization's ID and name within the system.
Visit https://portal.domotz.com/developers/#listagents and https://portal.domotz.com/developers/#getagent to access the updated API.
Please note that while this information is accessible through the API, the configuration of the Organizations, as well as specifying Contract ID or Customer ID connected to the specific Domotz Agent / Site, is still restricted to the Domotz UI (App or WebApp).
Fix
We’ve fixed the following issues:
- Fixed several warnings/errors introduced in the Domotz WebApp (in the Browser Console).
- Fixed an issue causing the Team Member (configured as Impersonator of the Admin account) not to see any Domotz Agent.
- Custom Integration Scripts using the “WinRM” protocol wrongly displayed HTTP as a credential protocol.
- FreshDesk integration: mandatory “Fields” were missing from the UI.
- Inventory Dashboard: the list of Agents/Sites belonging to a specific Organization was broken in case of inactive Agents attached to that specific Organization.
- IT Glue Integration: the “Select All” devices filter has been fixed.
- OS Management unlocking has been fixed.
- Public API: the listAgentDeviceVariables also returned the previously “Deleted” devices (for which the variables/history was still available).
- OS Monitoring capability was failing in unlocking the iDrac service.
- Fixed an issue in the response format for the Configuration Management functionality.
- Fixed an issue preventing the execution of WAN TCP Port scan on a specific set of Domotz Agents.
- The monthly report did not report some of the latest capabilities introduced in Domotz among the list of Activities (e.g., Custom Integration Actions, Sony AVR commands, etc.).
Known limitations
- There is no central repository for all the alerts configured on SNMP PreConfigured, OS Monitoring, and Custom Integration script sensors.
- Monitoring Dashboards are currently limited to Monitoring Tables as Widgets.
- Luxul Router-based Agents do not support VPN on demand. To elaborate, we’ll add this capability as soon as Luxul’s team provides us with the required API.
- You can’t configure the static IP address on the Domotz Box before configuring the Agent.
- Lastly, you can’t leverage DHCP on additional VLANs on the Domotz Box.
To conclude, these release notes cover the changes in the Domotz Pro service since the previous one. Furthermore, these changes include Domotz Pro Cloud, Domotz Agent, and Domotz Pro App.
Lastly, to learn more about our network monitoring software or our Know Your Networks Blog.