We’ve just released exciting features on Domotz. Spring into spring with these new features. Create Custom Filters in your Inventory Dashboards, Monitoring Tables with data from Custom Integration scripts, the ability to disable the local Web Interface of the Domotz Agent, the possibility to bulk unlock Windows systems through an AD Group Policy (for WMI/WinRM based integrations) and so much more more.
In summary, here’s what’s new on Domotz this month.
- Custom Integration data within the Monitoring Dashboards
- Custom Filters in the Inventory Dashboards
- New Integration: Monitor Microsoft Windows Services
- New Integration: Monitor Crestron DM-NVX devices
- New Integration: Monitor Control4 Zigbee devices
- Possibility to disable the local Agent Web Interface
- Unlock OS Monitoring capability on multiple devices through AD
- Extension of Custom Integration scripts Sandbox API
- Support for OpenWRT and Proxmox for hosting Domotz Agent
- Navigate directly to Important Devices offline from the Inventory dashboard
- Support for TFTP for Configuration Management on Watchguard and Fortigate
- New graph engine for time-based graphs
- Allowing more than 300 devices in a single monitoring table
- Allowing multiple Admin accounts
What’s new
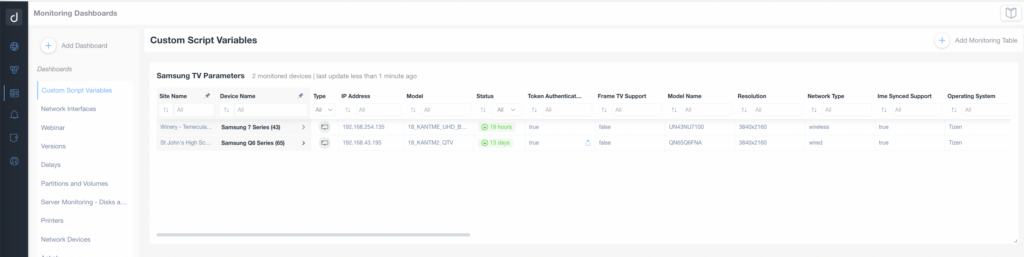
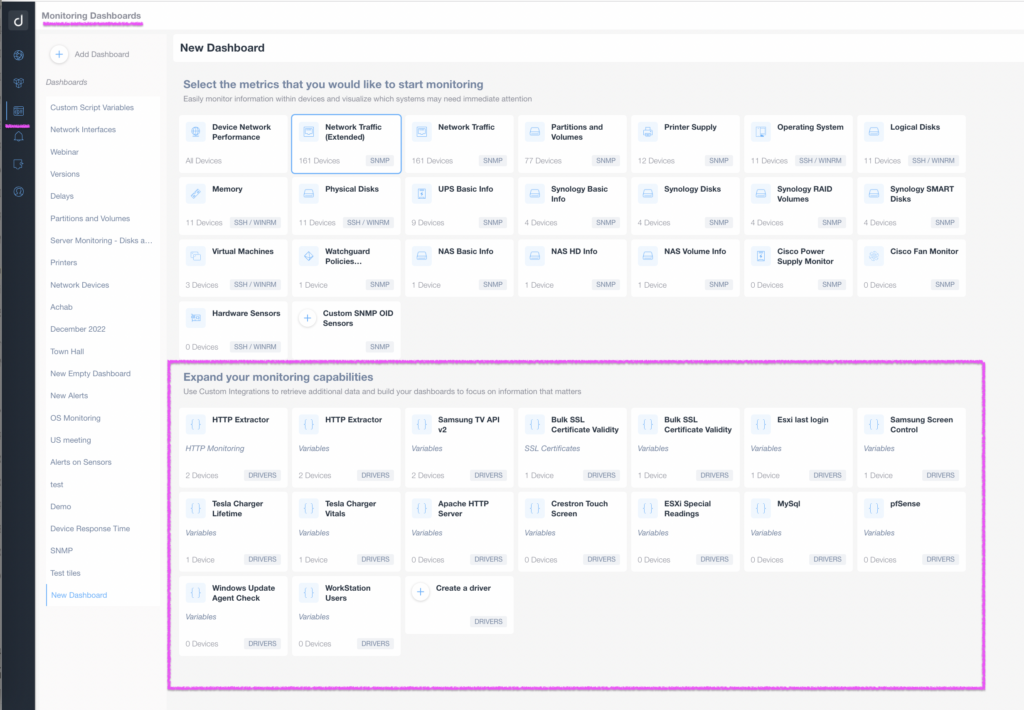
Create Monitoring Dashboards with Custom Integration data
We’re thrilled to announce a new feature that enables you to create custom monitoring dashboards and tables using data extracted by our Custom Integration scripts. With this new feature, you can create simple monitoring tables that display variables extracted from different devices. This includes different devices across your sites and Agents.
In addition, you can now create custom integration scripts. In the future, you’ll be able to apply existing scripts to different devices directly from the new Monitoring Dashboard.
This provides greater flexibility and customization. You can create monitoring dashboards that meet your own specific needs and requirements.
To create a custom monitoring dashboard with Custom Integration data, navigate to the “Monitoring Dashboards” menu and select “New Dashboard.” From there, choose the “Custom Integration” option and select the variables you want to monitor. You can then add the devices you want to monitor and customize the dashboard layout.
This new feature is handy for creating custom monitoring dashboards leveraging the data our Custom Integration scripts extract.
Custom Filters in the Inventory Dashboards
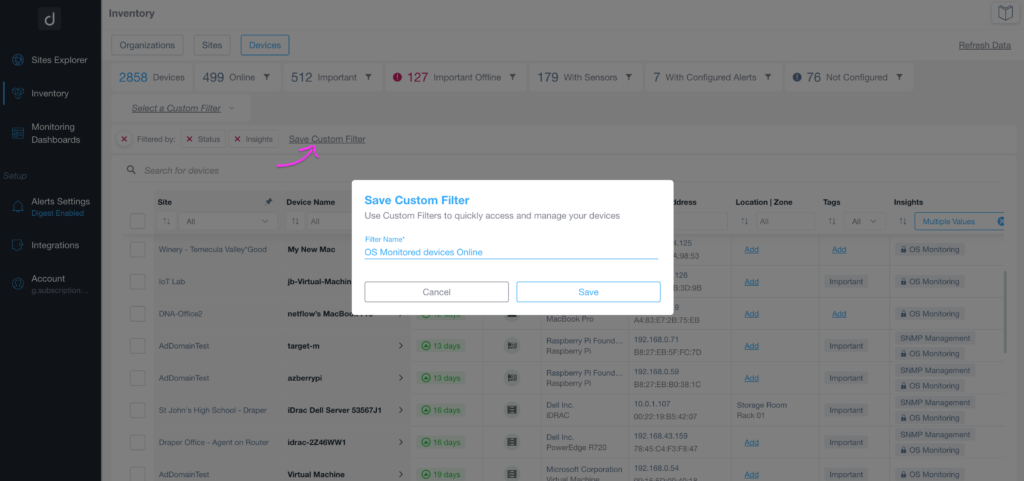
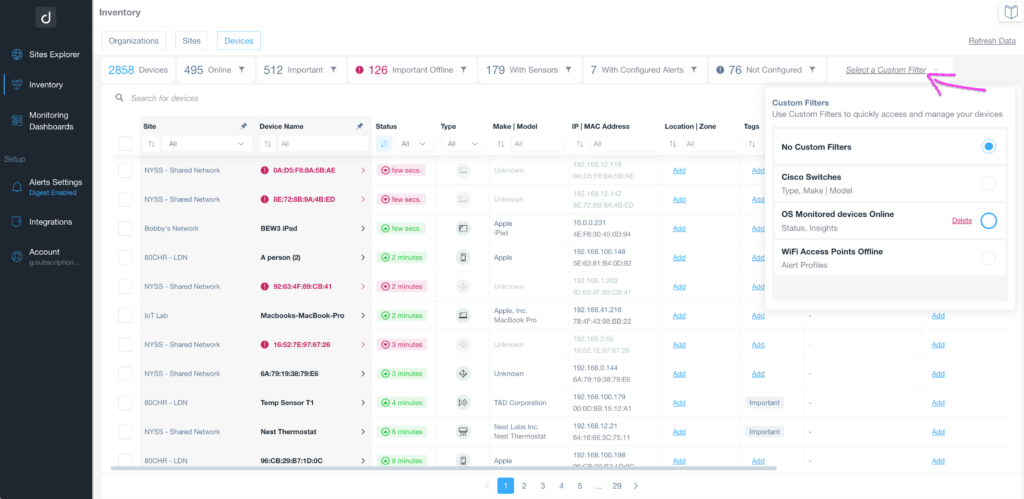
Our new custom filters make accessing and managing the data you need even easier! With our new Custom Filters functionality, you can save a list of the fields you’ve filtered and any rules to create your own custom filter.
The custom filters feature is available in both the Sites and Devices tab of the Inventory Dashboard. Once you have configured a set of customer filters on your list based on rules on multiple columns, press “Save Custom Filter” and give your specific rule a name:
Once you’ve saved a custom filter, you can quickly access the data you’re interested in without manually filtering each time.
This saves time and effort, especially if you need to access the same data regularly.
We plan to extend custom filters to other parts of the Domotz WebApp in the future, such as the Monitoring Dashboards and Tables, or for Alerting purposes. This will allow you to dynamically filter devices based on rules you define rather than static lists of devices.
For more information, visit the Custom Filters user guide.
We’re always looking for ways to improve Domotz, and we hope the new custom filters will make managing your sites and devices even more effortless. As always, we welcome your feedback and suggestions for future enhancements.
Monitor Microsoft Windows Services
We’re excited to share that you can now Monitor Microsoft Windows Services with Domotz. Leveraging the PowerShell command Get-Service, we created a Custom Driver script for monitoring your chosen services which run on a Windows Workstation or Server.
The scripts use the WINRM protocol to access the Windows machine. Our new script for monitoring Windows services enables you to monitor Microsoft Windows Services, check a service, check status, and start type.
Read the complete guide for getting started with Monitoring Microsoft Windows Services.
Monitor Crestron DM-NVX devices
We’re been waiting for this one for a while, and it’s now here! Now you can monitor Crestron DM-NVX devices through Domotz. There are lots of things you can do with this new integration, including:
- Check the Configuration of the Crestron DM-NVX devices you’ve deployed
- Monitor device mode, including (receiver/transmitter)
- Monitor streams and documentation properties
- See a preview of the streams you are monitoring.
- And more
You can monitor Crestron DM-NVX devices using our scripts. The scripts use the HTTPS Rest APIs to access the Crestron DM-NVX. Additionally, they have been validated and tested on the DM-NVX-360.
Read the complete guide for getting started with Monitoring Crestron DM-NVX devices.
Monitor Control4 Zigbee devices
Now you can monitor Control4 Zigbee devices through Domotz. You can do many things with this new integration, including quickly and proactively monitoring and managing Control4 Zigbee devices.
For each Zigbee device, you can monitor: id, SID, Status, Version, Product, Last Contact, RBoot, Node Type, and Best Zap.
The script uses the SSH protocol to monitor the Control4 Controller’s Zigbee devices.
Read the complete guide for getting started with Monitoring Control4 Zigbee devices.
Improvements
Possibility to Lock/Unlock the local Agent Web Interface
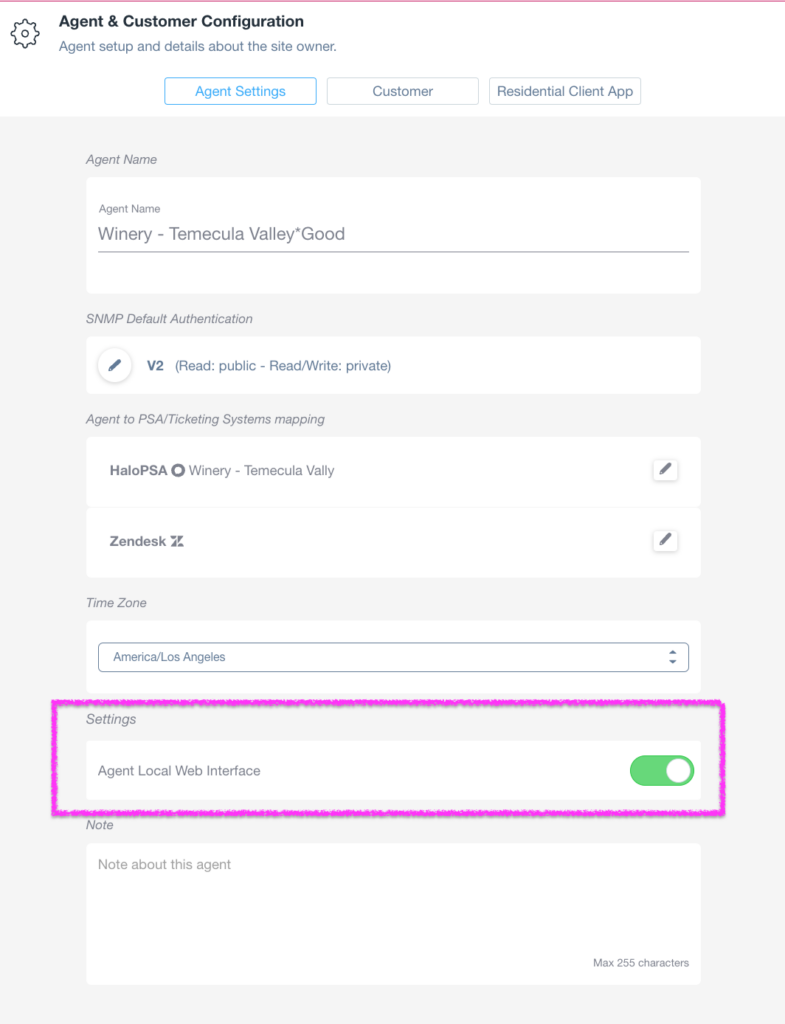
We’ve added a new feature allowing you to disable (lock) the local Agent Web Interface (usually on TCP port 3000 of the Domotz Agent device).
This feature was added in response to feedback from all of you! Moreover, it provides you with greater control over your Domotz experience.
By disabling the local Agent Web Interface, you can improve the security of your Domotz Agent by preventing other users on the same local network from accessing its information. To disable the local Agent Web Interface, navigate to the “Agent & Customer Configuration” tile and go to the “Settings” area. From there, toggle on the “Agent Local Web Interface” option to disable the service:
In case the Local Web Interface is needed at a later stage, you can re-enable (unlock) from the same configuration tab.
Possibility to unlock multiple devices with Active Directory Group Policy
We’re excited to announce that Domotz now offers a new feature that allows you to unlock the OS Monitoring capability on multiple devices simultaneously using the Active Directory Group Policy. This feature is available for Windows devices and leverages the WinRM protocol to manage and monitor devices remotely.
With this new feature, you can easily unlock the OS Monitoring capability on a group of devices without manually configuring each device (by unlocking each device with different credentials). This can save you time and reduce the potential for configuration errors.
To use this feature, create an Active Directory Group Policy that enables WinRM on the target devices. Once this is done, you can select multiple devices at once and apply the same set of “credentials” defined as a Group Policy:
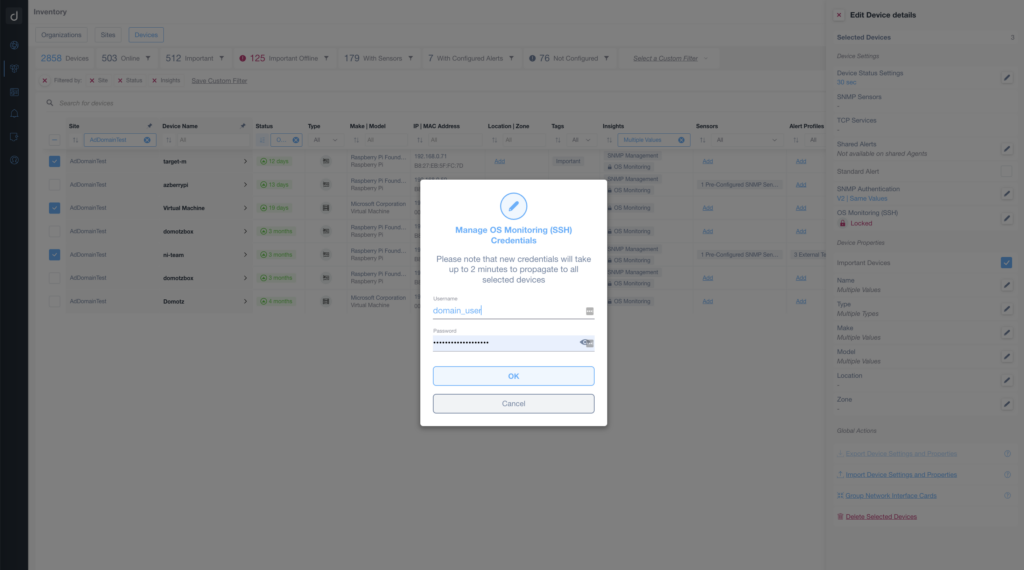
Then the OS Monitoring capability will be automatically unlocked on all devices that are target group members.
For more information, please visit Enable WINRM with AD (Active Directory) GPO (Group Policy).
We will further extend these features to unlock the Custom Integration scripts on multiple Windows devices.
We believe this improvement will benefit those of you who manage large fleets of devices and must deploy monitoring capabilities quickly and efficiently. Thank you for your feedback and for helping us make Domotz even better!
Extension of Custom Integration scripts Sandbox API
We’re excited to announce two new additions to the Custom Integration scripts sandbox in Domotz. These additions include the Crypto library and the D.Buffer API, which provide expanded data processing and analysis capabilities.
The Crypto library enables you to perform cryptographic operations within your Custom Integration script sandbox. Cryptographic operations include encryption, decryption, and other security-related functions that help ensure the integrity and confidentiality of sensitive data.
The D.Buffer API provides a new way to store and access data within the Custom Integration script sandbox. This API enables you to create and manage buffers to store data for later use in processing and analysis.
To use these new functionalities, modify your Custom Integration scripts to incorporate the Crypto library and/or the D.Buffer API as needed. With these additions to the Custom Integration scripts sandbox, you can perform more advanced data processing and analysis directly within Domotz.
For more information, please visit the Domotz Custom Integration Scripts documentation.
We believe these improvements are helpful for those of you who need more advanced data processing capabilities within your Custom Integration scripts. Moreover, they are especially beneficial in enhancing data security and management.
Added support for OpenWRT and Proxmox
We’re excited to announce that we’ve added support for two new environments for installing a Domotz Agent: OpenWRT and Proxmox. These new environments provide even more flexibility for installing and managing Domotz Agents.
To start installing the Domotz Agent on an OpenWRT system, follow the guide available at OpenWRT (x86-64). This guide outlines installing the Domotz Agent using Docker on an X86 system. We also have the IPK packages for other architecture (including bcm53xx and octeon). For more information, please get in touch with our Support.
Similarly, to install the Domotz Agent on a Proxmox virtualization system, please follow the guide available at Proxmox. This guide provides detailed instructions for installing the Domotz Agent on Proxmox, including how to create a new virtual machine and install the Agent within it.
We believe these improvements benefit those of you who must install the Domotz Agent on various systems and environments. These improvements also benefit those of you with limited hardware resources.
Navigate directly to Important Devices offline from the Inventory dashboard
We’ve made some enhancements to the Inventory Dashboard that we think you’ll love! You can now easily navigate to your important offline devices directly from the Inventory Dashboard (from the Sites tab).
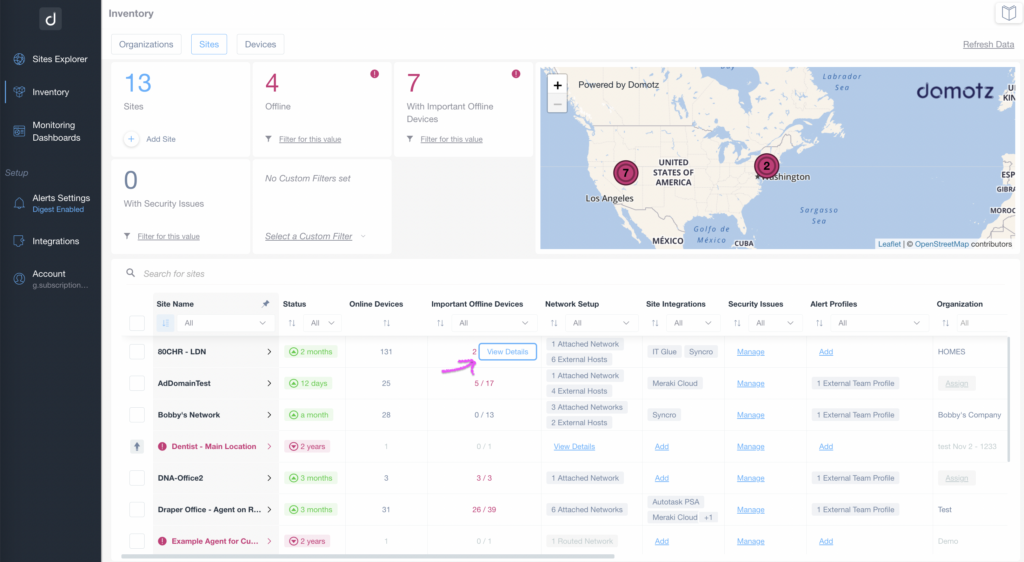
This new feature allows you to quickly identify and troubleshoot any important devices that are offline or experiencing issues, without navigating to multiple screens. It’s a simple but effective improvement that we believe will save you time and effort in managing your Domotz devices.
Support for TFTP for Configuration Management on Watchguard and Fortigate
We have added support for TFTP protocol for the Configuration Management feature in Domotz!
The TFTP has replaced the legacy protocol used by Domotz for Configuration Management on Watchguard and Fortigate devices (based on cli connectivity). This change ensures that configuration file backups are executed reliably, even for large configuration files on big installations.
With the new TFTP protocol support, you can perform configuration backups without worrying about potential issues that may have arisen with the legacy protocol. This improvement enhances the reliability and performance of Domotz’s Configuration Management feature, providing you with greater peace of mind when managing your WatchGuard and Fortigate devices.
New graph engine for time-based graphs
We’ve introduced a new graphical engine for time-based graphs, which offers several enhancements over the previous engine.
These include:
- Zooming: it’s now possible to zoom in on a specific graph area for a closer look at the data.
- Proper rendering of legend: the legend for each graph axis is now properly rendered for improved readability and clarity.
- Sophisticated scenarios: this new engine allows our team to build more sophisticated scenarios in the future. For example, we’ll be able to keep track of threshold lines directly in the graph, represent different values on the same graph, and add multiple Y axes.
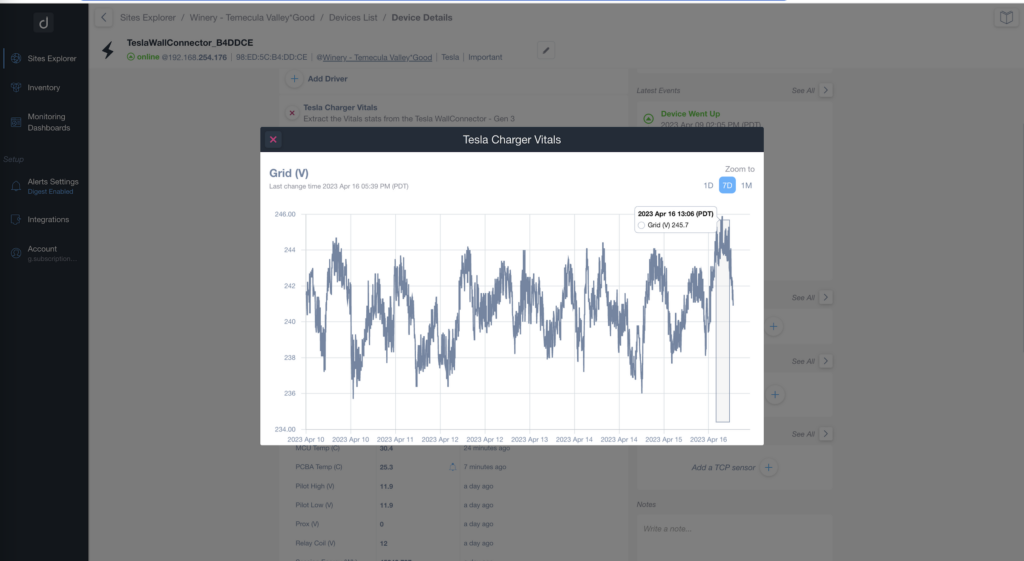
This new graphical engine is available in the Monitoring Dashboards and tables, and in device details data (for the variables supporting the historical graphs).
These enhancements will help you better analyze and interpret your data, giving you more flexibility and control when working with time-based graphs.
Allow more than 300 devices in a single monitoring table
We’ve extended the support for creating monitoring tables (within the Monitoring Dashboards) to more than 300 devices. Now, you can add up to 3000 different devices to a single monitoring table, effectively increasing the capability of each monitoring table by a factor of 10.
Please note that if you’re using SNMP PreConfigured tables or Custom Integration script data with data configured as tables, each monitoring table can now contain up to 3000 times the cardinality of the SNMP PreConfigured or the Custom Script data structure.
In the future, we’ll also introduce the ability to create dynamic tables by defining the rules for filtering devices rather than statically identifying the devices at the time of table creation.
This improvement will give you more flexibility when creating and managing monitoring tables and allow you to monitor more significant numbers of devices more easily.
Allow multiple Admin accounts
Our support team is now capable to add more than one user as an Admin of an entire account. This allows you to add multiple users to manage an account and perform administrative tasks. This update provides you with more flexibility and allows for better collaboration within your team.
Currently, this feature is only available by contacting our support team. We’re working on adding a self-service option, so in the future, you will be able to add multiple Admin accounts on your own.
We believe this improvement will enhance your account management experience and make it easier for your team to work together efficiently.
Additional MIBs available in the Domotz Database
Additional MIB files are available for the following devices. Additionally, you can search for their OIDs from Domotz:
- Ruckus
- BGP42V
- Lexmark
- Netonix switches
- ROOMALERT12E
- CM-Aura
Fix
We’ve fixed the following issues:
- Fixed control of Wattbox WB10 in the set/cycle controls due to a change on their latest firmware version.
- Fixing an Agent issue preventing the execution of the Speedtest when the device hosting the Domotz agent restarts
- Fixed an issue on the local Web Interface of the Domotz Agent hosted on the Domotz Box, which was allowing the Network Identifier (*.*.*.0) and Broadcast Address (*.*.*.255) as the IP address of the Box itself.
- Fixed an issue causing the Domotz Agent on Windows servers to restart when unrecognized configurations were identified on top of the Onvif protocol (IP-based cameras).
- Fixed an issue causing the Agents with the “Big Network” capability (to scan up to CIDR /16) to restart and flap intermittently.
- In some cases, the padlock icon was wrongly reported also on already unlocked devices.
- Fixed an issue causing the Inventory Dashboard to report the Site names with incorrect behavior.
- Fixed an issue causing the Agent Map (in the Sites Explorer) to report Agents outside the map (on the default zoom setting).
- Fixed an issue that was causing the Domotz App and WebApp to be stuck on loading an Agent page, if one of the backend API calls was failing.
- Fixed an issue that was causing a long wait time in the representation of the Network Topology map on some Domotz Agents.
- We have now introduced the support for Syncro creation of assets in bulk mode, which avoids the issue with rate limits when creating multiple assets at once.
- HaloPSA integration (for Ticketing System) was broken when the user was in trial mode on HaloPSA.
Known limitations
- There is no central repository for all the alerts configured on SNMP PreConfigured, OS Monitoring, and Custom Integration driver sensors.
- Monitoring Dashboards are currently limited to Monitoring Tables as Widgets.
- Luxul Router-based Agents do not support VPN on demand. To elaborate, we’ll add this capability as soon as Luxul’s team provides us with the required API.
- You can’t configure the static IP address on the Domotz Box before configuring the Agent.
- Lastly, you can’t leverage DHCP on additional VLANs on the Domotz Box.
To conclude, these release notes cover the changes in the Domotz Pro service since the previous one. Furthermore, these changes include Domotz Pro cloud, Domotz Agent, and Domotz Pro App.
Lastly, to learn more about our network monitoring software or our Know Your Networks Blog.