Domotz Onboarding Guide: Setting up Domotz within your Free Trial Period
Purpose of the Domotz Onboarding Guide
The Domotz Onboarding Guide will help you deploy Domotz in your network quickly and efficiently, with the purpose of evaluating the Domotz service during the trial period (POC).
Once deployed, you will be able to:
- Discover all the devices on your network
- Choose the devices to monitor
- Get a network topology
- Create/Manage Alerts on your network devices
- Connect remotely to your devices without the need of opening ports on your router or install specific software on them
Note that this article on focuses on a quick set-up for testing purposes during the trial phase. It assumes the account owner is configuring the system and no team members are added. We hope you enjoy the Domotz Onboarding Guide!
How Domotz Works
When getting started with Domotz, it’s important to know what we do. Domotz is a cloud-based service that continuously and securely communicates with a network collector. The cloud service is where information about the network you are monitoring is stored and accessed. Accessing your network information is done through the Domotz application, which can be hosted on Windows or Mac OS, as well as your favorite web browser, or even iOS and Android mobile devices.
As a cloud-based service, you’ll first need to create an account. Next, install a Collector on the network you want to monitor. Finally, configure both the application and the Collector to take full advantage of all the features Domotz offers.
How to get Started with Domotz
Step 1) Domotz Account Creation
Visit https://portal.domotz.com and click on “Sign up”:
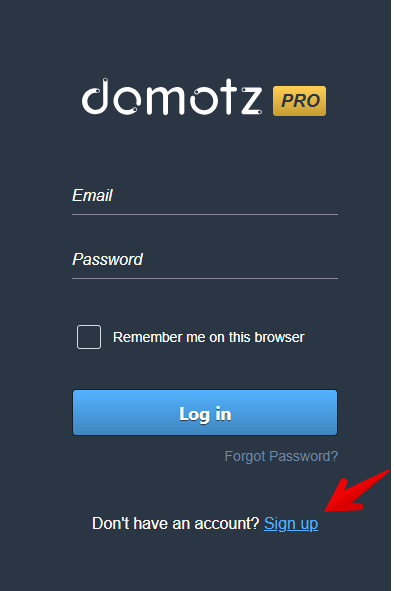
To register and fill in the mandatory fields: provide an email address, which will serve as your login, and secure your account with a strong password:
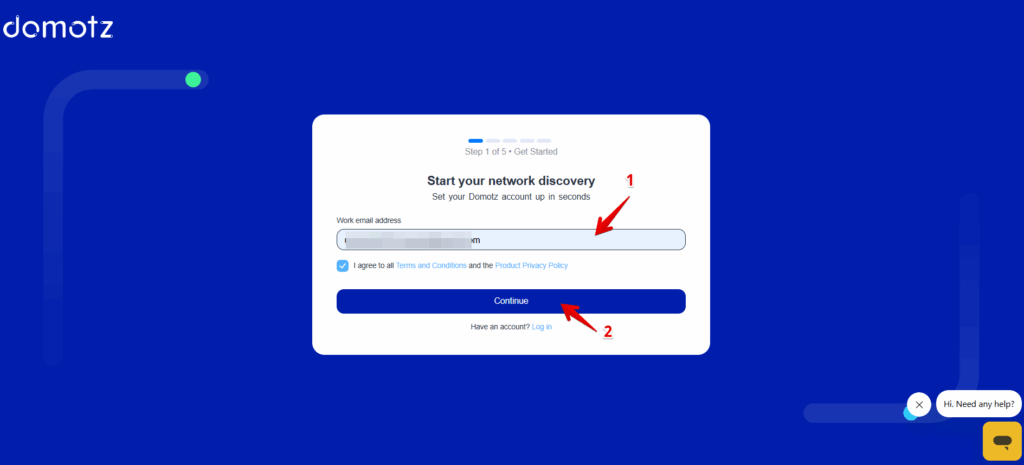
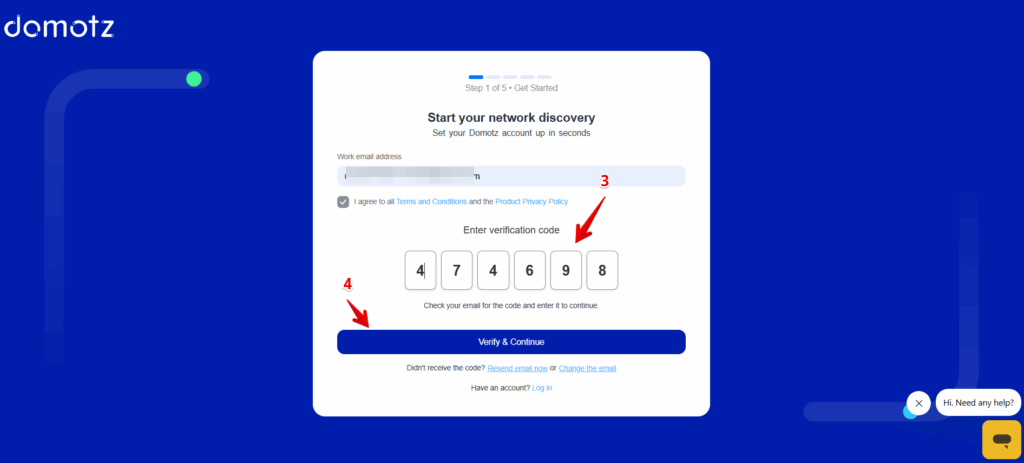
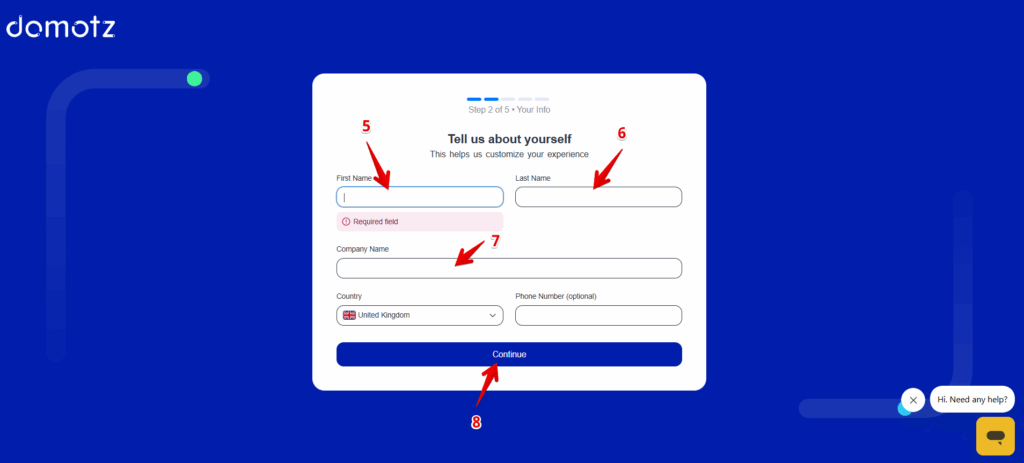
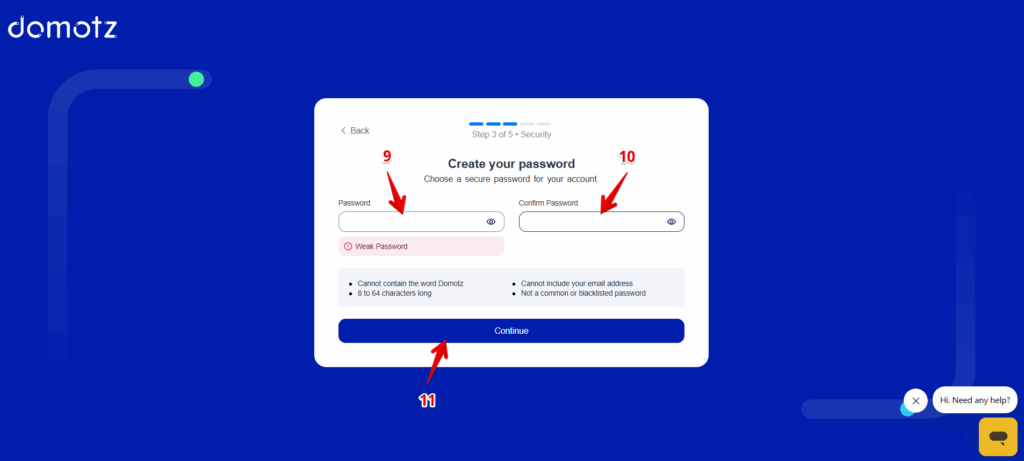
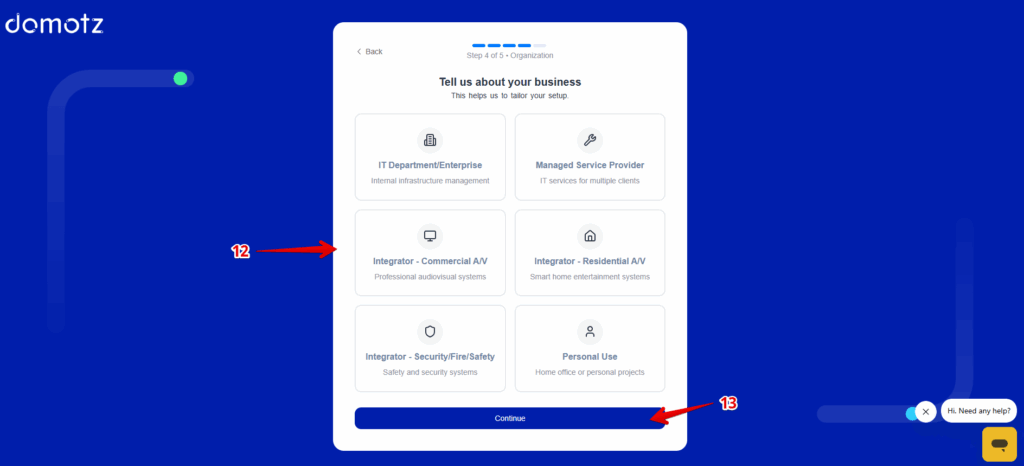
At this point, your account has been created and you will be automatically logged into your Domotz Webapp portal. You can always return to this page by visiting portal.domotz.com/webapp/.
The next step is to install your Domotz Collector.
Step 2) Installing your Domotz Collector
In order to monitor your assets with Domotz, you need to install a Collector on your network. The Domotz Collector is a light-weight software which can be installed on various Operating Systems. The Domotz Collector receives commands from the Domotz cloud service to scan, monitor and connect to systems on the network. It is important to note that this Collector will scan the network that it is associated with. For instance, if you install the Windows Collector on a PC, the the collector will scan the network(s) the Window’s PC is currently attached to.
Once you complete the account creation, you will be redirected to the page where you can download your Collector. Select your operating system and follow the installation instructions.
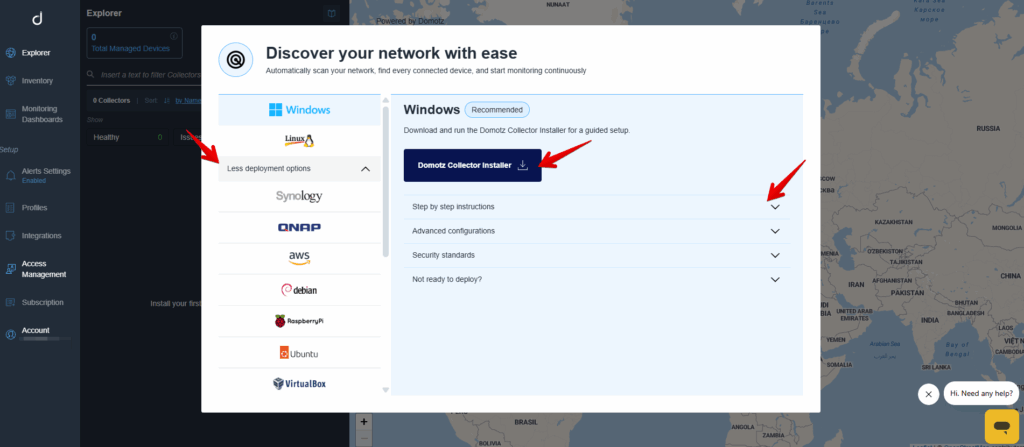
For simplicity, this guide will go through the process of installing the Windows Collector. Instructions for other Collector types are available on the “Add New Agent” page within portal.domotz.com.
Windows Collector Installation
- Click on the “Download Collector Installer” button
- Install the downloaded file and follow the Domotz Collector Setup wizard:
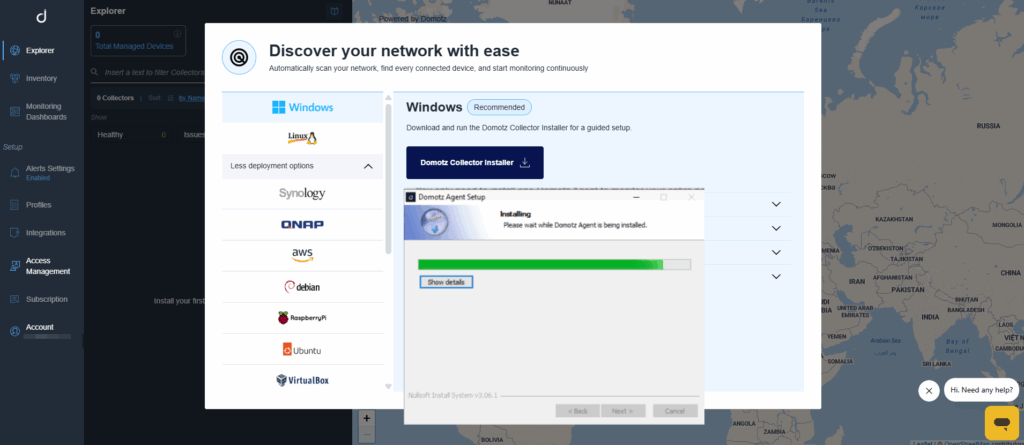
After the Domotz Collector is installed, the Windows service should start automatically, directing you to a browser window to complete the association to your account. The Domotz Collector can be accessed through port 3000 on the host where you installed it. The installation process should open a browser window automatically and direct you to port 3000.
Once you are on the Domotz Collector page, you will need to log in with your username and password, which you created in Step 1. This process associates your Collector to your Domotz account.
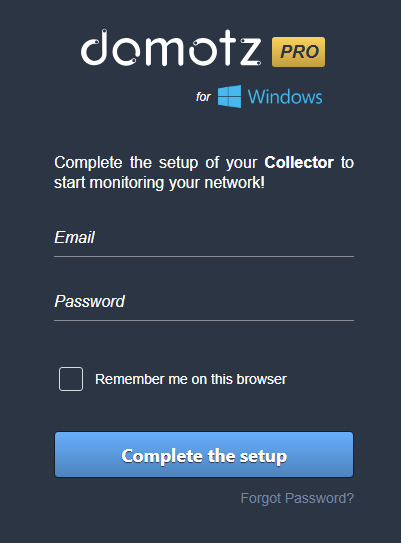
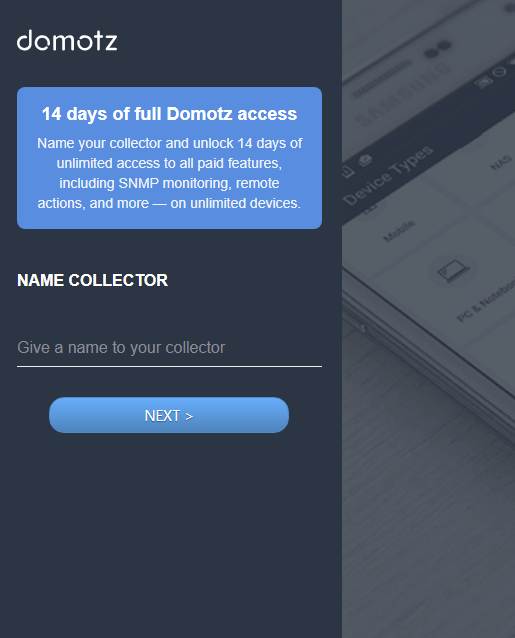
Give your first Collector a name and click Next:
Set a Default SNMP Credentials and click on Start Scanning Network:
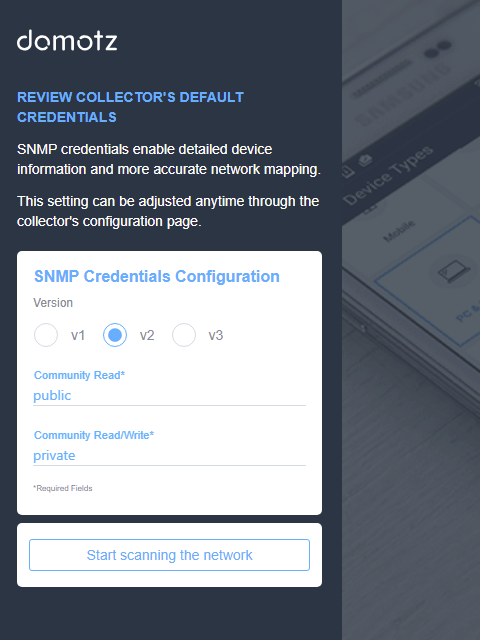
At this point the Domotz Collector will start scanning your network.
Step 3) Configuring the Domotz Collector
Device Discovery
Upon activation, the Domotz Collector will begin its initial scan of the networks associated with its host. Please wait a few minutes for the initial scan to complete. The time needed for each scan varies depending on the size of the network and the number of devices on that network.
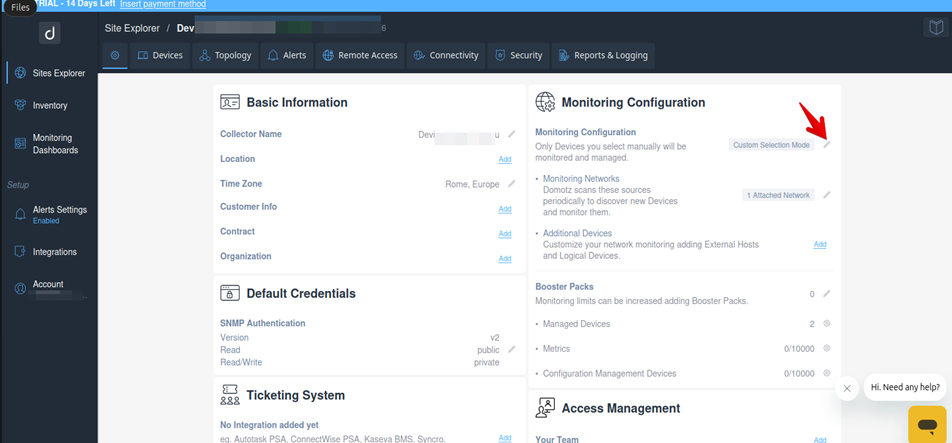
To select devices for monitoring, navigate the Collector Settings menu, under the Monitoring Configuration, click on the edit icon:
Here, you’ll see all discovered devices listed under the Discovered Devices section. Select the devices you intend to monitor and click Add. The selected devices will then move to the Managed Devices section:
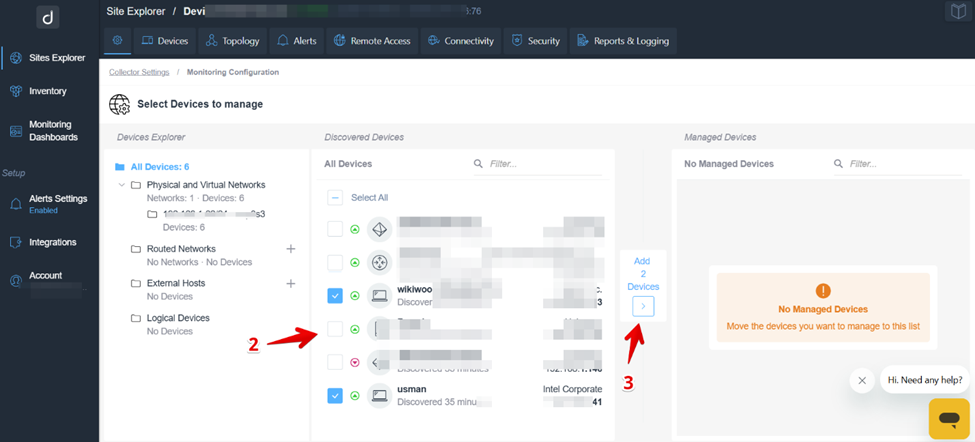
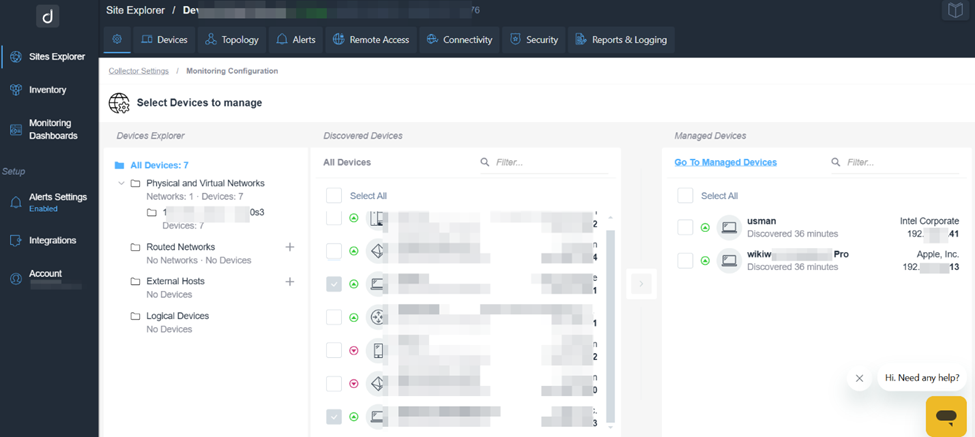
You can add or remove managed devices at any time to adjust your monitored devices list.
For further details on managed and unmanaged devices please visit: https://help.domotz.com/uncategorized/managed-vs-unmanaged-devices/
Setting up SNMP on Network Managed Switches
In order to be able to view your site Network Topology map, you need to enable SNMP on all your managed switches.
Each brand/model has a specific way to set this up, but it is normally done through the device’s web-based graphic user interface, or from the command line.
Note: If you do not have local access to the managed switch configuration interface, you may be able to use Domotz Remote connections to connect to each device (using HTTP or SSH) in order to configure them.
View Topology Map
After enabling SNMP for each Managed Switch and if your managed switches are RFC4188 compliant and/or LLDP compliant, Domotz will be able to create your site’s Network Topology Map. This can take several hours depending on the complexity of the network.
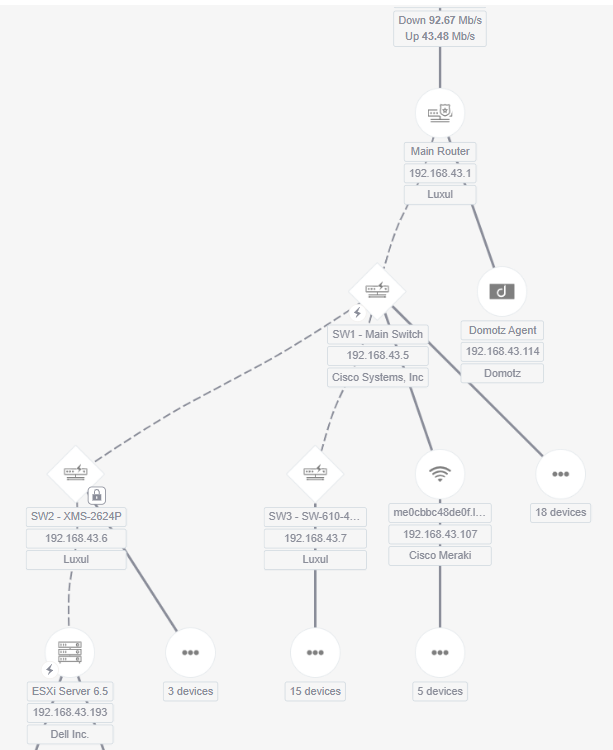
Switch Port Traffic and PoE capabilities
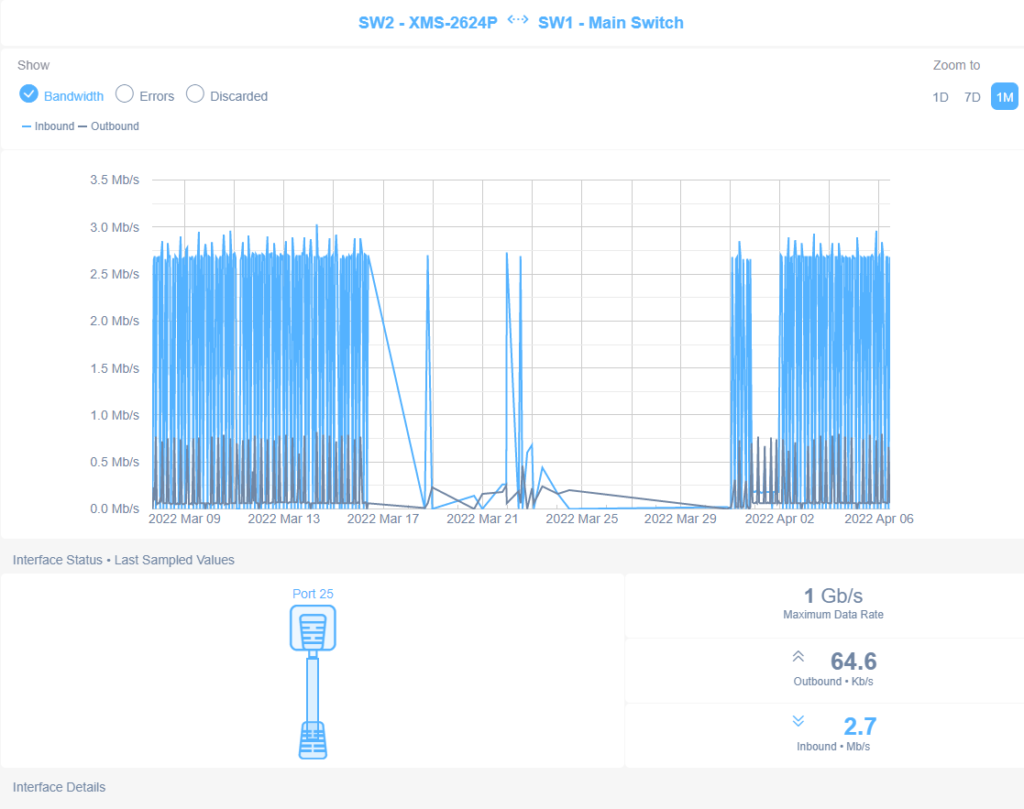
Also, using SNMP data, Domotz can collect detailed information on each port within the managed switch, so you can monitor the site’s network traffic:
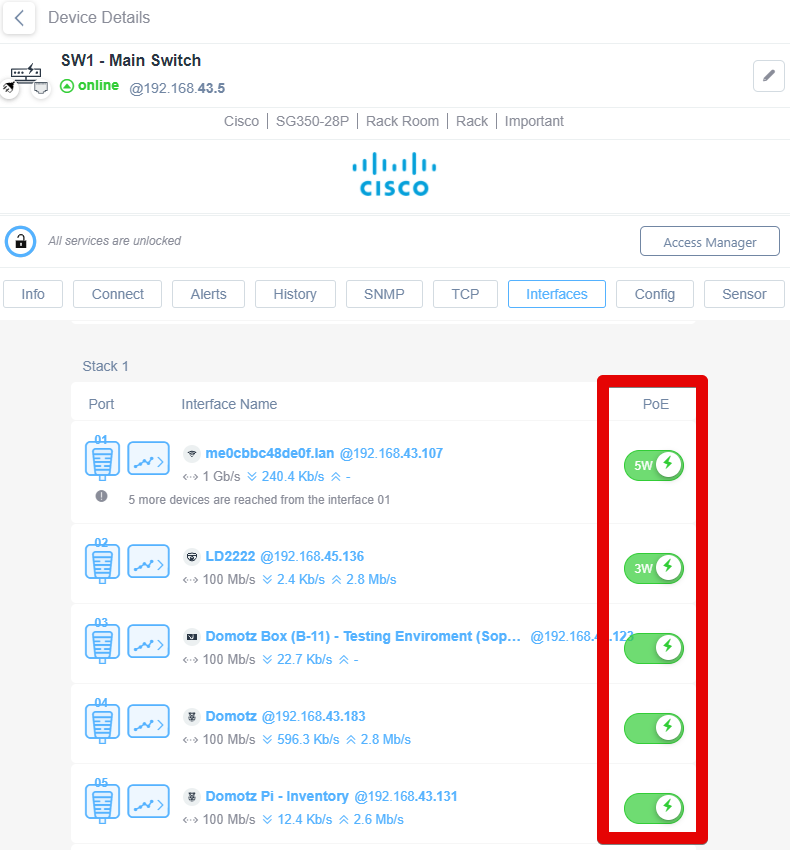
And, if you are using a PoE Switch, you will be able to monitor and control power to each port:
SNMP Pre-configured sensors
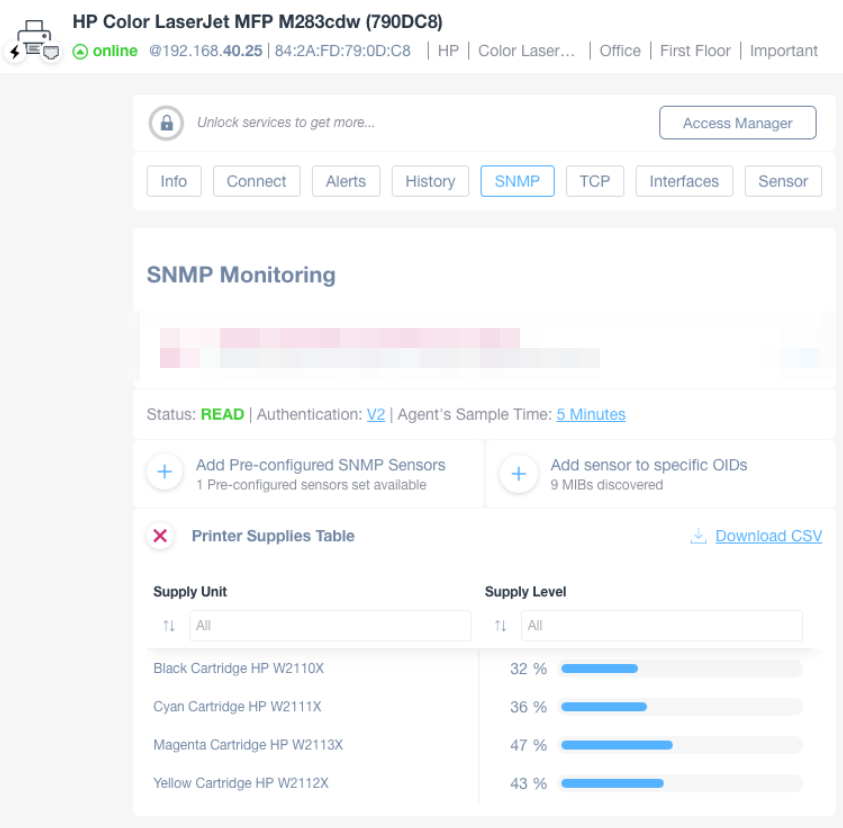
Enabling SNMP on other types of devices, such as Printers, NAS, and UPS will allow you to apply Domotz Pre-configured sensors on them to monitor them.
You will find the pre-configured sensors available under the SNMP tab within each device as appropriate.
Setting up your Domotz Alerts
It is likely that one of the main reasons you are onboarding Domotz is so that you can receive notifications (alerts) when something is not working as expected on your network.
Domotz has two different ways to send alerts, the “Personal Alerts” and “Shared Alerts”.
The main difference between the two is that Personal Alerts are user-based and support only email and Domotz mobile app push notifications, whereas Shared Alerts are team-based and support a wider range of integrations, including ticketing systems, as well as email and webhooks.
For the purpose of quickly setting up a Domotz Collector during your trial, we will focus on the Shared Alerts that is created by default with your account.
Monitoring your Domotz Collector
When you sign up for Domotz, your account is automatically created with the Network Monitoring shared alert profile configured using your email address as the contact channel.
New collectors will be automatically assigned to this Network Monitoring profile.
You can review or customize this profile by navigating to Alerts Settings, then clicking Edit on the Network Monitoring profile.
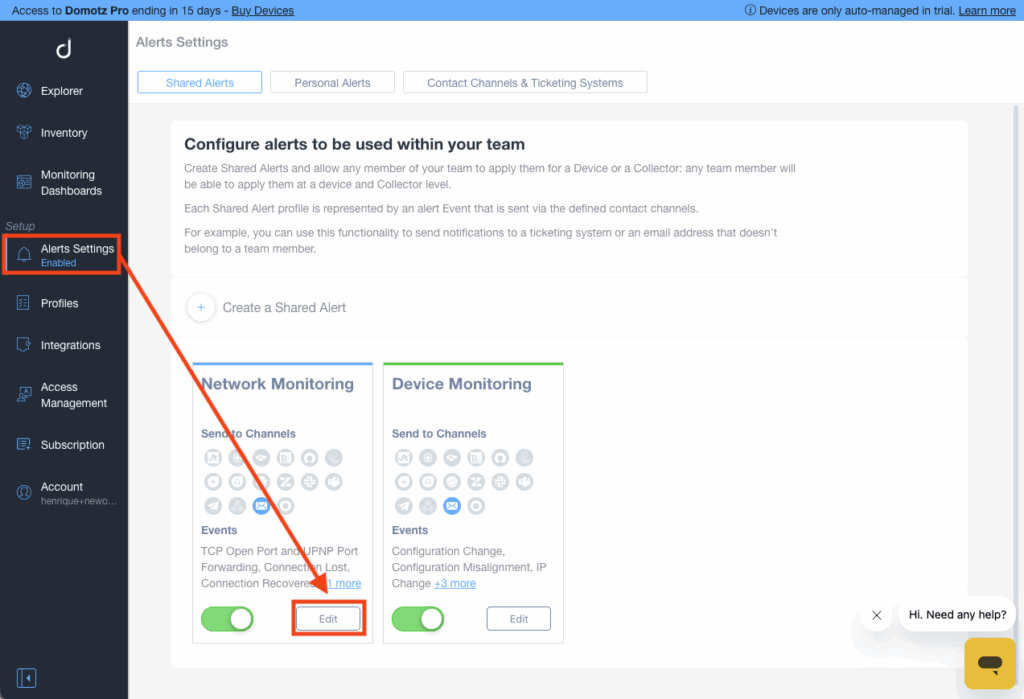
With this profile enabled by default, you will receive email notifications (sent to the email address you use to log in) when the following events occur:
- Connection Lost
- Connection Recovered
- Public IP Change
- TCP Open Port and UPnP Port Forwarding
For more details about Network Alerts, please refer to this article: Network Alerts.
Monitoring a Specific Device
When first creating a Domotz account, you will automatically have the Device Monitoring shared alert profile configured using your email address as the contact channel. This profile is not applied to any device automatically.
This profile includes the following events alerts:
- Device Goes Up
- Device Goes Down
- IP Change
- TCP Events
- Configuration Change
- Configuration Misalignment
You can review or customize this profile by navigating to Alerts Settings, then clicking Edit on the Device Monitoring profile.
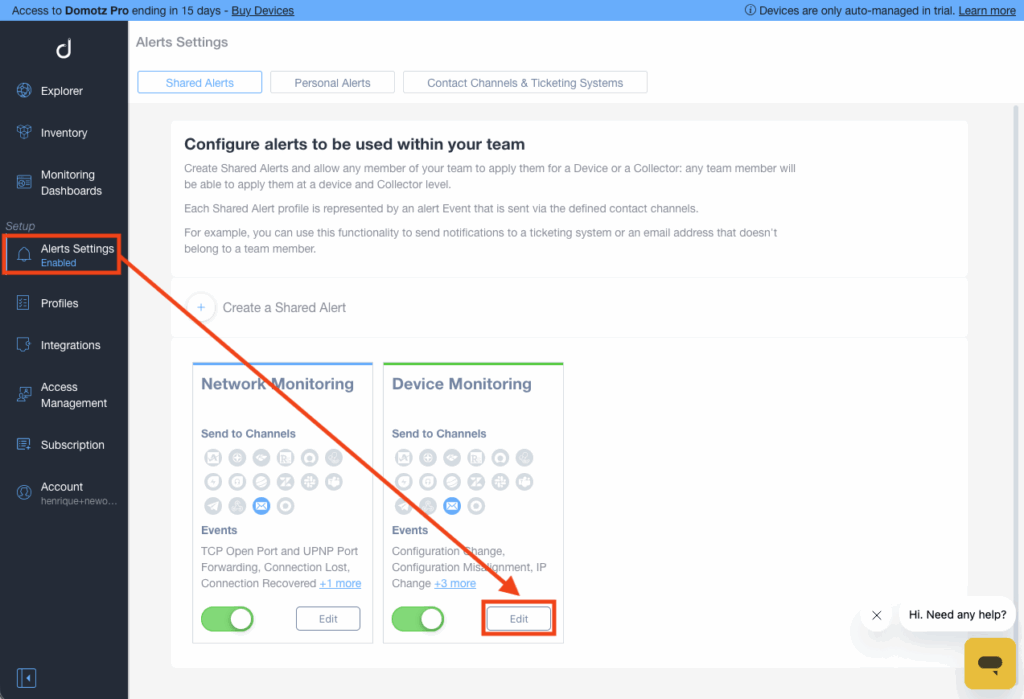
This profile is not applied to any device automatically. To manually apply it and start receiving event alerts. To manually apply it and start receiving event alerts on your configured contact channels, select a managed device from the Collector Devices List or from the Inventory section. Use the device Quick View panel on the right side to apply the Shared Alert Profile called Device Monitoring.


For more details about Device Alerts, please refer to this article: Device Alerts.
Creating a Remote Connection
Finally, it is worth mentioning that you can remotely connect to all discovered devices in your network which expose at least one open port (service) to which you can connect.
For simplicity, we will focus on making a simple, direct connection to a device’s webpage.
To see the list of those, enter the “Remote Access” section:

From this view you will be able to get a list of the available devices to which to can connect to, and also to search for the service you might need, based on service protocol or device properties (Name, IP Address, MAC Address, Model, Location, and Zone):
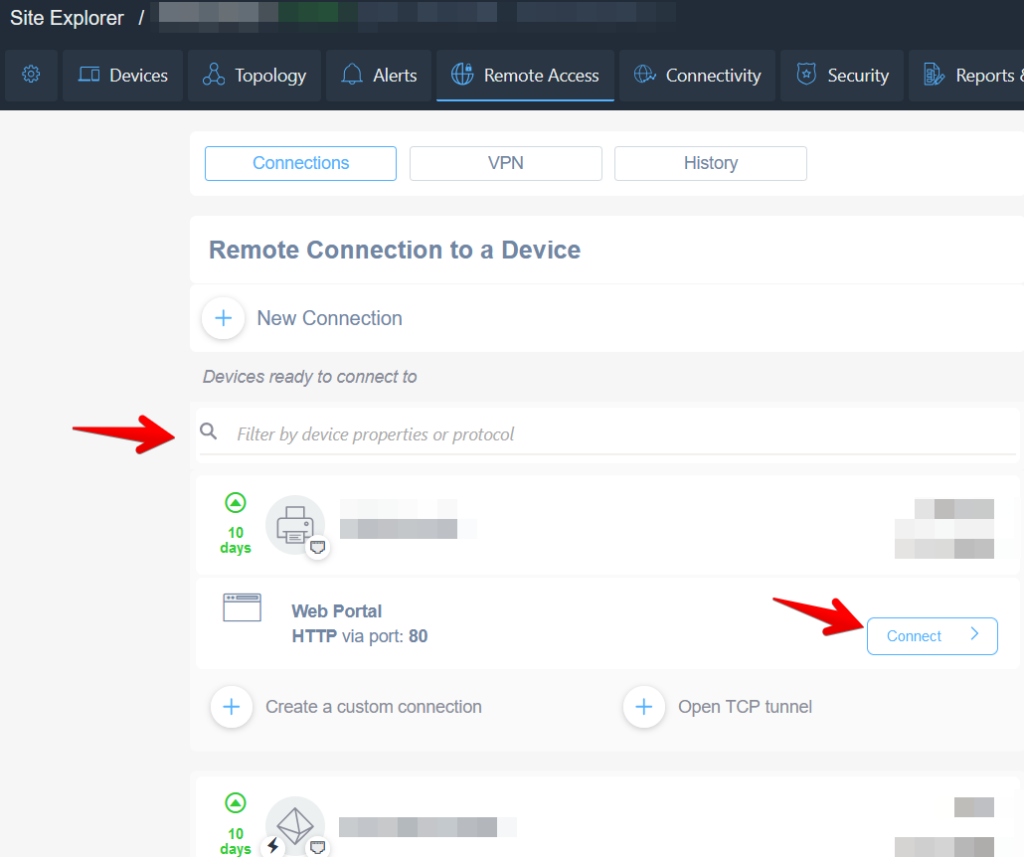
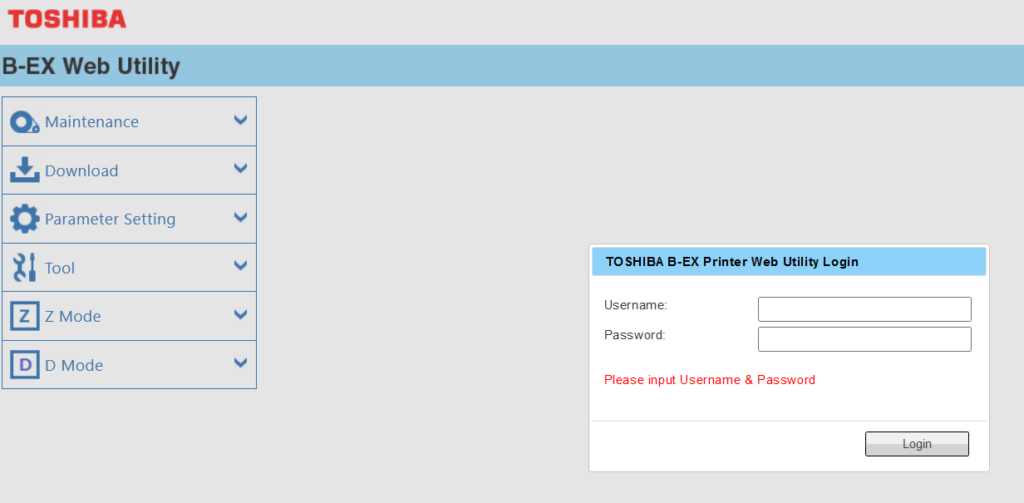
And after clicking on the “Connect” button you’ll be redirected to the device login (in this case a web interface, since we clicked on port 80 of this Toshiba printer):
We hope the Domotz Onboarding Guide was useful. Learn more about Domotz on the website and our blog.
If you have any questions or need assistance, the Support team will be always happy to help at support@domotz.com!

