Introduction
The Inventory view is the default landing page when you open the Domotz WebApp or the Domotz Desktop App.
The Inventory view helps you to:
- Get a quick and complete overview of all your monitored Sites (Domotz Agents) and Devices
- Search across all your Sites and Devices
- Select multiple Sites or Devices to edit and apply common properties and settings
- Bulk export or import the settings of a Device to multiple other Devices at one time
- Bulk delete Devices you choose
- Add/edit a Site’s Customer details and manage your Sites grouped by Customer
- Review and manage configuration across multiple Sites
- Review and manage the configurations for multiple Devices across multiple Sites
- Introduction
- Sites (Domotz Agents)
- Devices
- Custom Filters
Sites (Domotz Agents)
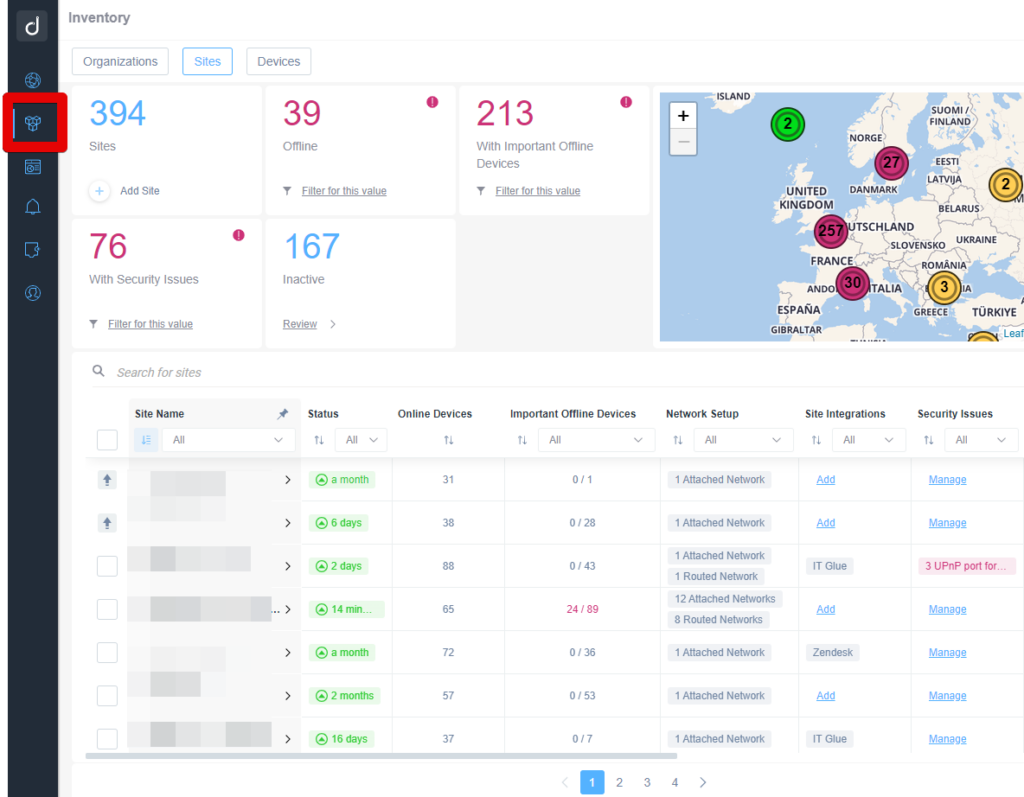
The “Sites” section within the Inventory view, is very useful for obtaining an overview of all your Domotz Agents along with Customer information.
At the top left of the screen you will be able to see a quick report on the status of your Sites:

The following details are highlighted:
- Total Number of Sites Monitored
- Number of Offline Sites (which means the Domotz Agent is not communicating with Domotz Cloud)
- Number of Sites With Important Offline Devices
- Sites with Security Issues
- Geographical localization of your sites
At the bottom of the page, you will be able to search/access/manage/view detailed information about your Sites in a tabular format:
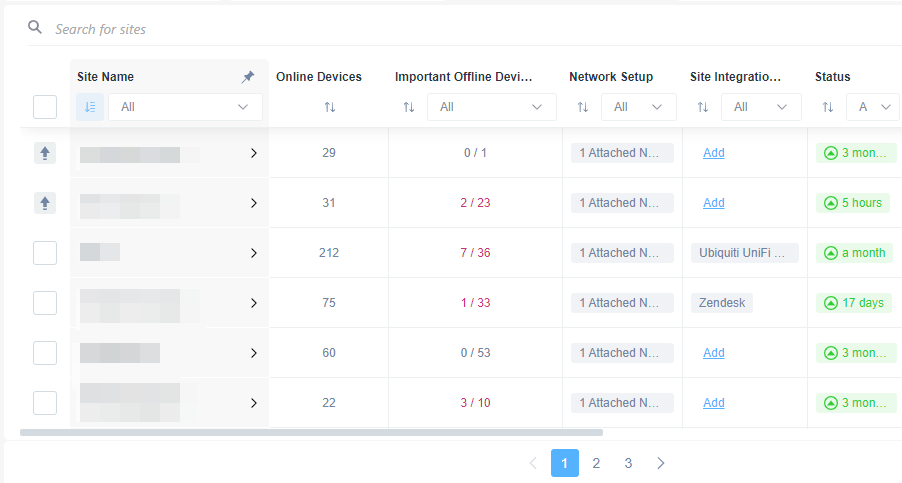
Each row is a Site (Domotz Agent) and for each row the following columns are available:
- Site Select Column (checkbox)
- Site Name
- Number of Online Devices
- Number of Important Devices Offline
- Network Setup|
- Site Integrations
- Agent Status
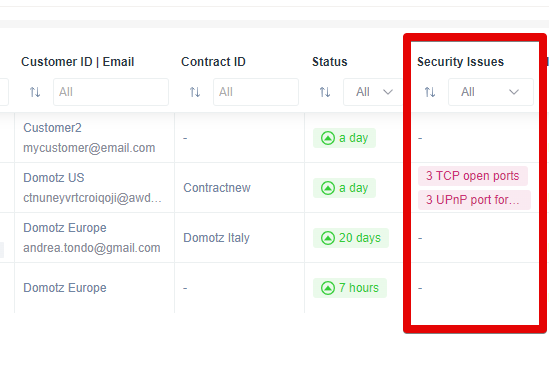
- Security Issues
- Alert Profiles
- Customer ID / Email
- Contract ID
- Agent Platform
- Agent Internal IP/Mac Address
- Agent Deployment Date
- Agent License Owner
- Actions
Each column can be used for searching or refining a search with sorting options. Additionally, the table has column sorting options.
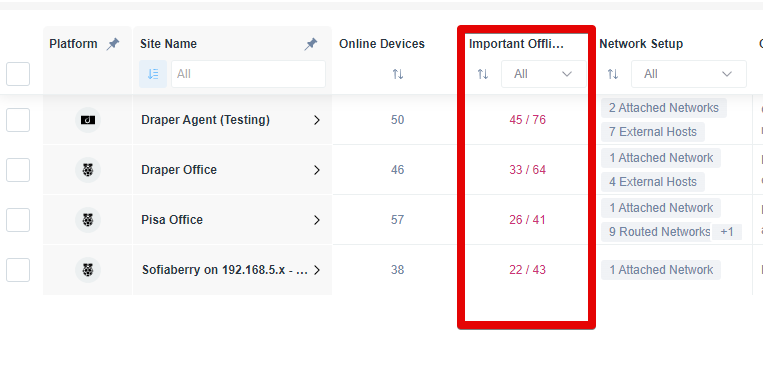
Columns also contain structured information (for example you can see the number of possible Security Vulnerabilities discovered on each site):
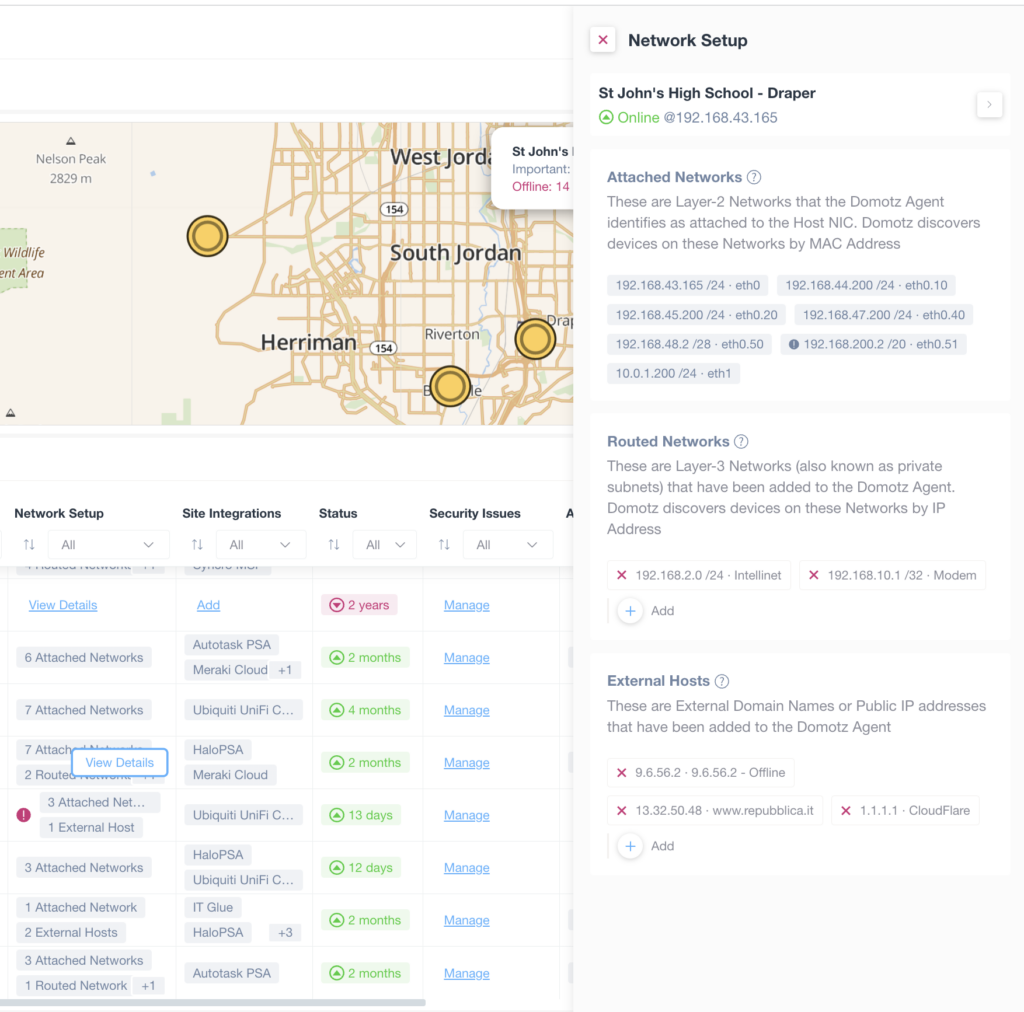
Additionally, you can inspect each Site’s network configuration details. We display VLANs/Network attached, Routed Networks, External Hosts, etc.
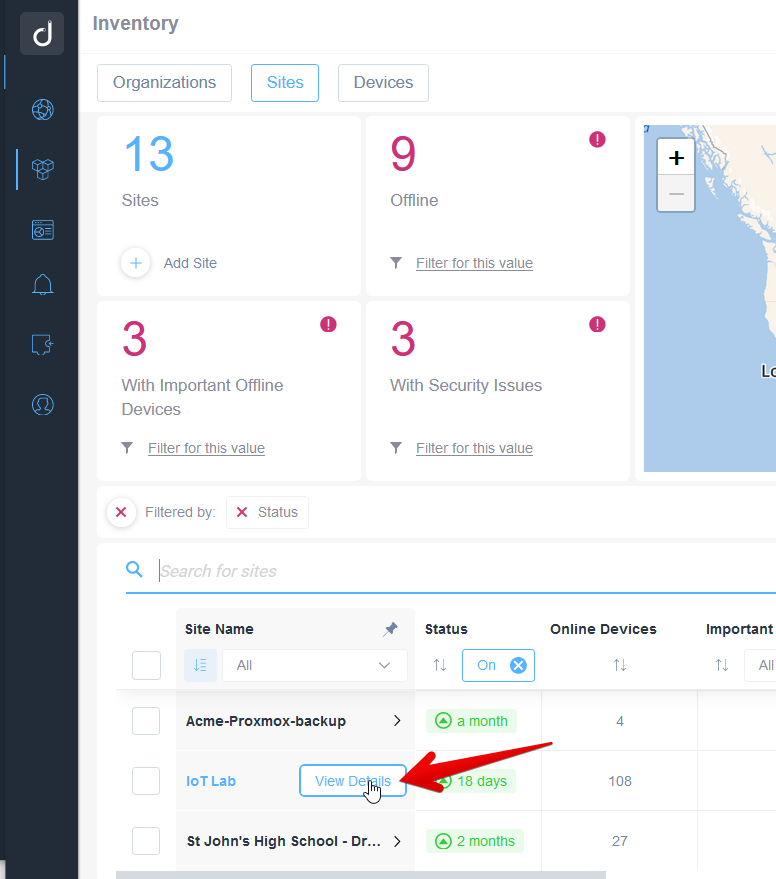
When clicking on the name of a Site you will be able to access to the Domotz Agent dashboard, and from there you can then access to all the Agent capabilities. For example; The device list for that Agent, Network Info, Network Security, etc.
Devices
First of all, the Devices view is useful to search and manage all your devices across all of your Sites.
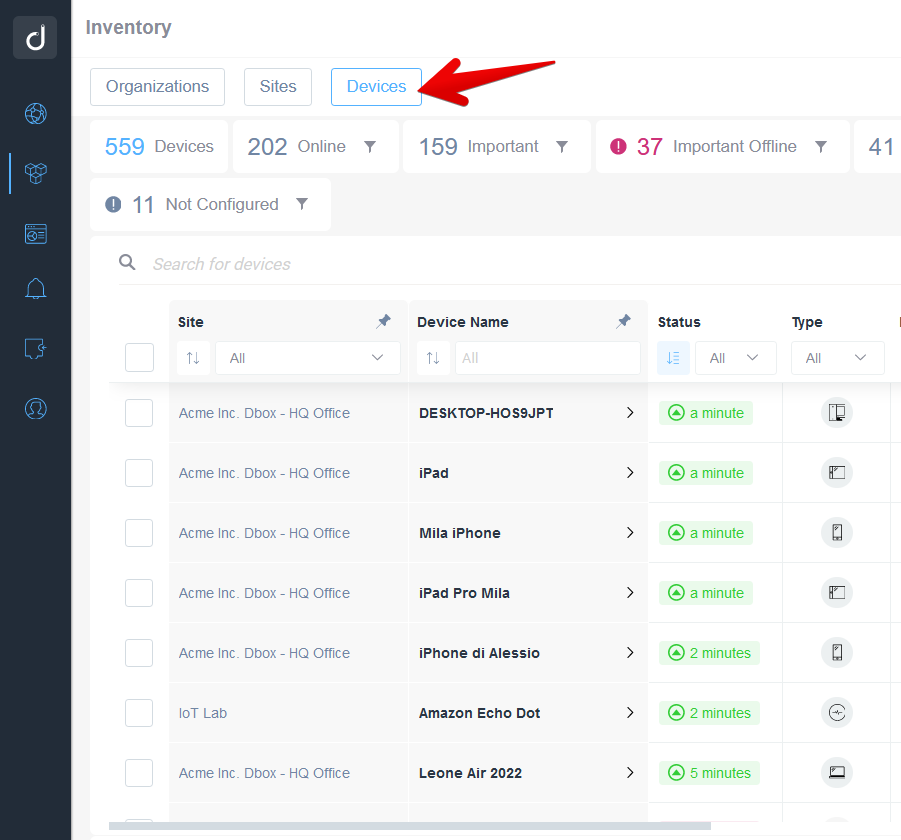
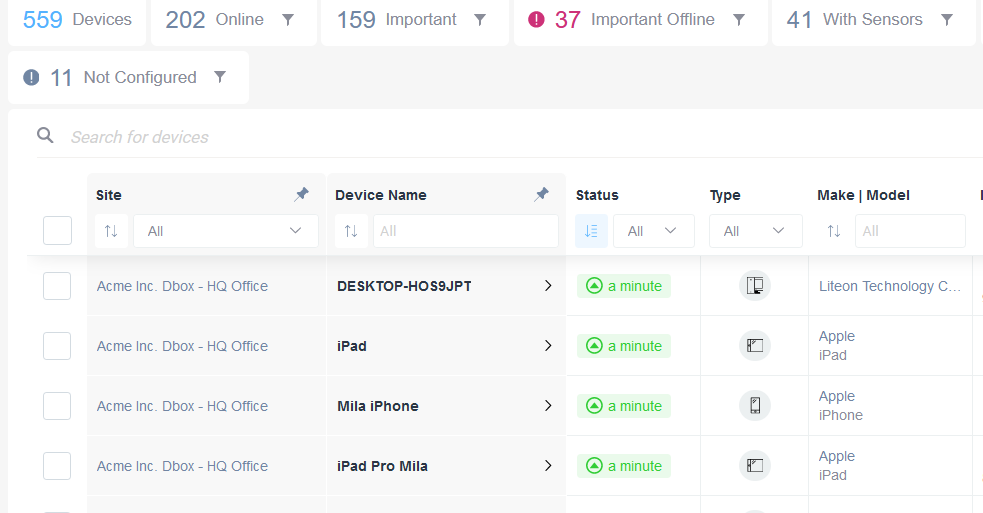
At the top of the page you’ll get an overview of all your devices:
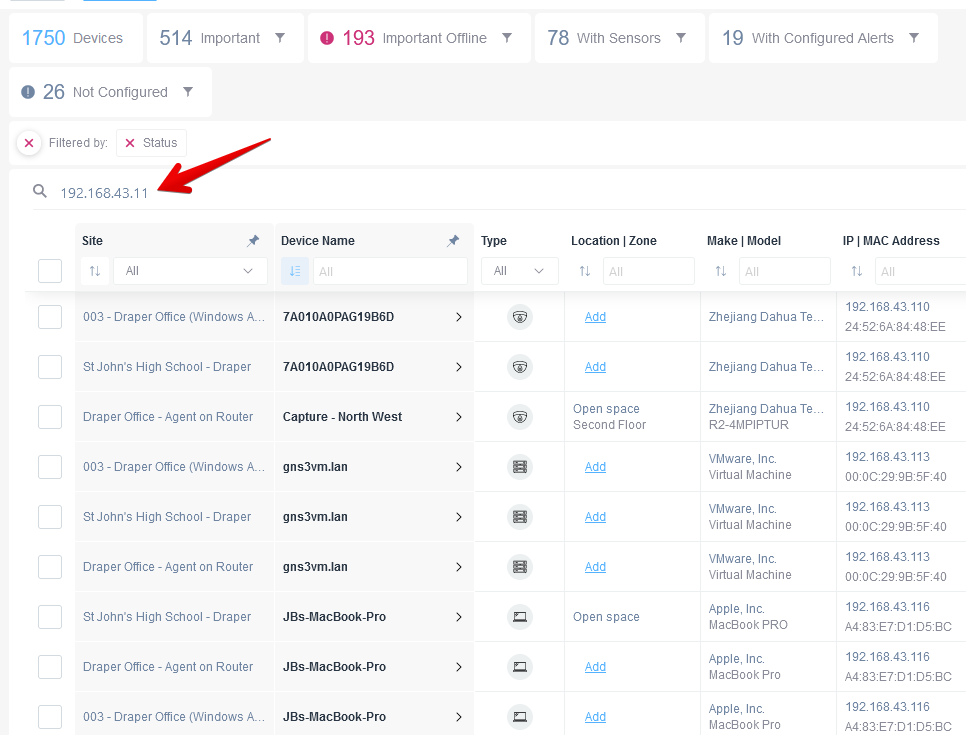
Using the “Search for devices” text-box, you can filter the following fields: Name, IP Address, MAC Address, Model, Location, Zone:
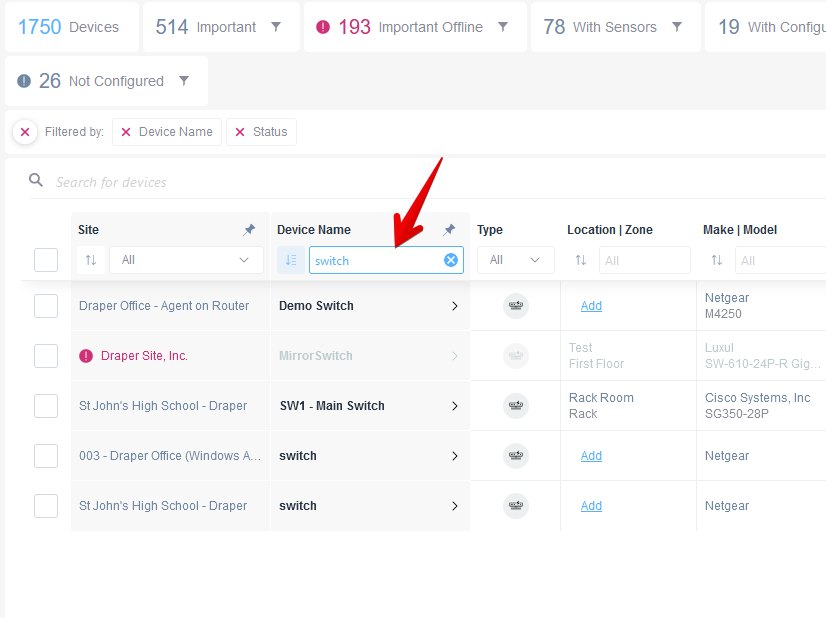
Additionally, you can also filter the results of a specific column:
Editing Settings and Properties of multiple agents/devices
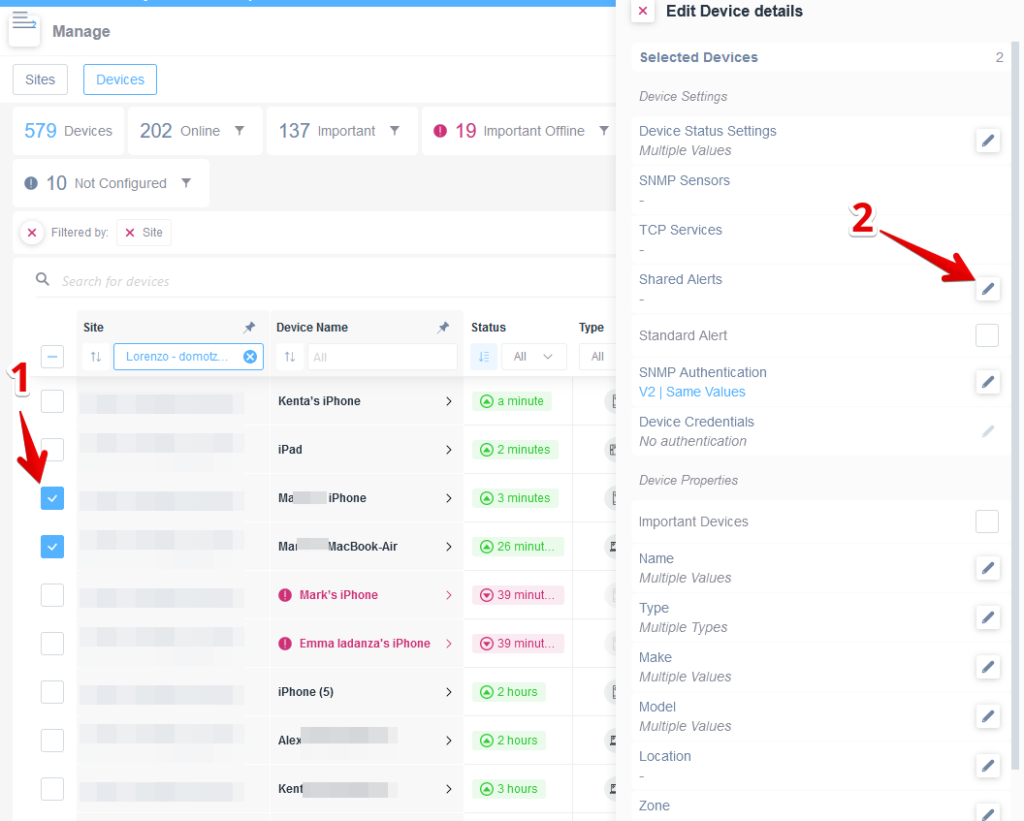
After selecting your desired devices, the “Edit Device details” panel will appear on the right side:
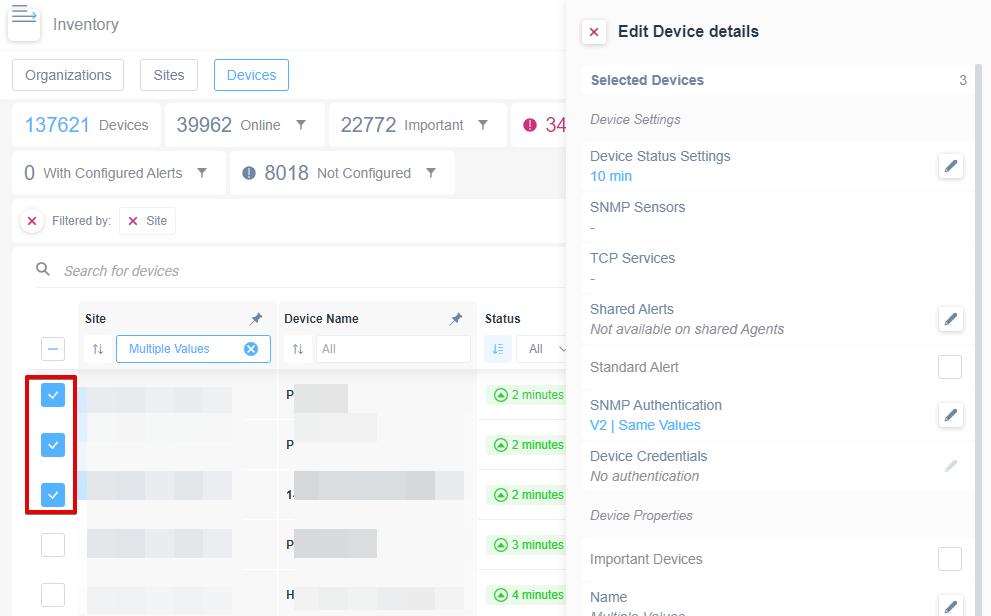
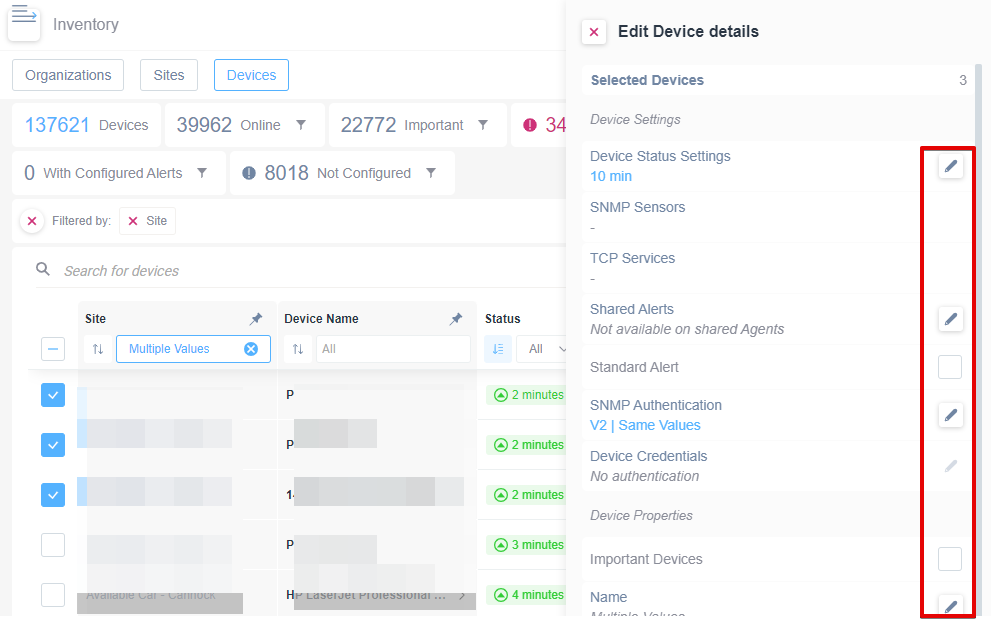
Additionally, from there you’re able to assign a common property/setting on all the selected devices:
Please note that the bulk selection is not available on “Logical Devices also known as Dummy Devices“:
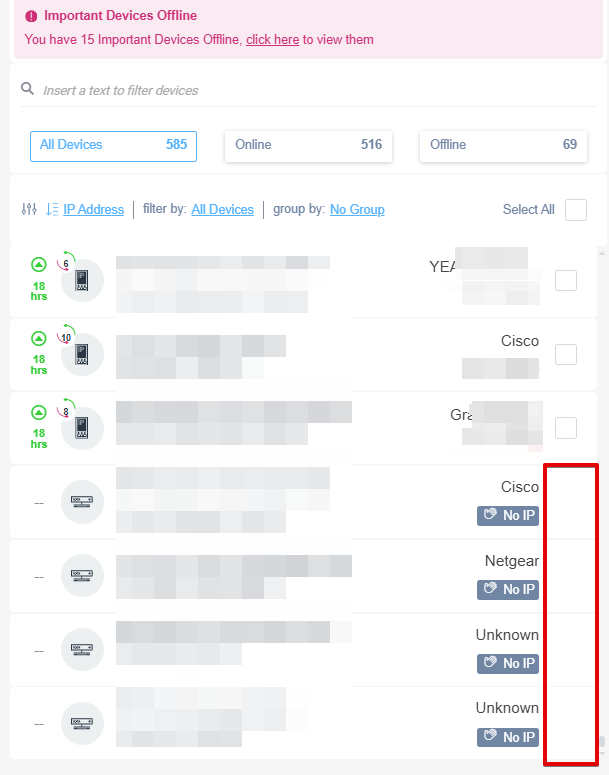
In this case checkboxes will not appear since you cannot apply bulk actions on non-ip connected devices.
Export/Import Device Settings and Properties
The Inventory view is also really useful when you have defined a set of custom SNMP sensors or Shared Alerts and you want to apply them to many other similar devices.
Moreover, to do this you have to search for the device that you want to export your settings from, select it, and click on the Export Device Settings and Properties link:
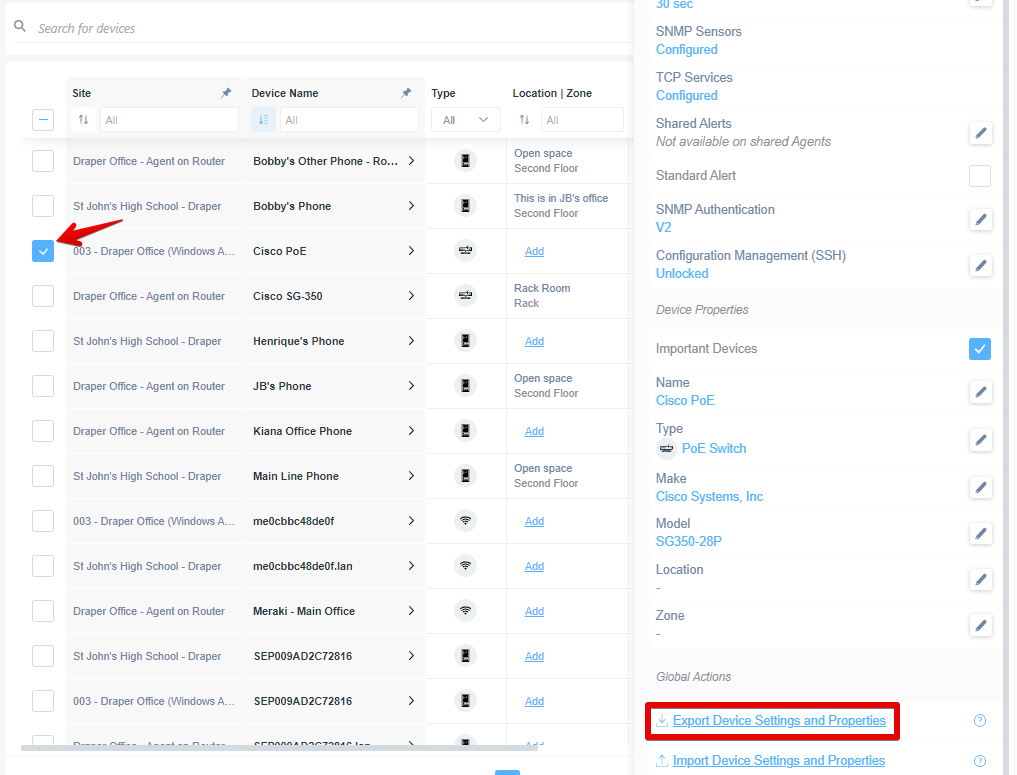
This will save a JSON file on your computer.
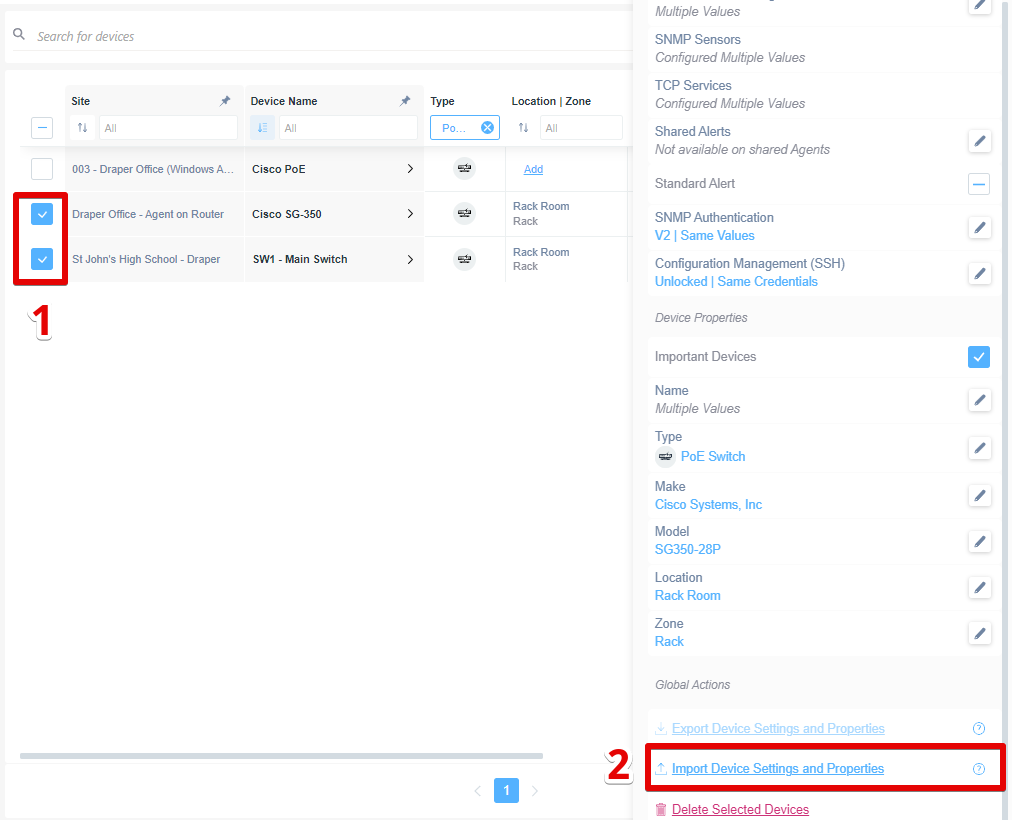
Afterwards, search for the devices that you want to import those “properties” to, select them, and click on the Import Device Settings and Properties button:
See/Add Shared Alerts
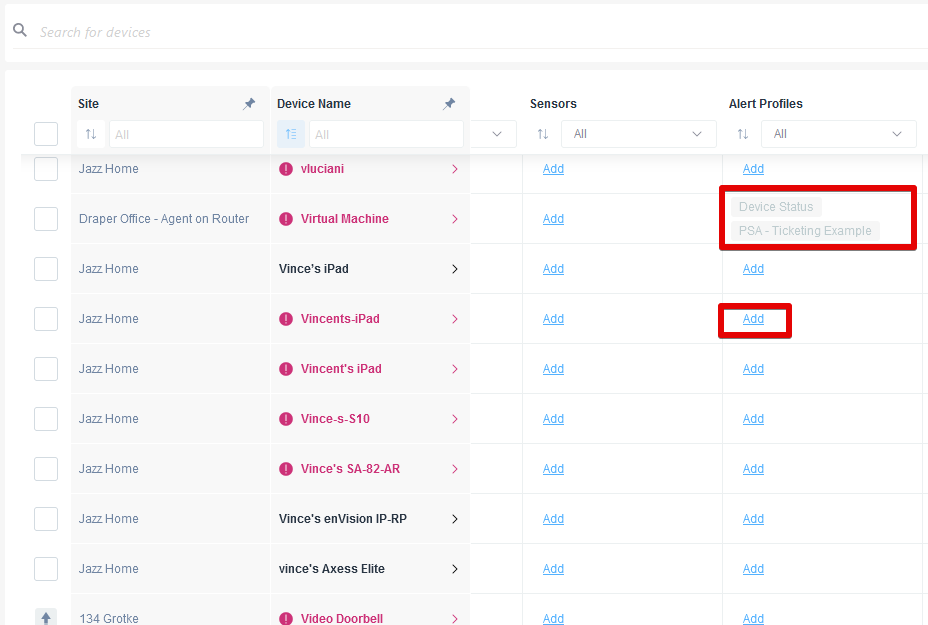
You can now easily see any shared alerts that are applied to a device. You can also easily add new shared alters by clicking the “Add” link:
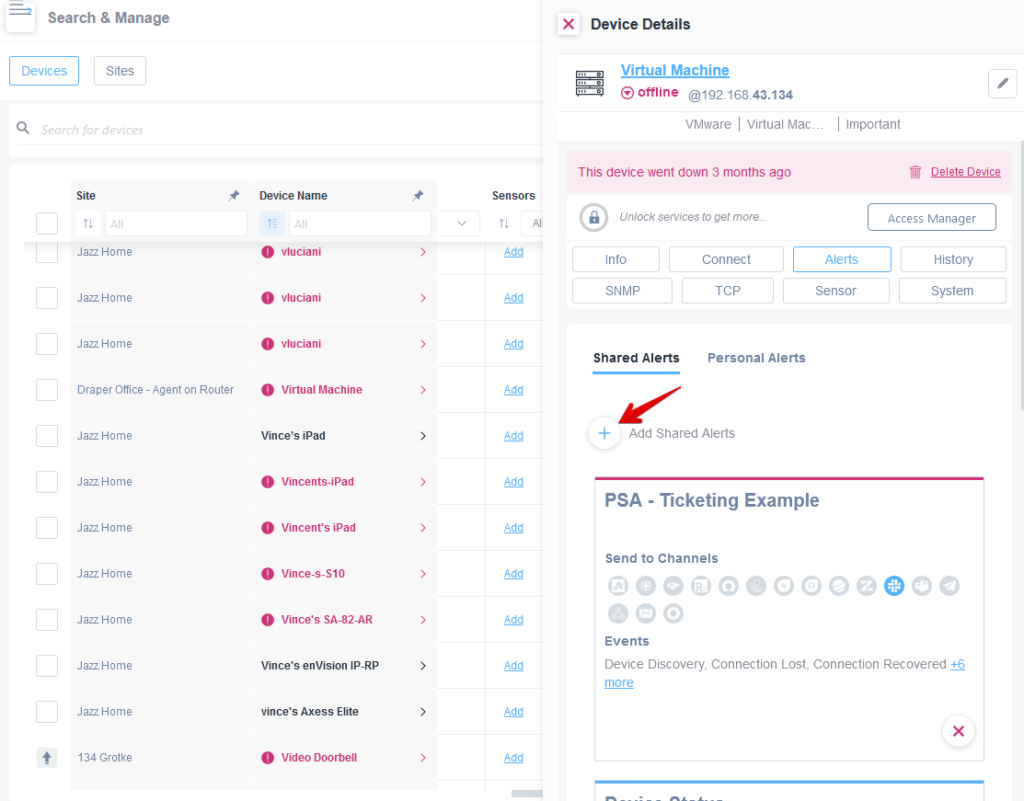
A side panel will appear on the right side where you can manage the device’s alerts:
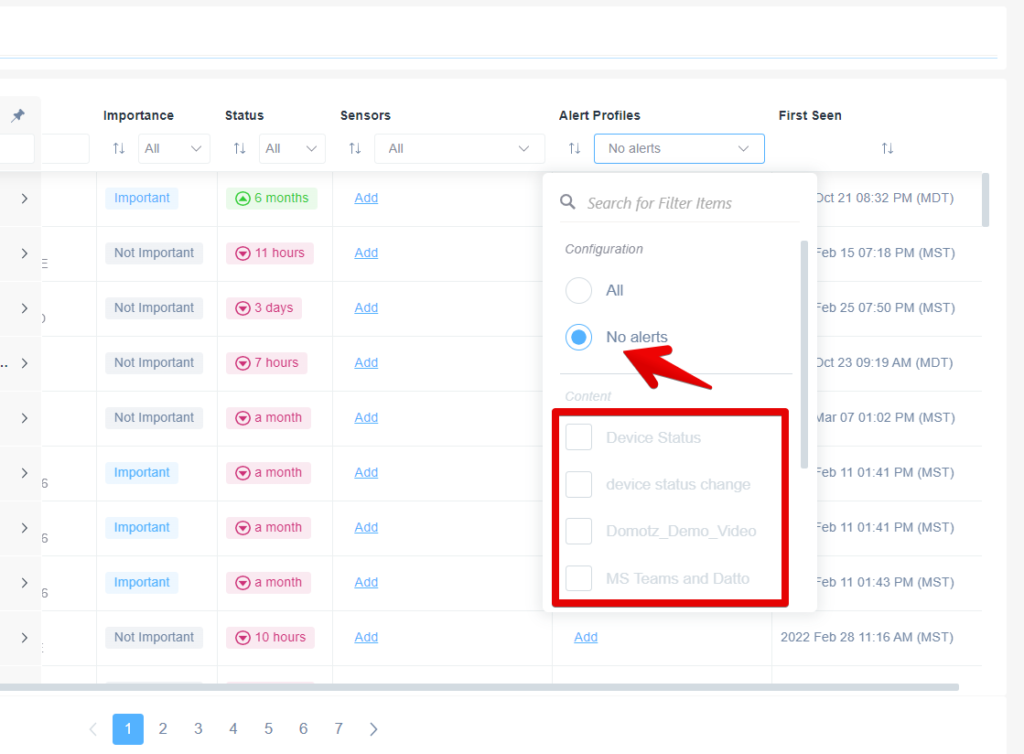
Additionally, you can search for all the Important Devices within specific Customer Sites that have a specific alert profile attached to them. Contrastingly, you can also search for those that haven’t been configured with a Shared Alert yet.
Add Shared Alert Profiles to multiple devices
You can assign also the Shared alerts in bulk. To do this please search and select the desired devices and then click on the Shared Alerts menu entry:
See/Add Sensors and/or Drivers
(Pre-configured and Custom SNMP sensors, TCP sensors, Custom Integrations Drivers)
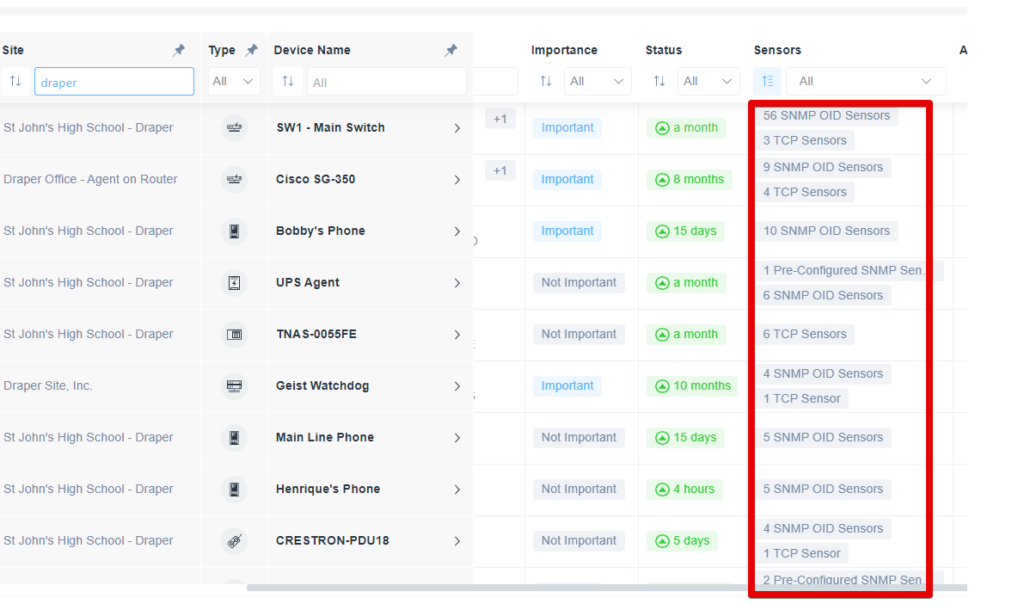
You can search for devices that have sensors configured for further analysis:
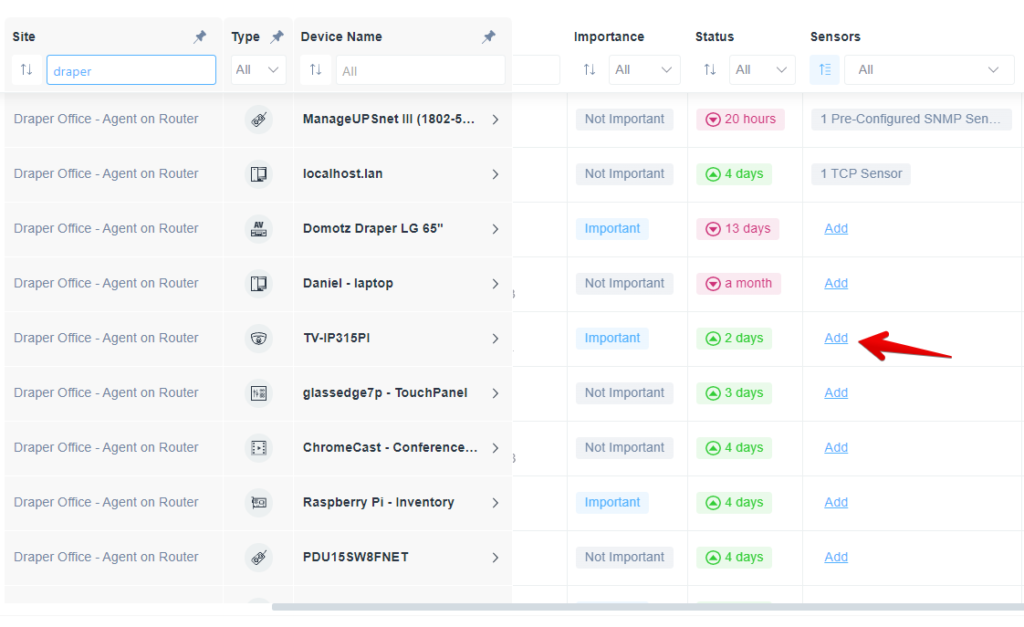
Alternatively, you can add sensors directly to a device by using the “Add” link.
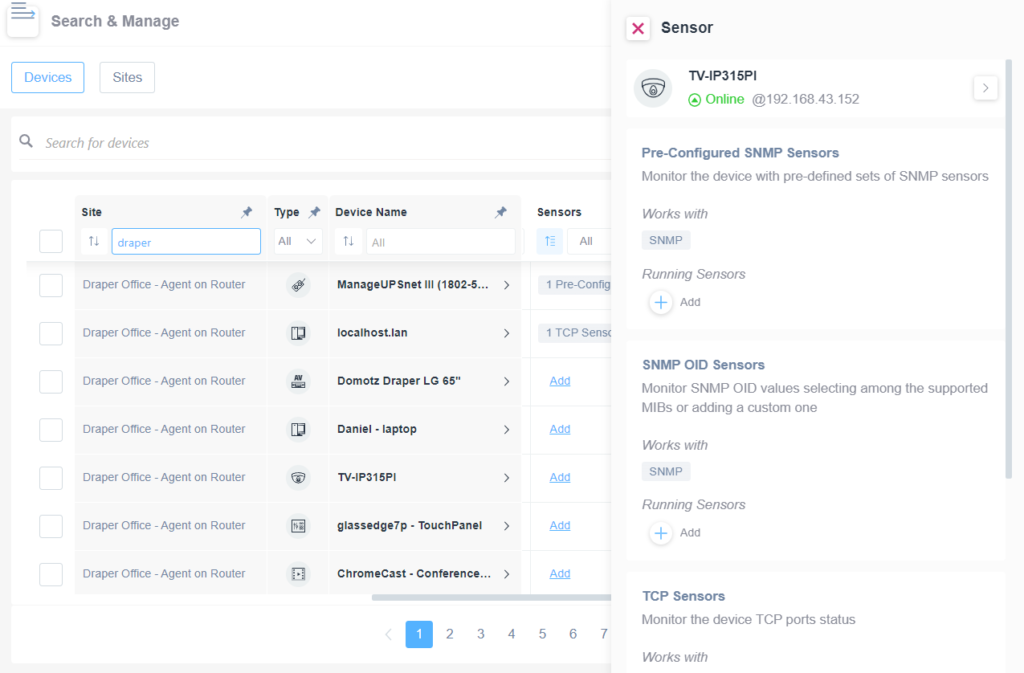
A side panel will appear on the right side allowing you to add sensors to the device:
Devices with additional capabilities (Insights column)
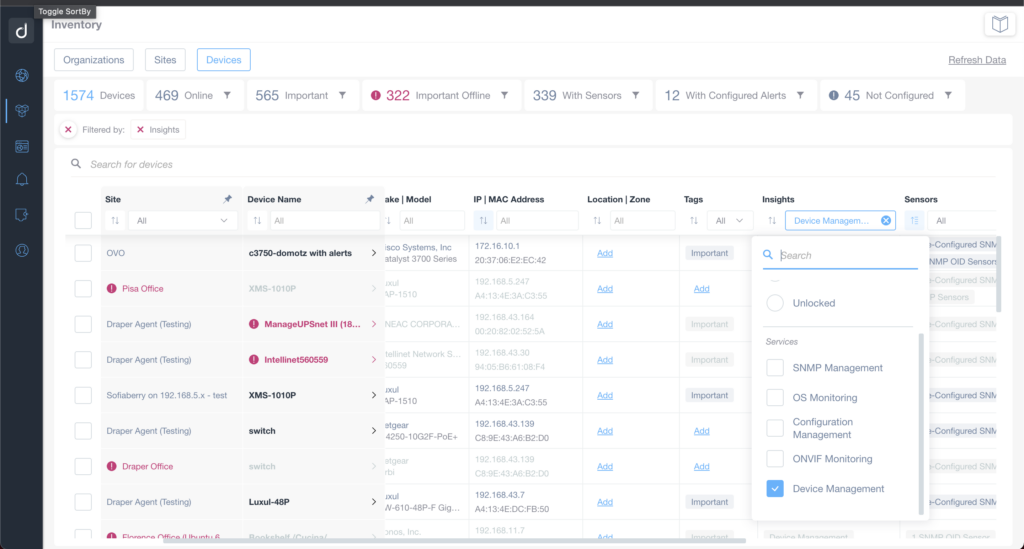
Firstly, the Insights column indicates whether your individual devices support special configurations (e.g. OS Monitoring, SNMP Management, ONVIF Monitoring or Network Configuration Management, Device Management Overview). Please note, to set-up these configurations the Domotz system requires additional credentials.
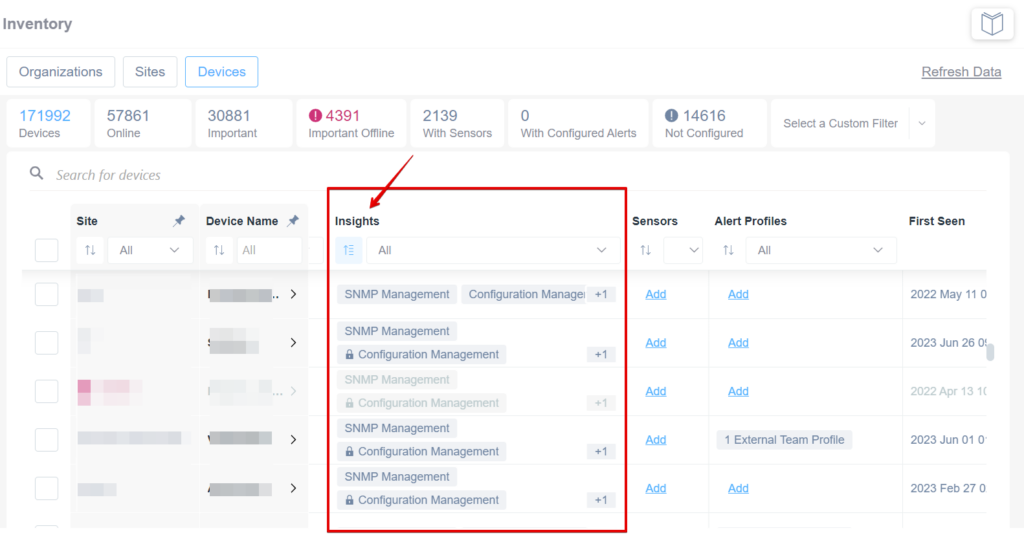
This column enables you to proactively review all the devices which can be unlocked for additional capabilities so you can quickly identify them.
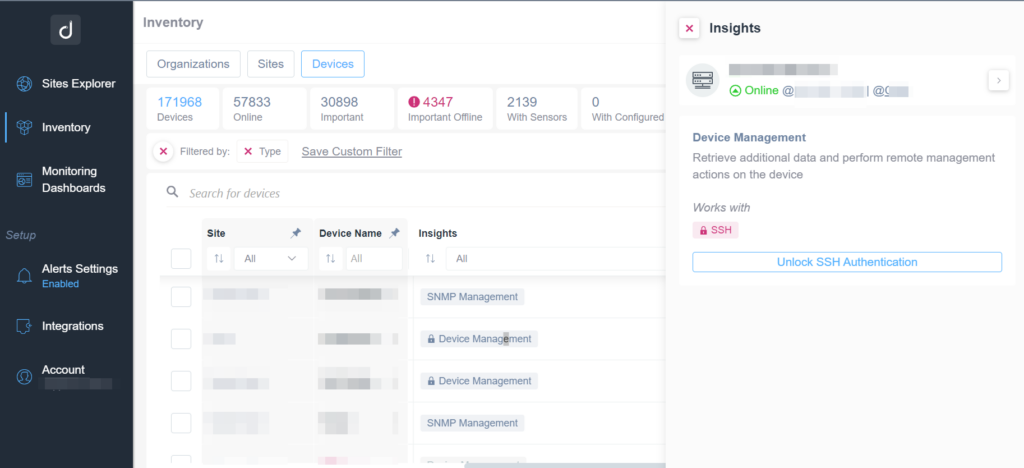
Ultimately, it gives you an easy to use filter for finding features on devices that are available but that you’re not yet using.
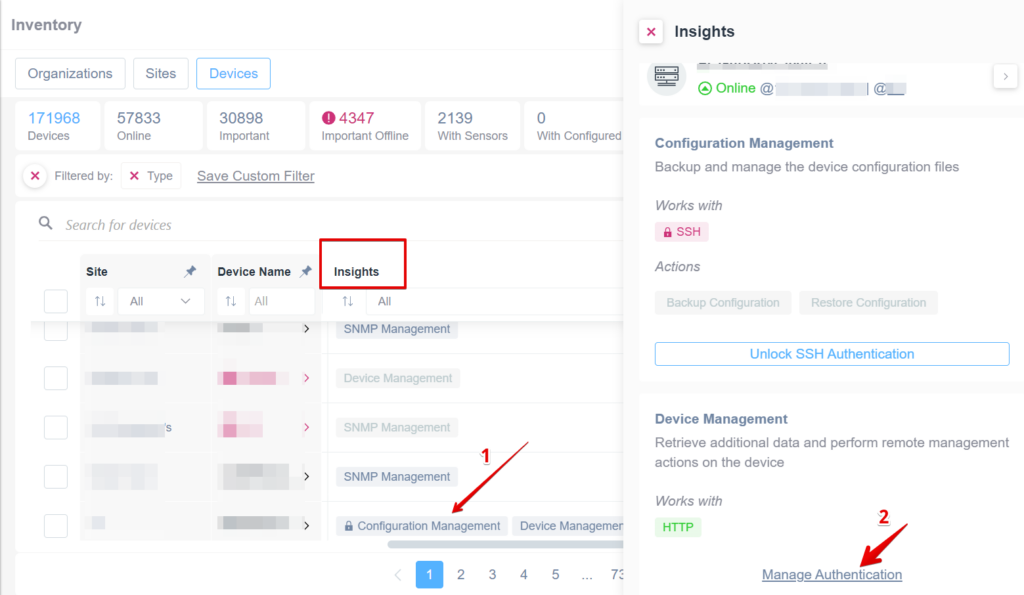
Additionally, by clicking the capability highlighted (for example “Configuration Management”) you will be able to enable the feature directly on the device:
Actions
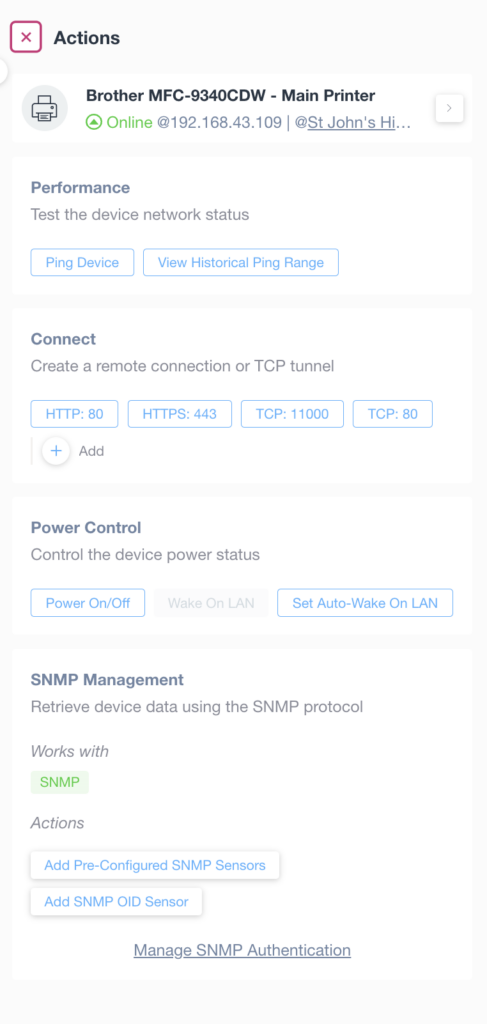
For each device, there is also a quick “Action” button in the last column (Actions) which provides quick access to all the Action capabilities offered for that specific device:
Custom Filters
To see how to create custom filters inside the Inventory dashboard for both Sites and Devices sections please see here.
