Here’s the latest features we’ve added to Domotz. We’ve added a new integration added with Kaseya BMS ticketing system. We’ve also added new MIB discovery events and the possibility to add multiple Shared Alerts to the same device/agent to manage multiple communication channels. Event on new MIB discovered. Uptime percentage for Agent and Devices on Public API. Microsoft Power BI connector and template.
What’s new
Kaseya BMS Integration
It is now possible to connect a Kaseya BMS account into Domotz. Kaseya BMS will become one of the available Contact Channels available to be used in Shared Alerts. This means that Domotz creates and updates Kaseya BMS Tickets when a specific event occurs on the networks or devices monitored through Domotz.
Domotz creates a Kaseya BMS Ticket for any specified alert within Domotz. The same ticket is updated by Domotz automatically, in the case other events occur on the same network or device, and as far as the ticket is still open in Kaseya BMS. When the previous ticket is closed and a new event occurs on the same network or device, a new ticket will be opened and a reference to the previous ticket is provided.

Users are required to associate each Domotz Agent to one specific Kaseya BMS Account so that every time the ticket is automatically created in ServiceNow, it flows under that specific Customer/Site.
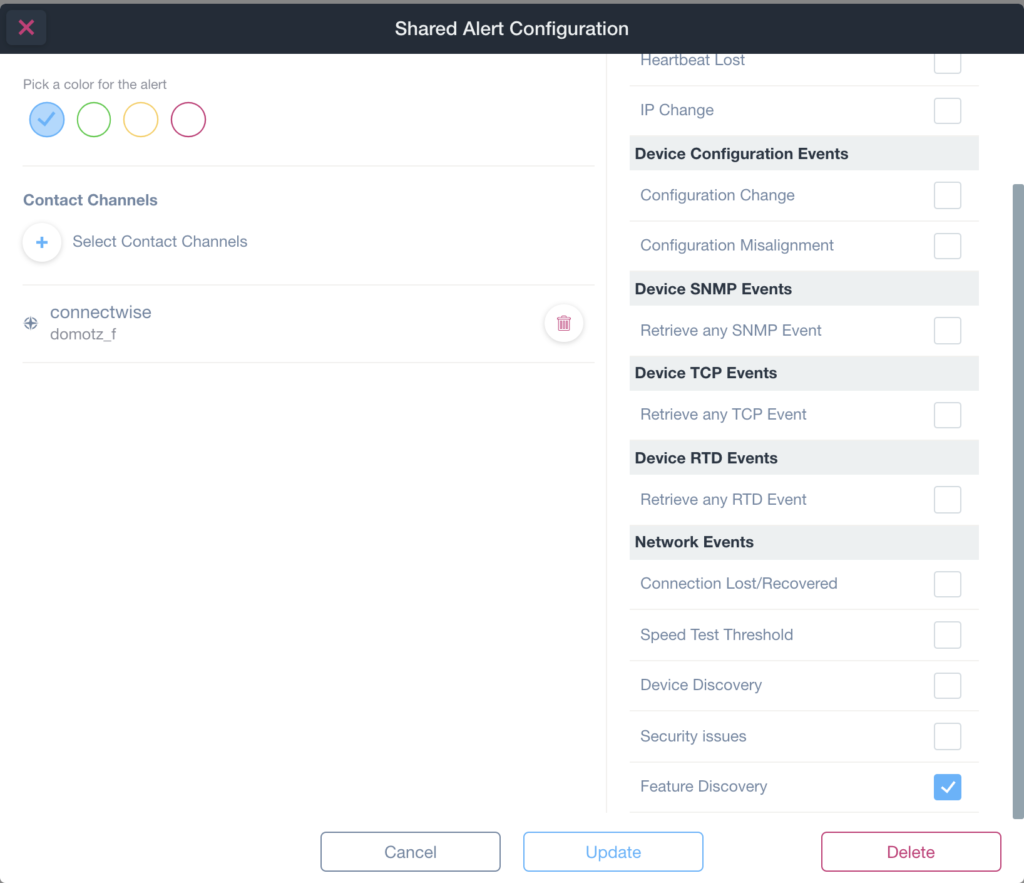
Multiple Shared Alerts
It is now possible to associate multiple Shared Alerts to the same Device or the same Domotz Agent in order to manage different communication channels for a different types of events.
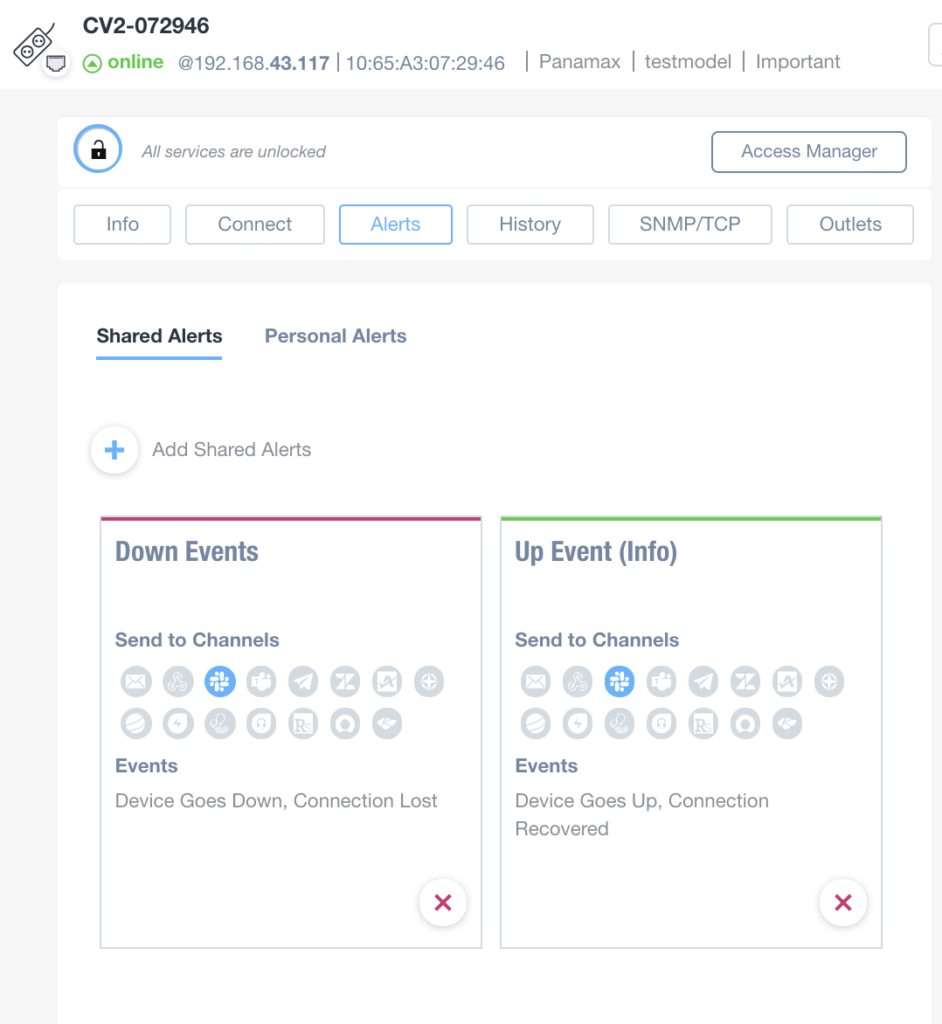
In this way it is possible to have a Shared Alert, configured to retrieve Down events (Connection Lost) and notify a specific channel (e.g. Warning/Error message – red), and a different Shared Alert, configured to retrieve Up events (Connection Recovered) and notify a different channel (e.g. Info message – green).
New MIB Discovery Event
We’ve added New MIB Discovery Events to Domotz. It is now possible to receive notifications via Shared Alerts, as soon as a new MIB has been discovered within any Device on the Network:
This capability is very useful when using a WebHook, and an automation system to analyze new devices or new MIB discovered on Devices on the Network.
For examples of the usage of the WebHook and this new notification, please refer to the guide “SNMP tutorial: Automating SNMP setups using Node-RED “. Also available on the Webinar.
Microsoft Power BI
It is now possible to create beautiful custom reports and analytics using Microsoft Power BI. Domotz has released a connector that allows users to retrieve information out of the Domotz cloud directly into Power BI dashboards.
For more information about the connector, visit the blog post.
Domotz has also created an example of a very nice and powerful template that can be used as a starting point for creating your own, customized dashboard:
For more information about the template, visit the full description here.
Improvements
NetBios and DHCP name data discovery
Domotz basic discovery has been improved so that NetBios and DHCP names for machines and devices on the network help identify all the assets on the network.
Public API: Agent and Device uptime
It is now possible to retrieve the uptime percentage of a specific Agent for a defined time window (together with the list of all the Up/Down events in that same time window).
It is also possible to retrieve the uptime percentage on specific Device. When retrieving the uptime for a Device, the API will also return details about the availability of the Domotz Agent (which can be used as confidence grade for the monitoring of the device itself).
Fix
- FreshDesk integration not working when “Garden” licensing plan is used on FreshDesk. This issue has been resolved.
- Under certain circumstances, Domotz Windows Agent failed to start after the installation. This issue has been identified and resolved.
- Sensor Consumption bar (SNMP/TCP Sensors, number of subnets, Remote Connection traffic, etc), was not correctly represented.
- Extended User Interface TimeOut when retrieving OiD preview values (SNMP) on real-time query.
Known limitations
- VPN on Demand is currently not supported on Luxul Router based Agents. As soon as Luxul team will provide Domotz with the API resources to make this available, Domotz will add this capability.
- SNMP/TCP configured for deleted devices affects the total counting of SNMP sensors and TCP service monitoring.
- Devices with multiple network interfaces (multiple MAC addresses) can’t be merged into a single device. This affects also some types of switches that appear as multiple instances on Domotz when VLANs are configured.
- The static IP address on the Domotz Box cannot be configured before configuring the Agent.
- DHCP cannot be leveraged on additional VLANs on the Domotz Box.
- Configuration Management for Cisco IOS devices is currently not available when Domotz Agent is hosted on Windows machines.
- SAML/SSO: currently it is not possible to login into Domotz starting from the supported Identity Provider Portals.
This change log covers what’s changed in Domotz Pro service since previous Release Notes. These changes include Domotz Pro cloud, Domotz Agent and Domotz Pro App.